Torque Vectoring Market Size 2024-2028
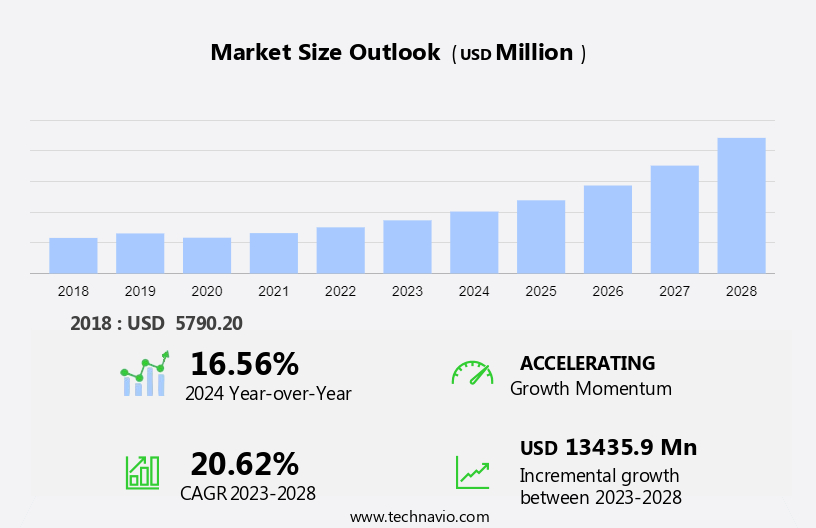
The torque vectoring market size is forecast to increase by USD 13.44 billion at a CAGR of 20.62% between 2023 and 2028.
- The market in the SUV segment is experiencing significant growth due to several key factors. One of the primary drivers is the increasing demand for improved safety and vehicle dynamics in SUV models, including Compact, Mid-size, and Class D SUVs. This has led to the adoption of torque vectoring technology in both Front Wheel Drive and Rear Wheel Drive systems.
- Additionally, the growing popularity of Battery Electric Vehicles (BEVs) in the light commercial vehicles and hybrid electric vehicles (HEVs) in the passenger car market is also fueling the demand for torque vectoring technology. Furthermore, the increasing trend towards mobility services is expected to further boost the market growth. Passive torque vectoring systems, which enhance vehicle stability and handling, are particularly gaining traction in the SUV segment. Overall, the market is poised for continued growth in the coming years.
Torque Vectoring Market Analysis
How is this market segmented and which is the largest segment?
The market research report provides comprehensive data (region-wise segment analysis), with forecasts and estimates in "USD million" for the period 2024-2028, as well as historical data from 2018-2022 for the following segments.
- Type
- Passenger car
- Light commercial vehicle
- Geography
- Europe
- Germany
- UK
- North America
- Canada
- US
- APAC
- China
- South America
- Middle East and Africa
- Europe
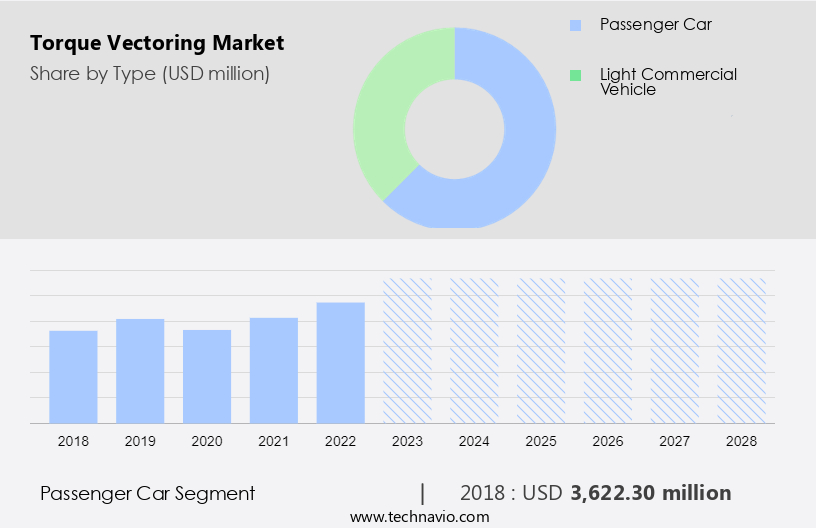
By Type Insights
The passenger car segment is estimated to witness significant growth during the forecast period. The passenger vehicle market in the United States and other developed countries has witnessed significant growth due to rising per capita income and increasing leisure activities. This industry, however, faced challenges during economic downturns, such as the recessions in the U.S. And Europe, leading some manufacturers like General Motors, Ford, and Chrysler to secure loans for production continuation. The passenger vehicle market is segmented into compact, mid-size, large, and premium categories. The demand for Special Utility Vehicles (SUVs), including Compact and Mid-size SUVs, has flooded due to their versatility and popularity. Advanced technologies like Passive Torque Vectoring, available in SUV models, enhance vehicle stability and performance.
Moreover, the emergence of Battery Electric Vehicles (BEVs) and Hybrid Electric Vehicles (HEVs) is reshaping the market landscape. In the context of the evolving automotive industry, it's crucial for manufacturers to adapt and innovate to cater to the changing consumer preferences and regulatory requirements.
Get a glance at the market share of various segments Request Free Sample
The passenger car segment accounted for USD 3.62 billion in 2018 and showed a gradual increase during the forecast period.
Will Europe become the largest contributor to the Torque Vectoring Market?
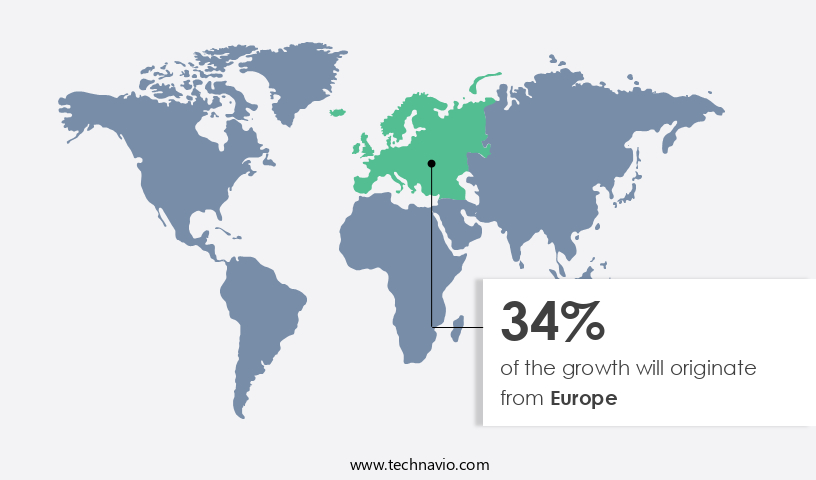
Europe is estimated to contribute 34% to the growth of the global market during the forecast period. Technavio's analysts have elaborately explained the regional trends and drivers that shape the market during the forecast period.
For more insights on the market share of various regions Request Free Sample
The European automobile market faced challenges in 2020 due to geopolitical tensions, such as the Ukraine-Russia conflict, and the COVID-19 pandemic's impact on the industry. Despite these setbacks, Europe's commitment to emission control regulations continues to drive the adoption of advanced technologies, including torque vectoring, in Light Commercial Vehicles (LCVs) and Heavy Commercial Vehicles (HCVs). Active torque vectoring systems, which use hydraulic clutches or electronic clutches to distribute engine torque to individual wheels for improved vehicle handling and stability, are gaining popularity. The rise of autonomous vehicles and the increasing demand for fuel efficiency are also contributing factors. Furthermore, the growing trend towards hybrid vehicles is expected to boost the market in Europe. The region's government initiatives, such as subsidies and tax incentives, are further encouraging the adoption of electric and hybrid vehicles. As a result, the market for torque vectoring technology in Europe is expected to grow significantly in the coming years.
Our researchers analyzed the data with 2023 as the base year, along with the key drivers, trends, and challenges. A holistic analysis of drivers will help companies refine their marketing strategies to gain a competitive advantage.
Market Dynamics
- Torque vectoring is an advanced technology that optimizes the distribution of engine torque to enhance vehicle stability, improve traction, and provide better cornering performance. This technology is increasingly gaining importance in various vehicle segments, including premium vehicles, off-road vehicles, electric vehicles, and light and heavy duty vehicles. Torque vectoring is a critical component of advanced all-wheel-drive systems. It enables precise control of individual wheels, ensuring optimal power delivery to the ground, thereby reducing understeer and improving overall vehicle handling. This technology is widely used in all four-wheel drive systems, luxury cars, and performance vehicles. With the increasing focus on clean energy and reducing carbon emissions, electric vehicles are becoming an integral part of the transportation industry.
- Further, torque vectoring technology in electric vehicles helps optimize battery usage and improve overall vehicle efficiency. The automotive industry is witnessing significant advancements in powertrain electrification, with hybrid vehicles gaining popularity due to their improved fuel efficiency and reduced emissions. Torque vectoring technology is an essential component of hybrid vehicle powertrains, enabling precise control of the electric motor and internal combustion engine for optimal performance and efficiency. Torque vectoring technology is also being increasingly adopted in light commercial vehicles and heavy commercial vehicles. This technology helps improve vehicle stability and traction, particularly in challenging road conditions, thereby enhancing safety and productivity.
- Additionally, the implementation of torque vectoring technology involves the use of sensors, algorithms, hydraulic clutches, and electronic clutches. These components work together to distribute torque to the wheels based on road conditions and driving requirements. The use of sensors and algorithms enables real-time monitoring and adjustment of torque distribution, ensuring optimal vehicle performance and efficiency. In conclusion, torque vectoring technology is an essential component of modern vehicle powertrains, providing improved vehicle performance, stability, and efficiency.
What are the key market drivers leading to the rise in adoption of Torque Vectoring Market ?
Improved safety and vehicle dynamics is the key driver of the market.
- The market is experiencing significant growth due to the increasing demand for enhanced performance and safety in various vehicle types, including high performance cars, sports cars, and racing vehicles, as well as crossover vehicles. This technology optimizes torque distribution to individual wheels based on data from sensors that monitor wheel steering angle, yaw rate, and wheel speed. By doing so, it improves traction and cornering capabilities, reducing understeer and ensuring better control, especially in challenging road conditions.
- This technology is particularly beneficial in all-wheel drive (AWD) systems, which distribute power to all four wheels, eliminating the need to switch between 2WD and 4WD modes. Torque vectoring technology enhances the driving experience by providing real-time adjustments to torque distribution, ensuring optimal vehicle response and improved handling.
What are the trends shaping the Torque Vectoring Market?
Growing demand for electric vehicles is the upcoming trend in the market.
The market encompasses the use of torque distribution technology in various vehicle types, including premium vehicles, off-road vehicles, and electric vehicles. Advanced features such as all-wheel drive, torque vectoring, and powertrain electrification are increasingly popular in luxury cars. As the world transitions to electric vehicle models, the market is poised for significant growth. The integration of advanced connectivity and autonomous driving technologies further enhances the appeal of electric vehicles, making them an attractive option for consumers.
What challenges does Torque Vectoring Market face during the growth?
Growing mobility services is a key challenge affecting the market growth. The expansion of mobility services, driven by infrastructure and IT advancements, is leading to an increase in pooling services through applications and remote offerings. This trend is transforming the automotive industry as car technologies receive over-the-air upgrades, enabling more connectivity and shared services. As a result, consumers are shifting towards more convenient and cost-effective transportation options, potentially reducing the need for car ownership. Consequently, the growth of shared mobility services may hinder the development of the market during the forecast period. Key technologies such as slippery road management, emission reduction, fuel economy, stability control, lane departure warning, adaptive cruise control, emergency braking, and semi-autonomous driving continue to gain importance in the automotive industry.
Exclusive Customer Landscape
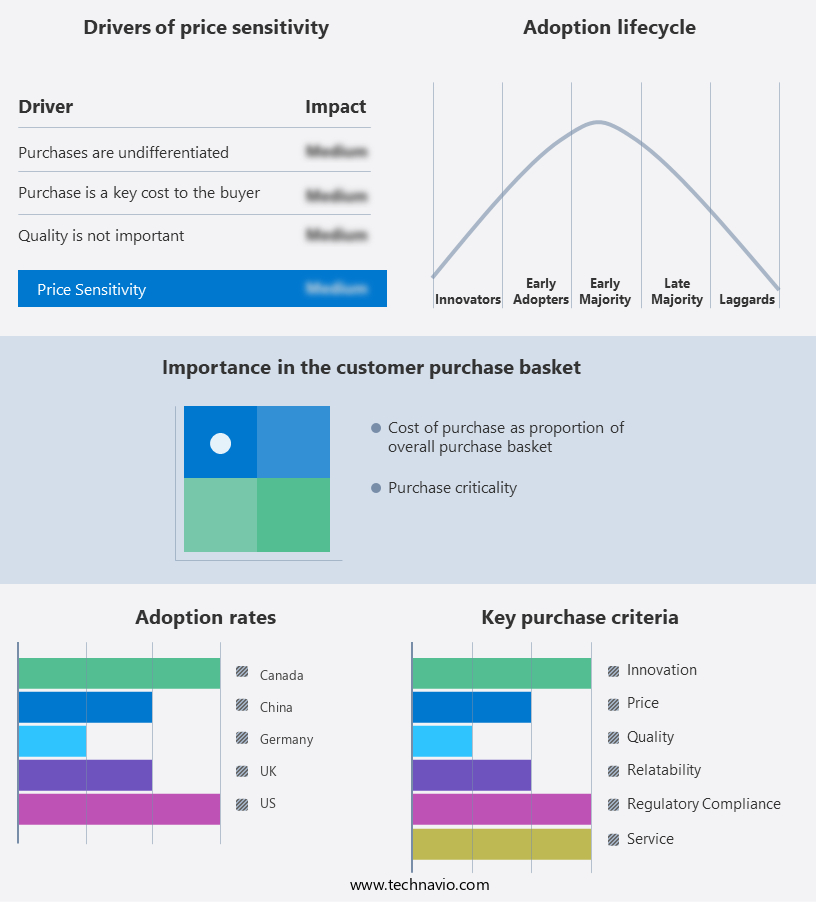
The market forecasting report includes the adoption lifecycle of the market, covering from the innovator's stage to the laggard's stage. It focuses on adoption rates in different regions based on penetration. Furthermore, the report also includes key purchase criteria and drivers of price sensitivity to help companies evaluate and develop their market growth analysis strategies.
Customer Landscape
Key Companies & Market Insights
Companies are implementing various strategies, such as strategic alliances, partnerships, mergers and acquisitions, geographical expansion, and product/service launches, to enhance their presence in the market.
BorgWarner Inc.- The company offers torque vectoring such as torque converter clutch.
The market research and growth report includes detailed analyses of the competitive landscape of the market and information about key companies, including:
- American Axle and Manufacturing Holdings Inc.
- Continental AG
- Dana Inc.
- Eaton Corp. Plc
- Ford Motor Co.
- Hyundai Motor Co.
- JTEKT Corp.
- Linamar Corp.
- Magna International Inc.
- Melrose Industries Plc
- Ricardo Plc
- Robert Bosch GmbH
- Schaeffler AG
- Xtrac Ltd.
- ZF Friedrichshafen AG
Qualitative and quantitative analysis of companies has been conducted to help clients understand the wider business environment as well as the strengths and weaknesses of key market players. Data is qualitatively analyzed to categorize companies as pure play, category-focused, industry-focused, and diversified; it is quantitatively analyzed to categorize companies as dominant, leading, strong, tentative, and weak.
Research Analyst Overview
The market is witnessing significant growth due to the increasing demand for advanced safety systems and performance enhancement in premium vehicles, off-road vehicles, and electric vehicles. Torque vectoring is a technology that enables precise distribution of engine torque to each wheel for improved vehicle stability, handling, and traction. Premium vehicles, including luxury cars and sports utility vehicles (SUVs), are major contributors to the market. Advanced connectivity and autonomous driving features are driving the demand for torque vectoring in these vehicles. Electric vehicles, such as battery electric vehicles (BEVs) and hybrid electric vehicles (HEVs), are also adopting torque vectoring for powertrain electrification and improved performance. Torque vectoring is also gaining popularity in off-road vehicles, light duty vehicles, and heavy duty vehicles for enhanced traction and stability.
Furthermore, the technology is used in both front-wheel drive (FWD) and rear-wheel drive (RWD) vehicles, as well as in all-wheel drive (AWD) systems. Passive torque vectoring and active torque vectoring are the two main types of torque vectoring systems used in the automotive industry. The market is expected to grow significantly due to the increasing demand for improved safety systems, such as electronic stability control and safety systems, in passenger cars, light commercial vehicles, and heavy commercial vehicles. The market is also driven by the growing focus on reducing carbon emissions and promoting clean energy through propulsion technologies, such as hydraulic clutch and electronic clutch systems. In conclusion, the Market is poised for growth due to the increasing demand for advanced safety systems, performance enhancement, and propulsion technologies in premium vehicles, electric vehicles, and SUVs. The market is expected to continue growing as automotive manufacturers focus on improving vehicle handling, traction, and stability across various vehicle segments.
|
Market Scope |
|
|
Report Coverage |
Details |
|
Page number |
152 |
|
Base year |
2023 |
|
Historic period |
2018-2022 |
|
Forecast period |
2024-2028 |
|
Growth momentum & CAGR |
Accelerate at a CAGR of 20.62% |
|
Market growth 2024-2028 |
USD 13.44 billion |
|
Market structure |
Concentrated |
|
YoY growth 2023-2024(%) |
16.56 |
|
Regional analysis |
Europe, North America, APAC, South America, and Middle East and Africa |
|
Performing market contribution |
Europe at 34% |
|
Key countries |
Germany, UK, US, China, and Canada |
|
Competitive landscape |
Leading Companies, Market Positioning of Companies, Competitive Strategies, and Industry Risks |
|
Key companies profiled |
American Axle and Manufacturing Holdings Inc., BorgWarner Inc., Continental AG, Dana Inc., Eaton Corp. Plc, Ford Motor Co., Hyundai Motor Co., JTEKT Corp., Linamar Corp., Magna International Inc., Melrose Industries Plc, Ricardo Plc, Robert Bosch GmbH, Schaeffler AG, Xtrac Ltd., and ZF Friedrichshafen AG |
|
Market dynamics |
Parent market analysis, market growth inducers and obstacles, market forecast, fast-growing and slow-growing segment analysis, COVID-19 impact and recovery analysis and future consumer dynamics, market condition analysis for the forecast period |
|
Customization purview |
If our market report has not included the data that you are looking for, you can reach out to our analysts and get segments customized. |
What are the Key Data Covered in this Market Research and Growth Report?
- CAGR of the market during the forecast period
- Detailed information on factors that will drive the market growth and forecasting between 2024 and 2028
- Precise estimation of the size of the market and its contribution of the market in focus to the parent market
- Accurate predictions about upcoming market growth and trends and changes in consumer behaviour
- Growth of the market across Europe, North America, APAC, South America, and Middle East and Africa
- Thorough analysis of the market's competitive landscape and detailed information about companies
- Comprehensive analysis of factors that will challenge the growth of market companies
We can help! Our analysts can customize this market research report to meet your requirements. Get in touch
 RIA -
RIA - 
