Automotive Touch Screen Control Systems Market Analysis, Size, and Forecast 2026-2030: APAC (Japan, India, and China), Europe (Germany, France, and UK), North America (US, Mexico, and Canada), South America (Brazil, Argentina, and Colombia), Middle East and Africa (Saudi Arabia, UAE, and South Africa), and Rest of World (ROW)

Automotive Touch Screen Control Systems Market Analysis, Size, and Forecast 2026-2030:
APAC (Japan, India, and China), Europe (Germany, France, and UK), North America (US, Mexico, and Canada), South America (Brazil, Argentina, and Colombia), Middle East and Africa (Saudi Arabia, UAE, and South Africa), and Rest of World (ROW)

Published: Mar 2026 294 Pages SKU: IRTNTR70386

Market Overview at a Glance

$3.18 B
Market Opportunity
5.4%
CAGR 2025 - 2030
51.2%
APAC Growth
$5.84 B
Resistive segment 2024

Automotive Touch Screen Control Systems Market Size 2026-2030

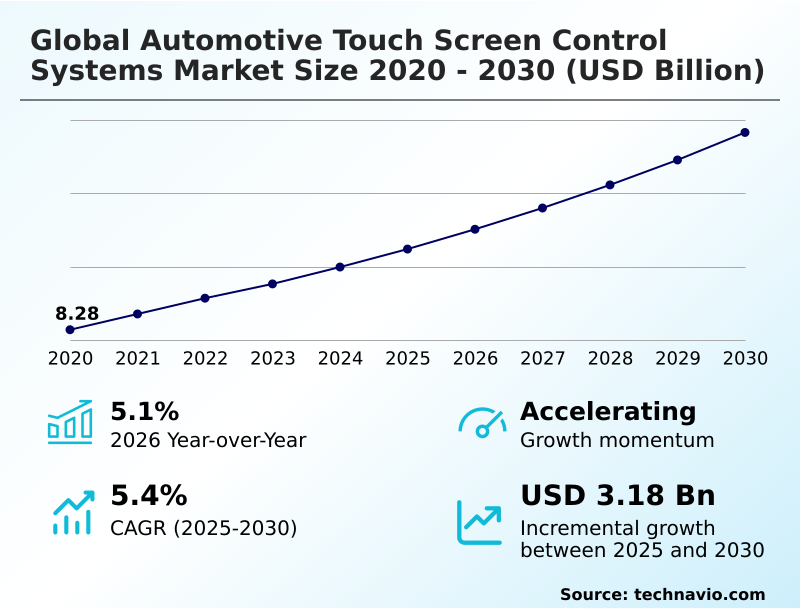
The automotive touch screen control systems market size is valued to increase by USD 3.18 billion, at a CAGR of 5.4% from 2025 to 2030. Integration of advanced visual technologies and high resolution displays will drive the automotive touch screen control systems market.

Major Market Trends & Insights

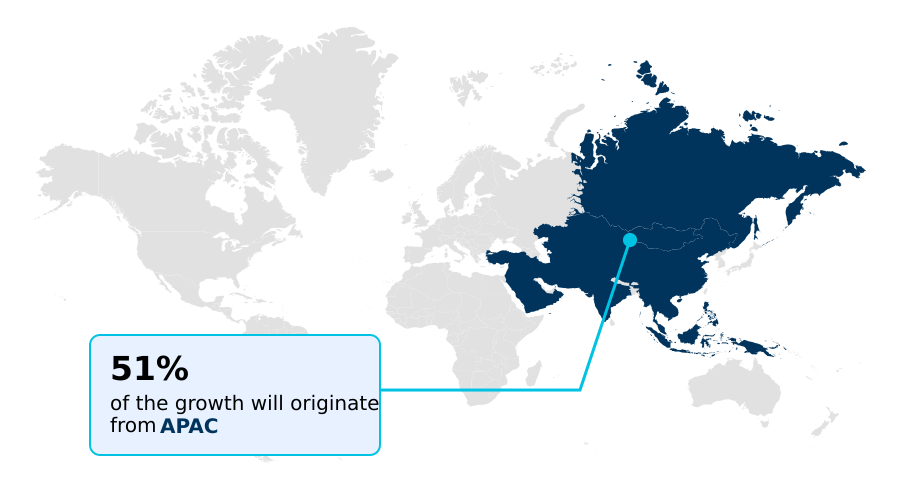
  • APAC dominated the market and accounted for a 51.2% growth during the forecast period.
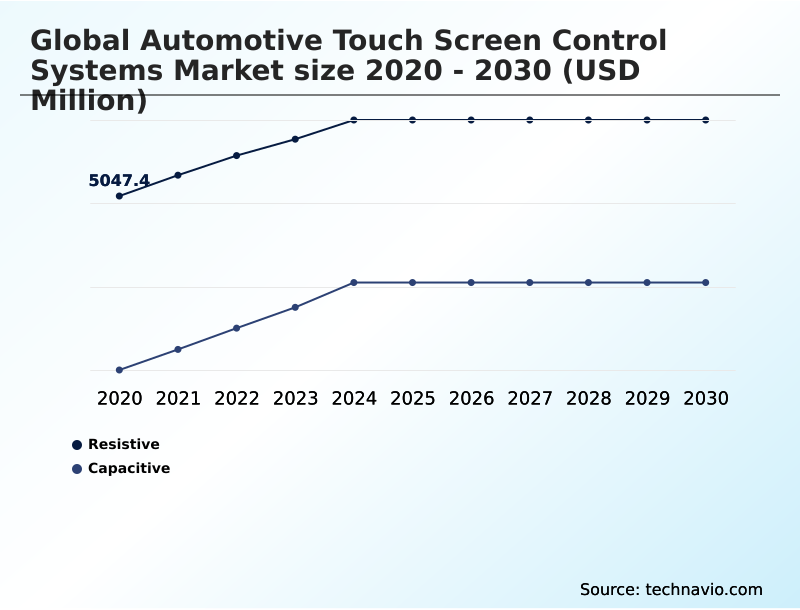
  • By Application - Resistive segment was valued at USD 5.84 billion in 2024
  • By Vehicle Type - Passenger cars segment accounted for the largest market revenue share in 2024

Market Size & Forecast

  • Market Opportunities: USD 5.38 billion
  • Market Future Opportunities: USD 3.18 billion
  • CAGR from 2025 to 2030 : 5.4%

Market Summary

  • The automotive touch screen control systems market is undergoing a significant transformation, driven by the industry-wide shift to software-defined vehicles and connected digital ecosystems. This evolution replaces traditional physical controls with intuitive, high-resolution surfaces that serve as the central hub for the human-machine interface (HMI).
  • Key drivers include the rising adoption of electric vehicles, which favor minimalist interior designs, and consumer demand for sophisticated infotainment that mirrors smartphone functionality. Trends are moving toward expansive, pillar-to-pillar display configurations and the integration of generative AI assistants that offer a proactive user interface.
  • For instance, an OEM must now balance the appeal of a large capacitive touch panel with new safety mandates requiring physical controls for critical functions, a decision impacting both cockpit electronics integration and compliance costs.
  • This dynamic is compounded by challenges such as ensuring in-vehicle cybersecurity and managing supply chain volatility for key components like the touch screen controller IC, pushing innovation in both hardware and software.

What will be the Size of the Automotive Touch Screen Control Systems Market during the forecast period?

Get Key Insights on Market Forecast (PDF) Request Free Sample

How is the Automotive Touch Screen Control Systems Market Segmented?

The automotive touch screen control systems industry research report provides comprehensive data (region-wise segment analysis), with forecasts and estimates in "USD million" for the period 2026-2030, as well as historical data from 2020-2024 for the following segments.

  • Application
    • Resistive
    • Capacitive
  • Vehicle type
    • Passenger cars
    • Commercial vehicles
  • Distribution channel
    • OEM
    • Aftermarket
  • Geography
    • APAC
      • Japan
      • India
      • China
    • Europe
      • Germany
      • France
      • UK
    • North America
      • US
      • Mexico
      • Canada
    • South America
      • Brazil
      • Argentina
      • Colombia
    • Middle East and Africa
      • Saudi Arabia
      • UAE
      • South Africa
    • Rest of World (ROW)

By Application Insights

The resistive segment is estimated to witness significant growth during the forecast period.

Resistive screens remain relevant in specific automotive applications due to their operational durability and cost-effectiveness.

This resistive touch screen technology, which operates via mechanical pressure, is ideal for commercial vehicle control system interface designs and entry-level passenger cars where glove-based operation is common. Unlike a capacitive touch panel, it offers high resistance to environmental contaminants.

The integration of advanced touch screen controller ICs now enables multi-touch gesture recognition, bridging the functionality gap with more modern systems.

This evolution, part of a broader push for better automotive display solutions, allows for a single-chip touch solution that improves input accuracy by over 15% in high-vibration environments, ensuring the technology's place within the connected car HMI and smart cockpit architecture landscape.

Request Free Sample

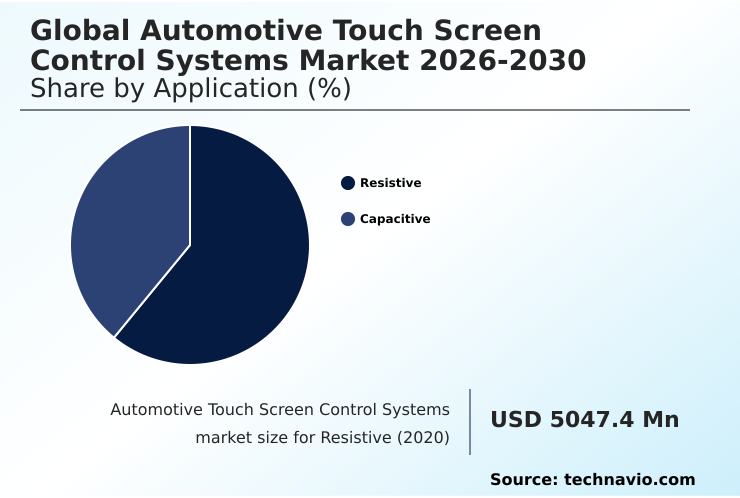
The Resistive segment was valued at USD 5.84 billion in 2024 and showed a gradual increase during the forecast period.

Request Free Sample

Regional Analysis

APAC is estimated to contribute 51.2% to the growth of the global market during the forecast period.Technavio’s analysts have elaborately explained the regional trends and drivers that shape the market during the forecast period.

See How Automotive Touch Screen Control Systems Market Demand is Rising in APAC Request Free Sample

The geographic landscape is dominated by APAC, which accounts for over 51% of incremental growth, driven by its robust electronics manufacturing ecosystem and rapid vehicle electrification. This region is a hub for high-performance computing (HPC) and low latency interface development.

Europe focuses on premium cabin aesthetics and ergonomic cockpit design, integrating features like real-time visual control. North America leverages major technology hubs for advancements in creating an empathetic cabin environment and enabling third-party application integration.

The market in MEA is gaining momentum, fueled by smart city initiatives. These regional dynamics highlight a global push towards a proactive user interface and advanced driver monitoring system (DMS), with regional growth rates varying by as much as 2%.

Market Dynamics

Our researchers analyzed the data with 2025 as the base year, along with the key drivers, trends, and challenges. A holistic analysis of drivers will help companies refine their marketing strategies to gain a competitive advantage.

  • The evolution of automotive HMI design is a central theme, with a clear trajectory away from simple screens toward complex, integrated systems. The debate over resistive vs capacitive automotive screens is largely settled in passenger cars, but the nuances of functional safety in touch controllers remain critical.
  • Integrating AI in vehicle cockpits is no longer a futuristic concept; generative AI in-cabin virtual assistants are becoming key differentiators. This trend is enabled by powerful automotive SoC for digital cockpits and is a core component of software-defined vehicle architecture benefits.
  • However, this advancement introduces new challenges, including the need for robust cybersecurity for automotive touch controls and managing driver distraction from complex touchscreens. The impact of pillar-to-pillar displays and large format displays in electric vehicles is reshaping interior design, while automotive touch panel material science advances to improve durability.
  • As the market bifurcates between OEM vs aftermarket infotainment systems, the ability to deliver OTA updates for infotainment systems becomes a competitive necessity. This is particularly true for centralized computing in automotive design, which streamlines updates and can reduce production costs, even though the initial cost of automotive touch screen production for these systems is higher.
  • The future will likely involve a multi-modal interface for driver safety, combining touch with haptics and voice to address the challenges of touchless gesture control and augmented reality head-up display integration.

What are the key market drivers leading to the rise in the adoption of Automotive Touch Screen Control Systems Industry?

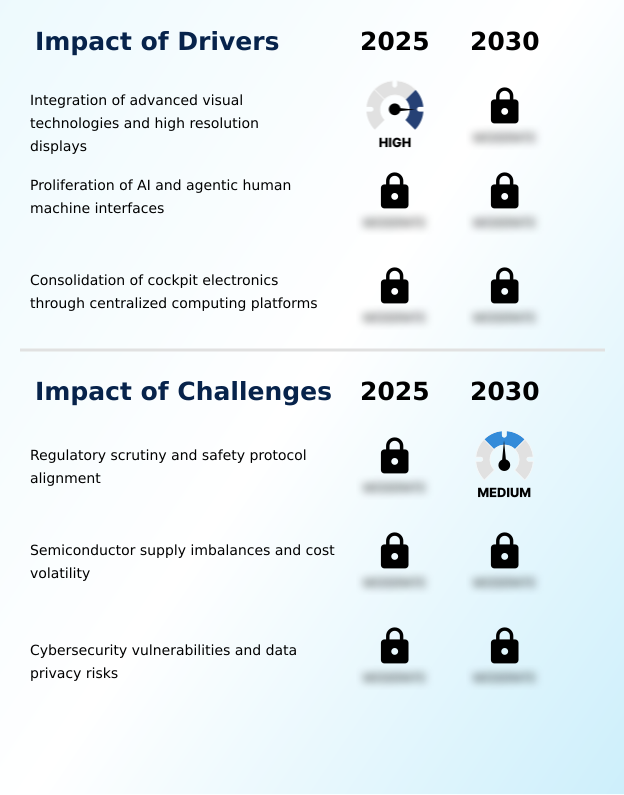
  • The integration of advanced visual technologies and high-resolution displays serves as a primary driver, enhancing user experience and differentiating vehicle cabins in a competitive market.

  • A key driver is the move toward a centralized computing platform, consolidating infotainment, instrument clusters, and ADAS into a single high-performance unit.
  • This approach, integral to the software-defined vehicle (SDV) concept, leverages a powerful automotive system-on-a-chip (SoC) to manage diverse functions. The integration of AI, including large language model integration, enables proactive user interface features that anticipate driver needs.
  • This deep integration reduces system latency by 40% and simplifies the automotive software stack.
  • The proliferation of AI transforms the display into an active partner, managed by a sophisticated infotainment domain controller and supported by automotive-grade semiconductors and multi-modal user interface designs.

What are the market trends shaping the Automotive Touch Screen Control Systems Industry?

  • The integration of large-scale, curved, and pillar-to-pillar displays is a prominent trend. This shift redefines vehicle interior aesthetics and centralizes controls into a single, fluid digital interface.

  • The market is shifting towards ultra-wide, curved display architecture and pillar-to-pillar display configurations that redefine the automotive digital cockpit. This trend is driven by the desire for an immersive human-machine interface (HMI) and the centralization of vehicle controls. Advancements in haptic feedback technology and OLED automotive display panels create a more intuitive and premium in-vehicle infotainment (IVI) experience.
  • Such advanced HMI development improves user engagement by over 30%. The rise of personalized generative AI assistants and touchless interaction systems is also transforming the automotive user experience (UX), with infotainment hardware modules now supporting complex digital instrument panel technology, reducing menu navigation time by 25%.

What challenges does the Automotive Touch Screen Control Systems Industry face during its growth?

  • A key challenge is aligning with increasing regulatory scrutiny and evolving safety protocols, which are designed to address driver distraction caused by complex touch interfaces.

  • A significant challenge involves aligning with stringent functional safety (ISO 26262) standards and addressing in-vehicle cybersecurity threats. As vehicles become more connected, the risk of breaches targeting the in-vehicle commerce platform or telematics control unit (TCU) grows, with secure-by-design principles becoming mandatory. The complexity of the automotive software stack, often based on automotive grade linux (AGL), requires robust protection.
  • Supply chain volatility for mini-LED backlight components and display driver ICs creates further pressure. Failure to meet new safety protocols can reduce market access by over 15%, while the cost to remedy a cybersecurity flaw is 50% higher than for a mechanical defect. This environment necessitates a focus on flexible cockpit display designs and reliable embedded processing solutions.

Exclusive Technavio Analysis on Customer Landscape

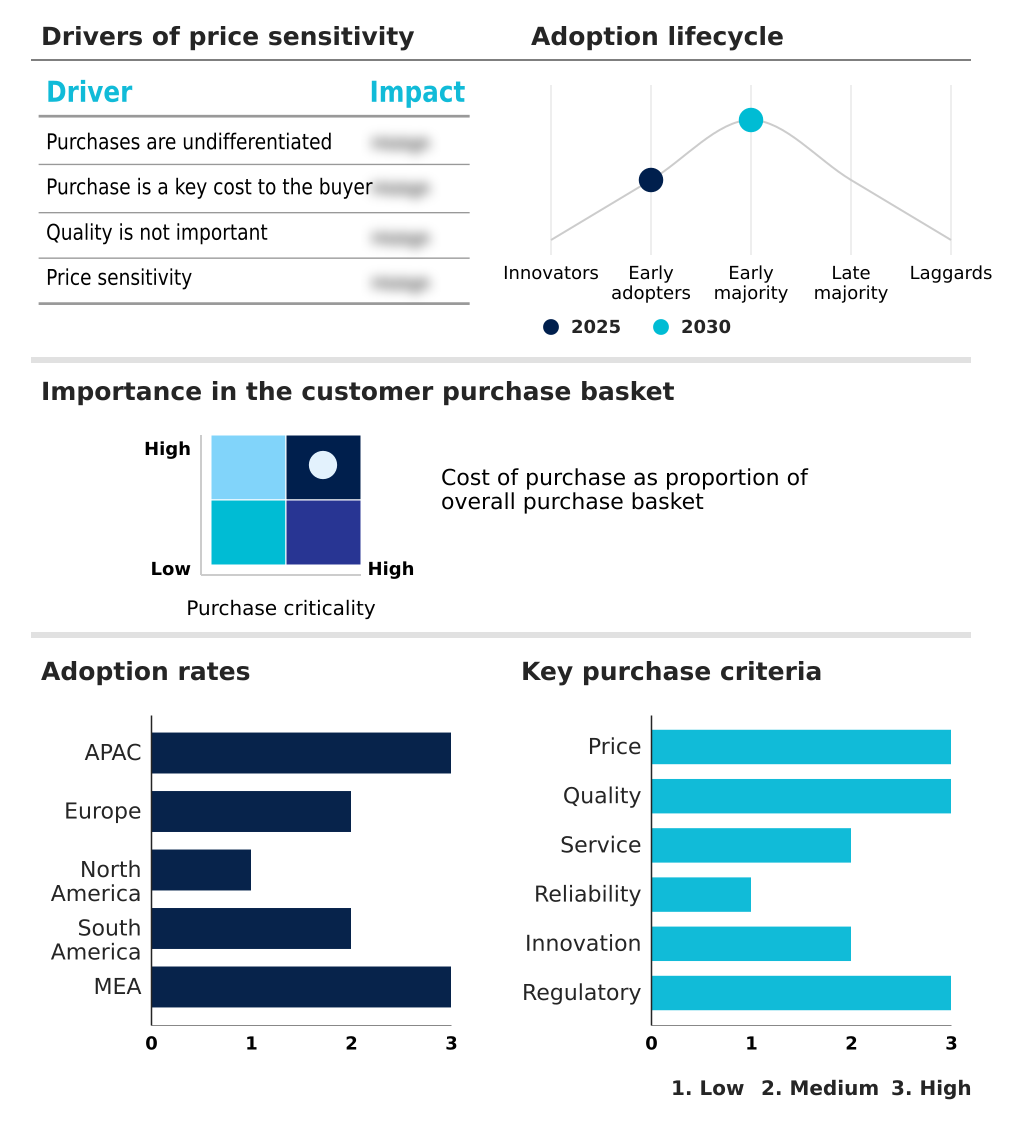
The automotive touch screen control systems market forecasting report includes the adoption lifecycle of the market, covering from the innovator’s stage to the laggard’s stage. It focuses on adoption rates in different regions based on penetration. Furthermore, the automotive touch screen control systems market report also includes key purchase criteria and drivers of price sensitivity to help companies evaluate and develop their market growth analysis strategies.

Customer Landscape of Automotive Touch Screen Control Systems Industry

Competitive Landscape

Companies are implementing various strategies, such as strategic alliances, automotive touch screen control systems market forecast, partnerships, mergers and acquisitions, geographical expansion, and product/service launches, to enhance their presence in the industry.

Analog Devices Inc. - Specializes in single-chip solutions and advanced sensing technologies, delivering intuitive and reliable touch interfaces for diverse in-vehicle applications.

The industry research and growth report includes detailed analyses of the competitive landscape of the market and information about key companies, including:

  • Analog Devices Inc.
  • Continental AG
  • Dawar Technologies
  • Fujitsu Ltd.
  • Infineon Technologies AG
  • Kyocera Corp.
  • Lascar electronics Ltd.
  • LEONHARD KURZ Stiftung and Co.
  • Methode Electronics Inc.
  • Microchip Technology Inc.
  • Orient Display
  • Robert Bosch GmbH
  • Samsung Electronics Co. Ltd.
  • Semtech Corp.
  • STAFL Systems LLC
  • STMicroelectronics NV
  • Synaptics Inc.
  • Texas Instruments Inc.
  • TouchNetix Ltd.
  • US Micro Products Inc.

Qualitative and quantitative analysis of companies has been conducted to help clients understand the wider business environment as well as the strengths and weaknesses of key industry players. Data is qualitatively analyzed to categorize companies as pure play, category-focused, industry-focused, and diversified; it is quantitatively analyzed to categorize companies as dominant, leading, strong, tentative, and weak.

Recent Development and News in Automotive touch screen control systems market

  • In August 2025, LG Electronics announced a strategic initiative to transform the in-cabin environment by forming new content partnerships, aiming to turn vehicles into connected, content-centric spaces with advanced display solutions.
  • In October 2025, HARMAN was recognized as a leading connected car solution provider, highlighting its advancements in integrating telematics, satellite communication, and high-performance computing for in-cabin entertainment.
  • In February 2025, Microchip Technology expanded its maXTouch family by launching new single-chip touch screen controllers engineered to support large, free-form displays up to 34 inches for advanced smart cockpits.
  • In December 2025, Sony Honda Mobility revealed that its AFEELA production model will feature the first in-car integration of PlayStation Remote Play, transforming the vehicle cabin into an interactive digital entertainment ecosystem.

Dive into Technavio’s robust research methodology, blending expert interviews, extensive data synthesis, and validated models for unparalleled Automotive Touch Screen Control Systems Market insights. See full methodology.

Market Scope
Page number 294
Base year 2025
Historic period 2020-2024
Forecast period 2026-2030
Growth momentum & CAGR Accelerate at a CAGR of 5.4%
Market growth 2026-2030 USD 3179.9 million
Market structure Fragmented
YoY growth 2025-2026(%) 5.1%
Key countries Japan, India, China, South Korea, Thailand, Indonesia, Germany, France, UK, Italy, Spain, Czech Republic, US, Mexico, Canada, Brazil, Argentina, Colombia, Saudi Arabia, UAE, South Africa, Turkey and Egypt
Competitive landscape Leading Companies, Market Positioning of Companies, Competitive Strategies, and Industry Risks

Request Free Sample

Research Analyst Overview

  • The market's evolution is defined by the deep integration of advanced hardware and software, creating a highly competitive landscape. The shift towards an automotive digital cockpit is driving demand for pillar-to-pillar display configurations featuring OLED automotive display and mini-LED backlight technology.
  • This requires a sophisticated human-machine interface (HMI) with low latency interface capabilities, managed by a powerful touch screen controller IC and graphics processing unit (GPU). A key boardroom decision centers on investing in a centralized computing platform, essential for the software-defined vehicle (SDV) and enabling features like over-the-air (OTA) updates.
  • This approach, which reduces development cycles by over 25%, integrates the digital instrument cluster, in-vehicle infotainment (IVI), and advanced driver-assistance systems (ADAS) on a single automotive system-on-a-chip (SoC). Innovations in haptic feedback technology, touchless gesture control, and automotive voice recognition are creating a multi-modal interaction environment.
  • Furthermore, the inclusion of a generative AI assistant, leveraging large language model integration, is setting new standards for a proactive user interface.

What are the Key Data Covered in this Automotive Touch Screen Control Systems Market Research and Growth Report?

  • What is the expected growth of the Automotive Touch Screen Control Systems Market between 2026 and 2030?

    • USD 3.18 billion, at a CAGR of 5.4%

  • What segmentation does the market report cover?

    • The report is segmented by Application (Resistive, and Capacitive), Vehicle Type (Passenger cars, and Commercial vehicles), Distribution Channel (OEM, and Aftermarket) and Geography (APAC, Europe, North America, South America, Middle East and Africa)

  • Which regions are analyzed in the report?

    • APAC, Europe, North America, South America and Middle East and Africa

  • What are the key growth drivers and market challenges?

    • Integration of advanced visual technologies and high resolution displays, Regulatory scrutiny and safety protocol alignment

  • Who are the major players in the Automotive Touch Screen Control Systems Market?

    • Analog Devices Inc., Continental AG, Dawar Technologies, Fujitsu Ltd., Infineon Technologies AG, Kyocera Corp., Lascar electronics Ltd., LEONHARD KURZ Stiftung and Co., Methode Electronics Inc., Microchip Technology Inc., Orient Display, Robert Bosch GmbH, Samsung Electronics Co. Ltd., Semtech Corp., STAFL Systems LLC, STMicroelectronics NV, Synaptics Inc., Texas Instruments Inc., TouchNetix Ltd. and US Micro Products Inc.

Market Research Insights

  • The market is shaped by a confluence of technological advancements and evolving consumer expectations for a sophisticated automotive user experience (UX). The consolidation of cockpit electronics into unified platforms improves functional safety (ISO 26262) compliance by 30%. Innovations in vehicle user interface design are critical, as advanced HMI development now incorporates multi-modal user interfaces and touchless interaction systems.
  • The shift towards a smart cockpit architecture, supported by a complex automotive software stack and automotive-grade semiconductors, is paramount. This integration of infotainment hardware modules and automotive display solutions enables features like in-vehicle commerce platforms.
  • Such connected car HMI systems, often running on automotive grade linux (AGL), are protected by robust in-vehicle cybersecurity measures and secure-by-design principles, with graphical user interface (GUI) responsiveness improving by 25%.

We can help! Our analysts can customize this automotive touch screen control systems market research report to meet your requirements.

Get in touch

1. Executive Summary

1.1 Market overview

Executive Summary - Chart on Market Overview
Executive Summary - Data Table on Market Overview
Executive Summary - Chart on Global Market Characteristics
Executive Summary - Chart on Market by Geography
Executive Summary - Chart on Market Segmentation by Application
Executive Summary - Chart on Market Segmentation by Vehicle Type
Executive Summary - Chart on Market Segmentation by Distribution Channel
Executive Summary - Chart on Incremental Growth
Executive Summary - Data Table on Incremental Growth
Executive Summary - Chart on Company Market Positioning

2. Technavio Analysis

2.1 Analysis of price sensitivity, lifecycle, customer purchase basket, adoption rates, and purchase criteria

2.2 Criticality of inputs and Factors of differentiation

Chart on Overview on criticality of inputs and factors of differentiation

2.3 Factors of disruption

Chart on Overview on factors of disruption

2.4 Impact of drivers and challenges

Chart on Impact of drivers and challenges in 2025 and 2030

3. Market Landscape

3.1 Market ecosystem

Chart on Parent Market
Data Table on - Parent Market

3.2 Market characteristics

Chart on Market characteristics analysis

3.3 Value chain analysis

Chart on Value chain analysis

4. Market Sizing

4.1 Market definition

Data Table on Offerings of companies included in the market definition

4.2 Market segment analysis

Market segments

4.3 Market size 2025

4.4 Market outlook: Forecast for 2025-2030

Chart on Global - Market size and forecast 2025-2030 ($ million)
Data Table on Global - Market size and forecast 2025-2030 ($ million)
Chart on Global Market: Year-over-year growth 2025-2030 (%)
Data Table on Global Market: Year-over-year growth 2025-2030 (%)

5. Historic Market Size

5.1 Global Automotive Touch Screen Control Systems Market 2020 - 2024

Historic Market Size - Data Table on Global Automotive Touch Screen Control Systems Market 2020 - 2024 ($ million)

5.2 Application segment analysis 2020 - 2024

Historic Market Size - Application Segment 2020 - 2024 ($ million)

5.3 Vehicle Type segment analysis 2020 - 2024

Historic Market Size - Vehicle Type Segment 2020 - 2024 ($ million)

5.4 Distribution Channel segment analysis 2020 - 2024

Historic Market Size - Distribution Channel Segment 2020 - 2024 ($ million)

5.5 Geography segment analysis 2020 - 2024

Historic Market Size - Geography Segment 2020 - 2024 ($ million)

5.6 Country segment analysis 2020 - 2024

Historic Market Size - Country Segment 2020 - 2024 ($ million)

6. Qualitative Analysis

6.1 Impact of AI on Global Automotive Touch Screen Control Systems Market

7. Five Forces Analysis

7.1 Five forces summary

Five forces analysis - Comparison between 2025 and 2030

7.2 Bargaining power of buyers

Bargaining power of buyers - Impact of key factors 2025 and 2030

7.3 Bargaining power of suppliers

Bargaining power of suppliers - Impact of key factors in 2025 and 2030

7.4 Threat of new entrants

Threat of new entrants - Impact of key factors in 2025 and 2030

7.5 Threat of substitutes

Threat of substitutes - Impact of key factors in 2025 and 2030

7.6 Threat of rivalry

Threat of rivalry - Impact of key factors in 2025 and 2030

7.7 Market condition

Chart on Market condition - Five forces 2025 and 2030

8. Market Segmentation by Application

8.1 Market segments

Chart on Application - Market share 2025-2030 (%)
Data Table on Application - Market share 2025-2030 (%)

8.2 Comparison by Application

Chart on Comparison by Application
Data Table on Comparison by Application

8.3 Resistive - Market size and forecast 2025-2030

Chart on Resistive - Market size and forecast 2025-2030 ($ million)
Data Table on Resistive - Market size and forecast 2025-2030 ($ million)
Chart on Resistive - Year-over-year growth 2025-2030 (%)
Data Table on Resistive - Year-over-year growth 2025-2030 (%)

8.4 Capacitive - Market size and forecast 2025-2030

Chart on Capacitive - Market size and forecast 2025-2030 ($ million)
Data Table on Capacitive - Market size and forecast 2025-2030 ($ million)
Chart on Capacitive - Year-over-year growth 2025-2030 (%)
Data Table on Capacitive - Year-over-year growth 2025-2030 (%)

8.5 Market opportunity by Application

Market opportunity by Application ($ million)
Data Table on Market opportunity by Application ($ million)

9. Market Segmentation by Vehicle Type

9.1 Market segments

Chart on Vehicle Type - Market share 2025-2030 (%)
Data Table on Vehicle Type - Market share 2025-2030 (%)

9.2 Comparison by Vehicle Type

Chart on Comparison by Vehicle Type
Data Table on Comparison by Vehicle Type

9.3 Passenger cars - Market size and forecast 2025-2030

Chart on Passenger cars - Market size and forecast 2025-2030 ($ million)
Data Table on Passenger cars - Market size and forecast 2025-2030 ($ million)
Chart on Passenger cars - Year-over-year growth 2025-2030 (%)
Data Table on Passenger cars - Year-over-year growth 2025-2030 (%)

9.4 Commercial vehicles - Market size and forecast 2025-2030

Chart on Commercial vehicles - Market size and forecast 2025-2030 ($ million)
Data Table on Commercial vehicles - Market size and forecast 2025-2030 ($ million)
Chart on Commercial vehicles - Year-over-year growth 2025-2030 (%)
Data Table on Commercial vehicles - Year-over-year growth 2025-2030 (%)

9.5 Market opportunity by Vehicle Type

Market opportunity by Vehicle Type ($ million)
Data Table on Market opportunity by Vehicle Type ($ million)

10. Market Segmentation by Distribution Channel

10.1 Market segments

Chart on Distribution Channel - Market share 2025-2030 (%)
Data Table on Distribution Channel - Market share 2025-2030 (%)

10.2 Comparison by Distribution Channel

Chart on Comparison by Distribution Channel
Data Table on Comparison by Distribution Channel

10.3 OEM - Market size and forecast 2025-2030

Chart on OEM - Market size and forecast 2025-2030 ($ million)
Data Table on OEM - Market size and forecast 2025-2030 ($ million)
Chart on OEM - Year-over-year growth 2025-2030 (%)
Data Table on OEM - Year-over-year growth 2025-2030 (%)

10.4 Aftermarket - Market size and forecast 2025-2030

Chart on Aftermarket - Market size and forecast 2025-2030 ($ million)
Data Table on Aftermarket - Market size and forecast 2025-2030 ($ million)
Chart on Aftermarket - Year-over-year growth 2025-2030 (%)
Data Table on Aftermarket - Year-over-year growth 2025-2030 (%)

10.5 Market opportunity by Distribution Channel

Market opportunity by Distribution Channel ($ million)
Data Table on Market opportunity by Distribution Channel ($ million)

11. Customer Landscape

11.1 Customer landscape overview

Analysis of price sensitivity, lifecycle, customer purchase basket, adoption rates, and purchase criteria

12. Geographic Landscape

12.1 Geographic segmentation

Chart on Market share by geography 2025-2030 (%)
Data Table on Market share by geography 2025-2030 (%)

12.2 Geographic comparison

Chart on Geographic comparison
Data Table on Geographic comparison

12.3 APAC - Market size and forecast 2025-2030

Chart on APAC - Market size and forecast 2025-2030 ($ million)
Data Table on APAC - Market size and forecast 2025-2030 ($ million)
Chart on APAC - Year-over-year growth 2025-2030 (%)
Data Table on APAC - Year-over-year growth 2025-2030 (%)
Chart on Regional Comparison - APAC
Data Table on Regional Comparison - APAC

12.3.1 Japan - Market size and forecast 2025-2030

Chart on Japan - Market size and forecast 2025-2030 ($ million)
Data Table on Japan - Market size and forecast 2025-2030 ($ million)
Chart on Japan - Year-over-year growth 2025-2030 (%)
Data Table on Japan - Year-over-year growth 2025-2030 (%)

12.3.2 India - Market size and forecast 2025-2030

Chart on India - Market size and forecast 2025-2030 ($ million)
Data Table on India - Market size and forecast 2025-2030 ($ million)
Chart on India - Year-over-year growth 2025-2030 (%)
Data Table on India - Year-over-year growth 2025-2030 (%)

12.3.3 China - Market size and forecast 2025-2030

Chart on China - Market size and forecast 2025-2030 ($ million)
Data Table on China - Market size and forecast 2025-2030 ($ million)
Chart on China - Year-over-year growth 2025-2030 (%)
Data Table on China - Year-over-year growth 2025-2030 (%)

12.3.4 South Korea - Market size and forecast 2025-2030

Chart on South Korea - Market size and forecast 2025-2030 ($ million)
Data Table on South Korea - Market size and forecast 2025-2030 ($ million)
Chart on South Korea - Year-over-year growth 2025-2030 (%)
Data Table on South Korea - Year-over-year growth 2025-2030 (%)

12.3.5 Thailand - Market size and forecast 2025-2030

Chart on Thailand - Market size and forecast 2025-2030 ($ million)
Data Table on Thailand - Market size and forecast 2025-2030 ($ million)
Chart on Thailand - Year-over-year growth 2025-2030 (%)
Data Table on Thailand - Year-over-year growth 2025-2030 (%)

12.3.6 Indonesia - Market size and forecast 2025-2030

Chart on Indonesia - Market size and forecast 2025-2030 ($ million)
Data Table on Indonesia - Market size and forecast 2025-2030 ($ million)
Chart on Indonesia - Year-over-year growth 2025-2030 (%)
Data Table on Indonesia - Year-over-year growth 2025-2030 (%)

12.4 Europe - Market size and forecast 2025-2030

Chart on Europe - Market size and forecast 2025-2030 ($ million)
Data Table on Europe - Market size and forecast 2025-2030 ($ million)
Chart on Europe - Year-over-year growth 2025-2030 (%)
Data Table on Europe - Year-over-year growth 2025-2030 (%)
Chart on Regional Comparison - Europe
Data Table on Regional Comparison - Europe

12.4.1 Germany - Market size and forecast 2025-2030

Chart on Germany - Market size and forecast 2025-2030 ($ million)
Data Table on Germany - Market size and forecast 2025-2030 ($ million)
Chart on Germany - Year-over-year growth 2025-2030 (%)
Data Table on Germany - Year-over-year growth 2025-2030 (%)

12.4.2 France - Market size and forecast 2025-2030

Chart on France - Market size and forecast 2025-2030 ($ million)
Data Table on France - Market size and forecast 2025-2030 ($ million)
Chart on France - Year-over-year growth 2025-2030 (%)
Data Table on France - Year-over-year growth 2025-2030 (%)

12.4.3 UK - Market size and forecast 2025-2030

Chart on UK - Market size and forecast 2025-2030 ($ million)
Data Table on UK - Market size and forecast 2025-2030 ($ million)
Chart on UK - Year-over-year growth 2025-2030 (%)
Data Table on UK - Year-over-year growth 2025-2030 (%)

12.4.4 Italy - Market size and forecast 2025-2030

Chart on Italy - Market size and forecast 2025-2030 ($ million)
Data Table on Italy - Market size and forecast 2025-2030 ($ million)
Chart on Italy - Year-over-year growth 2025-2030 (%)
Data Table on Italy - Year-over-year growth 2025-2030 (%)

12.4.5 Spain - Market size and forecast 2025-2030

Chart on Spain - Market size and forecast 2025-2030 ($ million)
Data Table on Spain - Market size and forecast 2025-2030 ($ million)
Chart on Spain - Year-over-year growth 2025-2030 (%)
Data Table on Spain - Year-over-year growth 2025-2030 (%)

12.4.6 Czech Republic - Market size and forecast 2025-2030

Chart on Czech Republic - Market size and forecast 2025-2030 ($ million)
Data Table on Czech Republic - Market size and forecast 2025-2030 ($ million)
Chart on Czech Republic - Year-over-year growth 2025-2030 (%)
Data Table on Czech Republic - Year-over-year growth 2025-2030 (%)

12.5 North America - Market size and forecast 2025-2030

Chart on North America - Market size and forecast 2025-2030 ($ million)
Data Table on North America - Market size and forecast 2025-2030 ($ million)
Chart on North America - Year-over-year growth 2025-2030 (%)
Data Table on North America - Year-over-year growth 2025-2030 (%)
Chart on Regional Comparison - North America
Data Table on Regional Comparison - North America

12.5.1 US - Market size and forecast 2025-2030

Chart on US - Market size and forecast 2025-2030 ($ million)
Data Table on US - Market size and forecast 2025-2030 ($ million)
Chart on US - Year-over-year growth 2025-2030 (%)
Data Table on US - Year-over-year growth 2025-2030 (%)

12.5.2 Mexico - Market size and forecast 2025-2030

Chart on Mexico - Market size and forecast 2025-2030 ($ million)
Data Table on Mexico - Market size and forecast 2025-2030 ($ million)
Chart on Mexico - Year-over-year growth 2025-2030 (%)
Data Table on Mexico - Year-over-year growth 2025-2030 (%)

12.5.3 Canada - Market size and forecast 2025-2030

Chart on Canada - Market size and forecast 2025-2030 ($ million)
Data Table on Canada - Market size and forecast 2025-2030 ($ million)
Chart on Canada - Year-over-year growth 2025-2030 (%)
Data Table on Canada - Year-over-year growth 2025-2030 (%)

12.6 South America - Market size and forecast 2025-2030

Chart on South America - Market size and forecast 2025-2030 ($ million)
Data Table on South America - Market size and forecast 2025-2030 ($ million)
Chart on South America - Year-over-year growth 2025-2030 (%)
Data Table on South America - Year-over-year growth 2025-2030 (%)
Chart on Regional Comparison - South America
Data Table on Regional Comparison - South America

12.6.1 Brazil - Market size and forecast 2025-2030

Chart on Brazil - Market size and forecast 2025-2030 ($ million)
Data Table on Brazil - Market size and forecast 2025-2030 ($ million)
Chart on Brazil - Year-over-year growth 2025-2030 (%)
Data Table on Brazil - Year-over-year growth 2025-2030 (%)

12.6.2 Argentina - Market size and forecast 2025-2030

Chart on Argentina - Market size and forecast 2025-2030 ($ million)
Data Table on Argentina - Market size and forecast 2025-2030 ($ million)
Chart on Argentina - Year-over-year growth 2025-2030 (%)
Data Table on Argentina - Year-over-year growth 2025-2030 (%)

12.6.3 Colombia - Market size and forecast 2025-2030

Chart on Colombia - Market size and forecast 2025-2030 ($ million)
Data Table on Colombia - Market size and forecast 2025-2030 ($ million)
Chart on Colombia - Year-over-year growth 2025-2030 (%)
Data Table on Colombia - Year-over-year growth 2025-2030 (%)

12.7 Middle East and Africa - Market size and forecast 2025-2030

Chart on Middle East and Africa - Market size and forecast 2025-2030 ($ million)
Data Table on Middle East and Africa - Market size and forecast 2025-2030 ($ million)
Chart on Middle East and Africa - Year-over-year growth 2025-2030 (%)
Data Table on Middle East and Africa - Year-over-year growth 2025-2030 (%)
Chart on Regional Comparison - Middle East and Africa
Data Table on Regional Comparison - Middle East and Africa

12.7.1 Saudi Arabia - Market size and forecast 2025-2030

Chart on Saudi Arabia - Market size and forecast 2025-2030 ($ million)
Data Table on Saudi Arabia - Market size and forecast 2025-2030 ($ million)
Chart on Saudi Arabia - Year-over-year growth 2025-2030 (%)
Data Table on Saudi Arabia - Year-over-year growth 2025-2030 (%)

12.7.2 UAE - Market size and forecast 2025-2030

Chart on UAE - Market size and forecast 2025-2030 ($ million)
Data Table on UAE - Market size and forecast 2025-2030 ($ million)
Chart on UAE - Year-over-year growth 2025-2030 (%)
Data Table on UAE - Year-over-year growth 2025-2030 (%)

12.7.3 South Africa - Market size and forecast 2025-2030

Chart on South Africa - Market size and forecast 2025-2030 ($ million)
Data Table on South Africa - Market size and forecast 2025-2030 ($ million)
Chart on South Africa - Year-over-year growth 2025-2030 (%)
Data Table on South Africa - Year-over-year growth 2025-2030 (%)

12.7.4 Turkey - Market size and forecast 2025-2030

Chart on Turkey - Market size and forecast 2025-2030 ($ million)
Data Table on Turkey - Market size and forecast 2025-2030 ($ million)
Chart on Turkey - Year-over-year growth 2025-2030 (%)
Data Table on Turkey - Year-over-year growth 2025-2030 (%)

12.7.5 Egypt - Market size and forecast 2025-2030

Chart on Egypt - Market size and forecast 2025-2030 ($ million)
Data Table on Egypt - Market size and forecast 2025-2030 ($ million)
Chart on Egypt - Year-over-year growth 2025-2030 (%)
Data Table on Egypt - Year-over-year growth 2025-2030 (%)

12.8 Market opportunity by geography

Market opportunity by geography ($ million)
Data Tables on Market opportunity by geography ($ million)

13. Drivers, Challenges, and Opportunity

13.1 Market drivers

Integration of advanced visual technologies and high resolution displays
Proliferation of AI and agentic human machine interfaces
Consolidation of cockpit electronics through centralized computing platforms

13.2 Market challenges

Regulatory scrutiny and safety protocol alignment
Semiconductor supply imbalances and cost volatility
Cybersecurity vulnerabilities and data privacy risks

13.3 Impact of drivers and challenges

Impact of drivers and challenges in 2025 and 2030

13.4 Market opportunities

Integration of large scale curved and pillar to pillar displays
Rise of personalized in cabin assistants
Advancements in haptic feedback and touchless gesture controls

14. Competitive Landscape

14.1 Overview

14.2

Overview on criticality of inputs and factors of differentiation

14.3 Landscape disruption

Overview on factors of disruption

14.4 Industry risks

Impact of key risks on business

15. Competitive Analysis

15.1 Companies profiled

Companies covered

15.2 Company ranking index

15.3 Market positioning of companies

Matrix on companies position and classification

15.4 Analog Devices Inc.

Analog Devices Inc. - Overview
Analog Devices Inc. - Business segments
Analog Devices Inc. - Key news
Analog Devices Inc. - Key offerings
Analog Devices Inc. - Segment focus
SWOT

15.5 Continental AG

Continental AG - Overview
Continental AG - Business segments
Continental AG - Key news
Continental AG - Key offerings
Continental AG - Segment focus
SWOT

15.6 Dawar Technologies

Dawar Technologies - Overview
Dawar Technologies - Product / Service
Dawar Technologies - Key offerings
SWOT

15.7 Fujitsu Ltd.

Fujitsu Ltd. - Overview
Fujitsu Ltd. - Business segments
Fujitsu Ltd. - Key news
Fujitsu Ltd. - Key offerings
Fujitsu Ltd. - Segment focus
SWOT

15.8 Infineon Technologies AG

Infineon Technologies AG - Overview
Infineon Technologies AG - Business segments
Infineon Technologies AG - Key news
Infineon Technologies AG - Key offerings
Infineon Technologies AG - Segment focus
SWOT

15.9 Kyocera Corp.

Kyocera Corp. - Overview
Kyocera Corp. - Business segments
Kyocera Corp. - Key news
Kyocera Corp. - Key offerings
Kyocera Corp. - Segment focus
SWOT

15.10 Lascar electronics Ltd.

Lascar electronics Ltd. - Overview
Lascar electronics Ltd. - Product / Service
Lascar electronics Ltd. - Key offerings
SWOT

15.11 Microchip Technology Inc.

Microchip Technology Inc. - Overview
Microchip Technology Inc. - Business segments
Microchip Technology Inc. - Key news
Microchip Technology Inc. - Key offerings
Microchip Technology Inc. - Segment focus
SWOT

15.12 Orient Display

Orient Display - Overview
Orient Display - Product / Service
Orient Display - Key offerings
SWOT

15.13 Robert Bosch GmbH

Robert Bosch GmbH - Overview
Robert Bosch GmbH - Product / Service
Robert Bosch GmbH - Key news
Robert Bosch GmbH - Key offerings
SWOT

15.14 Samsung Electronics Co. Ltd.

Samsung Electronics Co. Ltd. - Overview
Samsung Electronics Co. Ltd. - Business segments
Samsung Electronics Co. Ltd. - Key news
Samsung Electronics Co. Ltd. - Key offerings
Samsung Electronics Co. Ltd. - Segment focus
SWOT

15.15 Semtech Corp.

Semtech Corp. - Overview
Semtech Corp. - Business segments
Semtech Corp. - Key news
Semtech Corp. - Key offerings
Semtech Corp. - Segment focus
SWOT

15.16 STMicroelectronics NV

STMicroelectronics NV - Overview
STMicroelectronics NV - Business segments
STMicroelectronics NV - Key news
STMicroelectronics NV - Key offerings
STMicroelectronics NV - Segment focus
SWOT

15.17 Texas Instruments Inc.

Texas Instruments Inc. - Overview
Texas Instruments Inc. - Business segments
Texas Instruments Inc. - Key offerings
Texas Instruments Inc. - Segment focus
SWOT

15.18 US Micro Products Inc.

US Micro Products Inc. - Overview
US Micro Products Inc. - Product / Service
US Micro Products Inc. - Key offerings
SWOT

16. Appendix

16.1 Scope of the report

Market definition
Objectives
Notes and caveats

16.2 Inclusions and exclusions checklist

Inclusions checklist
Exclusions checklist

16.3 Currency conversion rates for US$

16.4 Research methodology

16.5 Data procurement

Information sources

16.6 Data validation

16.7 Validation techniques employed for market sizing

16.8 Data synthesis

16.9 360 degree market analysis

16.10 List of abbreviations

Research Methodology

Technavio presents a detailed picture of the market by way of study, synthesis, and summation of data from multiple sources. The analysts have presented the various facets of the market with a particular focus on identifying the key industry influencers. The data thus presented is comprehensive, reliable, and the result of extensive research, both primary and secondary.

INFORMATION SOURCES

Primary sources

  • Manufacturers and suppliers
  • Channel partners
  • Industry experts
  • Strategic decision makers

Secondary sources

  • Industry journals and periodicals
  • Government data
  • Financial reports of key industry players
  • Historical data
  • Press releases

DATA ANALYSIS

Data Synthesis

  • Collation of data
  • Estimation of key figures
  • Analysis of derived insights

Data Validation

  • Triangulation with data models
  • Reference against proprietary databases
  • Corroboration with industry experts

REPORT WRITING

Qualitative

  • Market drivers
  • Market challenges
  • Market trends
  • Five forces analysis

Quantitative

  • Market size and forecast
  • Market segmentation
  • Geographical insights
  • Competitive landscape

Interested in this report?

Get your sample now to see our research methodology and insights!

Download Now

Frequently Asked Questions

Automotive Touch Screen Control Systems market growth will increase by USD 3179.9 million during 2026-2030.

The Automotive Touch Screen Control Systems market is expected to grow at a CAGR of 5.4% during 2026-2030.

Automotive Touch Screen Control Systems market is segmented by Application (Resistive, Capacitive) Vehicle type (Passenger cars, Commercial vehicles) Distribution channel (OEM, Aftermarket)

Analog Devices Inc., Continental AG, Dawar Technologies, Fujitsu Ltd., Infineon Technologies AG, Kyocera Corp., Lascar electronics Ltd., LEONHARD KURZ Stiftung and Co., Methode Electronics Inc., Microchip Technology Inc., Orient Display, Robert Bosch GmbH, Samsung Electronics Co. Ltd., Semtech Corp., STAFL Systems LLC, STMicroelectronics NV, Synaptics Inc., Texas Instruments Inc., TouchNetix Ltd., US Micro Products Inc. are a few of the key vendors in the Automotive Touch Screen Control Systems market.

APAC will register the highest growth rate of 51.2% among the other regions. Therefore, the Automotive Touch Screen Control Systems market in APAC is expected to garner significant business opportunities for the vendors during the forecast period.

Japan, India, China, South Korea, Thailand, Indonesia, Germany, France, UK, Italy, Spain, Czech Republic, US, Mexico, Canada, Brazil, Argentina, Colombia, Saudi Arabia, UAE, South Africa, Turkey, Egypt

  • Integration of advanced visual technologies and high resolution displays is the driving factor this market.

The Automotive Touch Screen Control Systems market vendors should focus on grabbing business opportunities from the Application segment as it accounted for the largest market share in the base year.
RIA - Research AI Assistant
Ask RIA