
Autonomous Delivery Robots Market Size and Growth Forecast 2026-2030
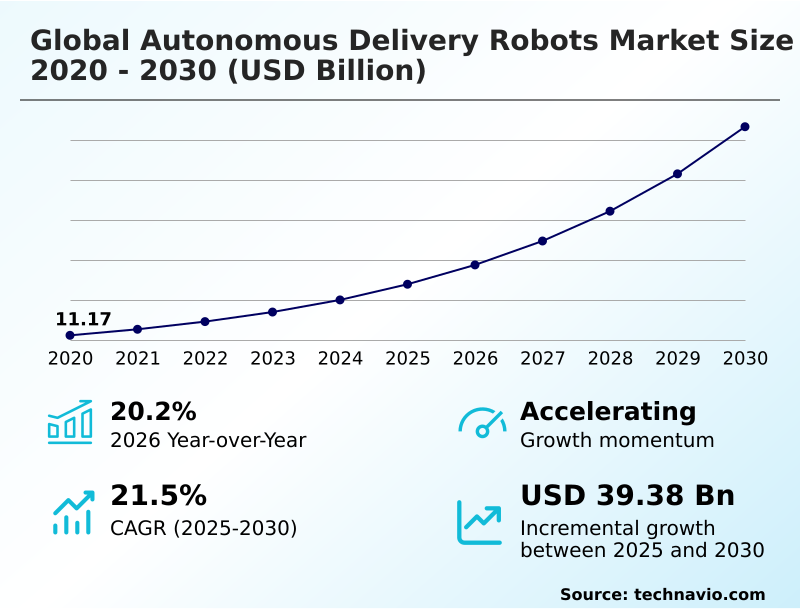
The Autonomous Delivery Robots Market size was valued at USD 23.94 billion in 2025 growing at a CAGR of 21.5% during the forecast period 2026-2030.
North America accounts for 43.6% of incremental growth during the forecast period. The Semi-autonomous segment by Type was valued at USD 15.87 billion in 2024, while the Hardware segment holds the largest revenue share by Component.
The market is projected to grow by USD 52.15 billion from 2020 to 2030, with USD 39.38 billion of the growth expected during the forecast period of 2025 to 2030.
Get Key Insights on Market Forecast (PDF) Request Free Sample
Autonomous Delivery Robots Market Overview
The autonomous delivery robots market is characterized by rapid industrialization, where advanced physical AI and high-performance edge computing are converging to redefine last-mile logistics. North America is set to contribute over 43% of the market's incremental growth, driven by an urgent need to automate delivery networks in response to labor shortages and rising operational costs. Within this landscape, a key focus is on achieving all-weather autonomous operation to ensure service reliability. For instance, a large grocery chain deploying a fleet of delivery robots in a suburban area with variable weather patterns must ensure its robotic delivery platform can navigate safely during rain or light snow, a challenge addressed through advanced sensor fusion and predictive maintenance for robots. This push is underpinned by a year-over-year growth of over 20%, reflecting aggressive investment in technologies that support high-density, contactless fulfillment and adhere to emerging delivery robot safety standards.
Drivers, Trends, and Challenges in the Autonomous Delivery Robots Market
Strategic decisions in the autonomous delivery robots market are increasingly influenced by the total cost of ownership, where the roi of autonomous delivery fleets is weighed against persistent operational challenges.
The adoption of robotics-as-a-service (RaaS) models allows businesses to bypass the high initial CAPEX of fleet acquisition, a model that can reduce upfront investment by over 70% compared to direct purchase, easing budget pressures for mid-sized retailers. This financial structure is critical for scaling autonomous delivery for grocery retail.
However, achieving reliable all-weather autonomous robot navigation remains a significant technical hurdle, impacting service uptime and cost per delivery autonomous robots. In a practical scenario, a large hospital campus deploying a fleet for internal logistics must ensure its units comply with safety standards like IEC 60601 for medical electrical equipment if they transport sensitive materials.
The successful deployment of level 4 autonomy in urban delivery hinges not just on technology but also on navigating fragmented municipal regulations, which dictate operational parameters and ultimately determine the commercial viability of these advanced logistics networks.
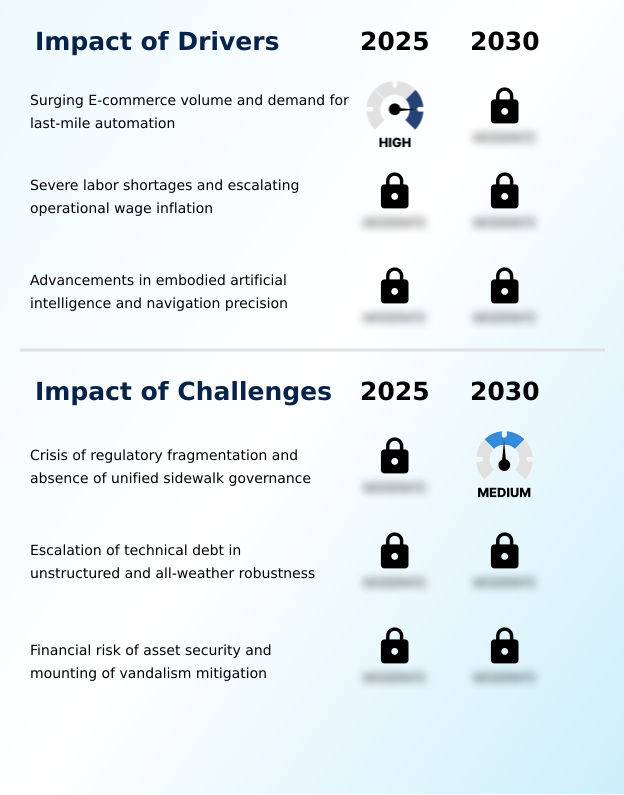
Primary Growth Driver: Surging e-commerce volume and the corresponding demand for last-mile automation are key drivers propelling the market.
The primary drivers for the autonomous delivery robots market are the relentless expansion of e-commerce and persistent labor shortages in the logistics sector.
The need for cost-effective last-mile automation has become critical, leading to a 48% increase in global service robot sales as businesses seek to mitigate wage inflation and vacant positions.
This has accelerated the adoption of ai-powered logistics, where autonomous mobile robots (AMR) handle repetitive, short-distance transit tasks.
Advancements in embodied artificial intelligence and navigation precision, including improved ai for pedestrian intent prediction, are making these systems viable for complex urban environments.
The move toward durable, all-weather autonomous operation platforms capable of functioning in diverse climates further solidifies their role as a vital engine for market expansion.
Emerging Market Trend: The advancement toward Level 4 autonomy in high-density urban environments is a defining market trend. This involves robotic units operating without human intervention within predefined geofenced corridors.
Key trends reshaping the autonomous delivery robots market include the institutionalization of Level 4 autonomy and the proliferation of robotics-as-a-service (RaaS) models. The shift toward self-sufficient sidewalk navigation stacks, which leverage advanced sensor fusion and high-definition 3D mapping, is reducing reliance on human-in-the-loop systems and their associated operational costs.
This move is enabling commercial-scale autonomy, with some providers forecasting nearly tenfold revenue increases driven by multi-year service agreements with major partners. This trend is supported by investments in 5G-Advanced networks, which provide the low-latency connectivity required for real-time robotic fleet orchestration and management of secure payload compartments, ultimately transforming last-mile delivery into a high-efficiency digital utility.
Key Industry Challenge: A significant challenge affecting industry growth is the crisis of regulatory fragmentation and the absence of unified sidewalk governance across different jurisdictions.
Significant challenges constrain the autonomous delivery robots market, led by regulatory fragmentation and technical debt in achieving robust all-weather performance. The lack of standardized municipal regulations creates a patchwork of operating permits, increasing risk for manufacturers and impeding the economies of scale needed for profitability. This is a critical issue for last-mile delivery challenges.
Concurrently, the technical difficulty of ensuring reliable sensor performance in adverse conditions like heavy rain or snow often necessitates a reversion to costly human teleoperation. This is exacerbated by the high cost of military-grade sensor suites and the requirement for ubiquitous, high-reliability network coverage to support high-definition 3D mapping and constant cloud synchronization.
Without breakthroughs in low-cost sensor fusion and vandalism mitigation, scaling beyond fair-weather, suburban applications remains a protracted struggle.
Explore Full Market Dynamics Analysis Request Free Sample
Autonomous Delivery Robots Market Segmentation
The autonomous delivery robots industry research report provides comprehensive data including region-wise segment analysis, with forecasts and analysis for the period 2026-2030, as well as historical data from 2020-2024 for the following segments.
Type Segment Analysis
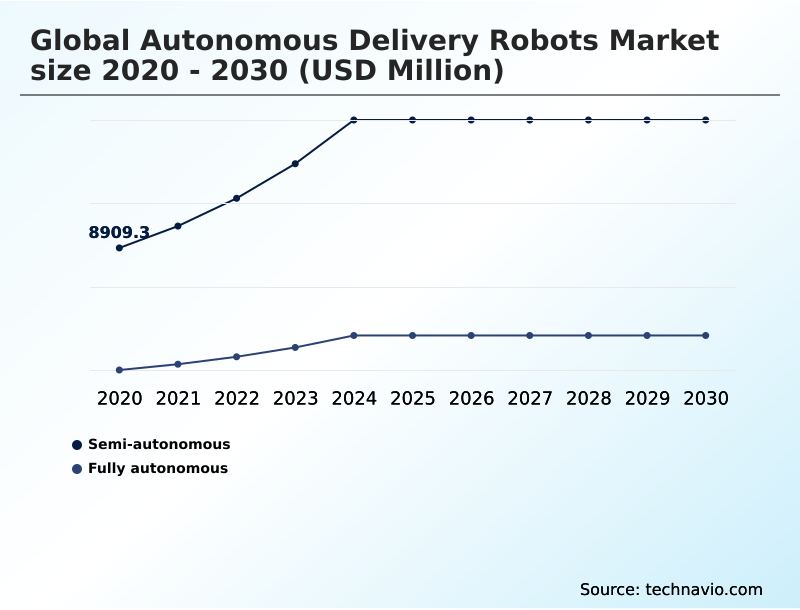
The semi-autonomous segment is estimated to witness significant growth during the forecast period.
The semi-autonomous segment of the autonomous delivery robots market is defined by a human-in-the-loop operational model, where remote teleoperation supplements onboard navigation systems.
This approach mitigates liability risks associated with complex urban edge cases, ensuring compliance with safety standards for personal care robots like ISO 13482.
Operators leverage this model for high-frequency contactless fulfillment in dense city centers, where unpredictable variables necessitate human oversight. While these systems utilize real-time path planning for routine navigation, the reliance on remote monitoring centers addresses challenges in unstructured environments.
This segment, representing a significant portion of the market, serves as a critical bridge to full autonomy, allowing firms to build operational experience and collect vital data for training more advanced embodied artificial intelligence.
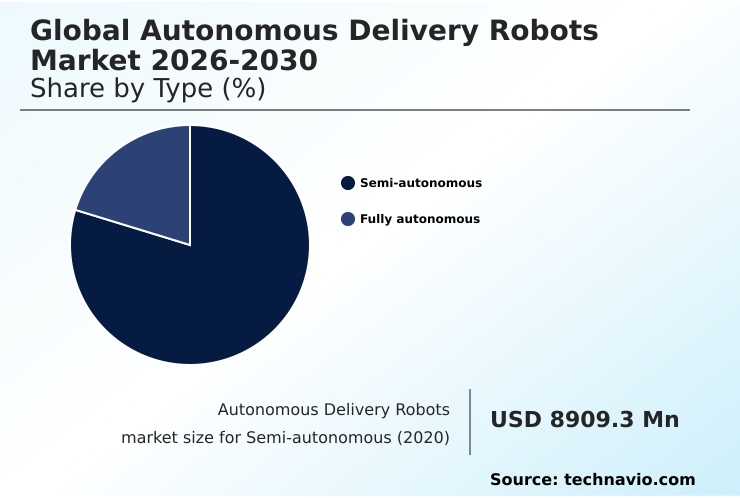
The Semi-autonomous segment was valued at USD 15.87 billion in 2024 and showed a gradual increase during the forecast period.
Autonomous Delivery Robots Market by Region: North America Leads with 43.6% Growth Share
North America is estimated to contribute 43.6% to the growth of the global market during the forecast period.
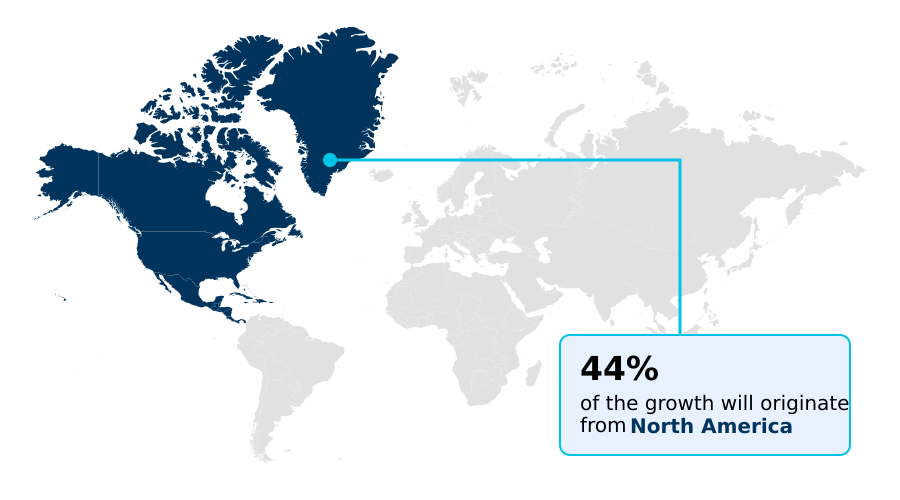
The geographic landscape of the autonomous delivery robots market is led by North America, which accounts for approximately 43.6% of the incremental growth, fueled by a mature venture capital ecosystem and early regulatory adoption for sidewalk navigation.
The region's focus is on deploying robotic delivery platform solutions for grocery and food delivery.
Meanwhile, the APAC region is projected to exhibit the fastest expansion, with a CAGR of 23.3%, driven by massive government-led smart city investments and 5G network rollouts in China and South Korea.
These initiatives provide the low-latency remote monitoring infrastructure necessary for large-scale deployments.
In Europe, growth is steady, with a strong emphasis on developing zero-emission delivery fleets to comply with stringent environmental regulations like the European Green Deal, pushing demand for sustainable technologies within urban logistics.
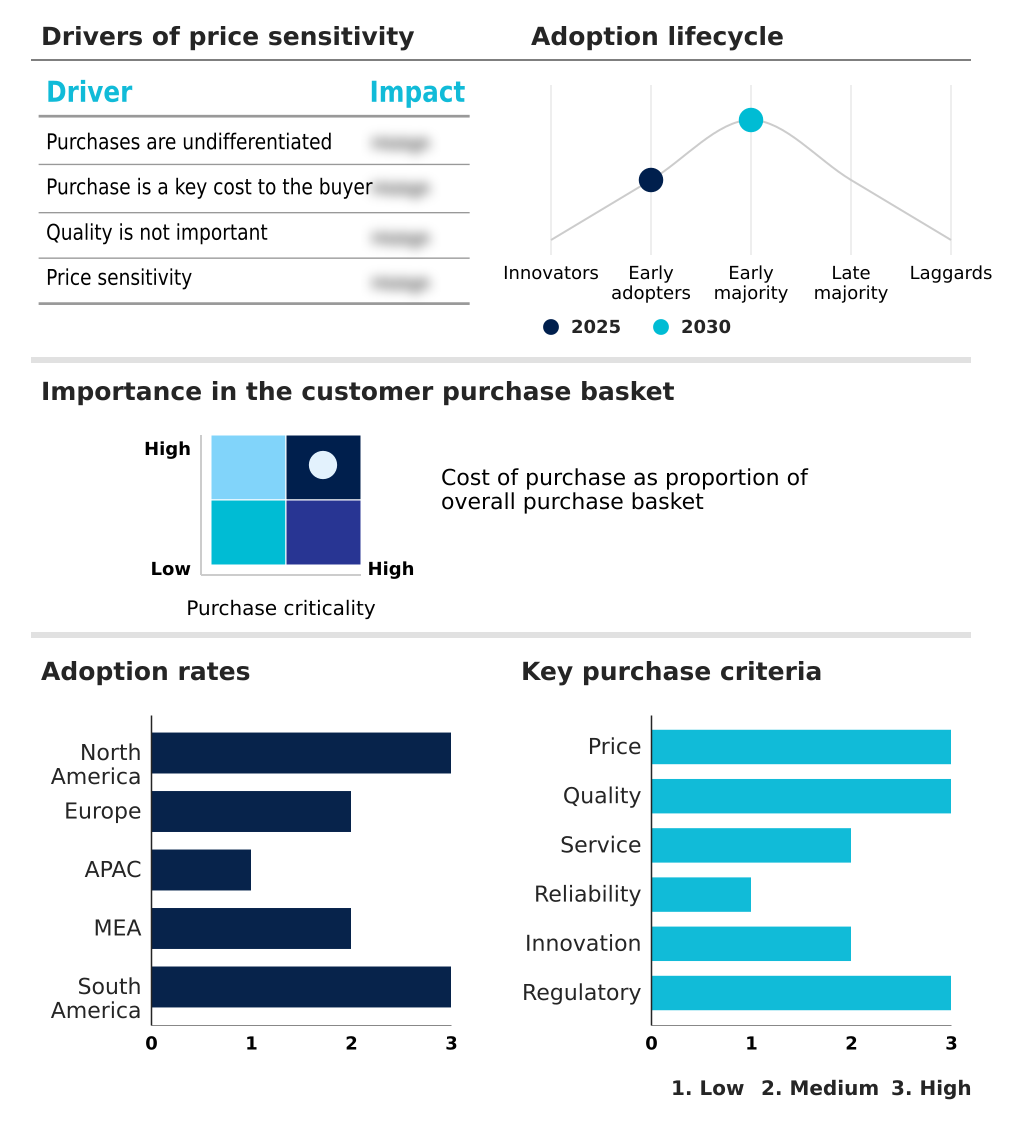
Customer Landscape Analysis for the Autonomous Delivery Robots Market
The autonomous delivery robots market forecasting report includes the adoption lifecycle of the market, covering from the innovator’s stage to the laggard’s stage. It focuses on adoption rates in different regions based on penetration. Furthermore, the autonomous delivery robots market report also includes key purchase criteria and drivers of price sensitivity to help companies evaluate and develop their market growth analysis strategies.
Competitive Landscape of the Autonomous Delivery Robots Market
Companies are implementing various strategies, such as strategic alliances, partnerships, mergers and acquisitions, geographical expansion, and product/service launches, to enhance their presence in the autonomous delivery robots market industry.
Avride - Specializing in sidewalk delivery robots, the company provides autonomous platforms designed to optimize last-mile logistics and automated package delivery.
The industry research and growth report includes detailed analyses of the competitive landscape of the market and information about key companies, including:
- Avride
- Bear Robotics Inc.
- Beijing Yunji Technology Co.
- Cartken Inc.
- Cyan Robotics Inc.
- Exwayz
- Keenon Robotics Co. Ltd.
- Neolix Technologies Co. Ltd.
- Ninerrobot Pte. Ltd.
- Ottonomy Inc.
- Peyk
- Postmates Inc.
- Pudu Technology Co. Ltd.
- Relay Robotics Inc.
- Robomart Inc.
- Robot.com
- Serve Robotics Inc.
- Starship Technologies Inc.
Qualitative and quantitative analysis of companies has been conducted to help clients understand the wider business environment as well as the strengths and weaknesses of key industry players. Data is qualitatively analyzed to categorize companies as pure play, category-focused, industry-focused, and diversified; it is quantitatively analyzed to categorize companies as dominant, leading, strong, tentative, and weak.
Recent Developments in the Autonomous Delivery Robots Market
- In December 2025, Serve Robotics announced the expansion of its fully autonomous delivery fleet to two thousand units across the United States, utilizing upgraded artificial intelligence stacks to eliminate the need for constant remote monitoring.
- In November 2025, Starship Technologies and Uber Technologies announced a global collaboration to roll out autonomous sidewalk robot delivery across multiple markets, integrating their platforms to expand service reach.
- In March 2026, Serve Robotics Inc. announced a partnership with White Castle to launch autonomous delivery services via the Uber Eats platform, expanding its commercial footprint in the quick-service restaurant sector.
- In February 2026, Ottonomy Inc. unveiled a comprehensive autonomous delivery ecosystem at the India AI Impact Summit, featuring its Level 4 Ottobots integrated with smart storage infrastructure for healthcare and industrial applications.
Research Analyst Overview: Autonomous Delivery Robots Market
The autonomous delivery robots market is rapidly maturing from pilot programs to large-scale commercial deployments, driven by advancements in embodied artificial intelligence and a market-wide year-over-year growth of over 20%. The industry's pivot toward level 4 autonomy, where robotic units operate within geofenced urban corridors without human intervention, is forcing a strategic re-evaluation of risk at the boardroom level.
Executives must now address complex liability questions tied to real-time path planning and sidewalk navigation in unpredictable public spaces. This requires developing robust risk management frameworks compliant with standards like ISO 31000. The integration of sophisticated computer vision and multi-modal sensor fusion is critical, but so is the underlying fleet management software that orchestrates these assets.
As such, vendor selection criteria are shifting from mere hardware payload capacity to the sophistication of the entire robotic delivery platform, including its teleoperation and edge computing capabilities.
Dive into Technavio’s robust research methodology, blending expert interviews, extensive data synthesis, and validated models for unparalleled Autonomous Delivery Robots Market insights. See full methodology.
| Market Scope | |
|---|---|
| Page number | 284 |
| Base year | 2025 |
| Historic period | 2020-2024 |
| Forecast period | 2026-2030 |
| Growth momentum & CAGR | Accelerate at a CAGR of 21.5% |
| Market growth 2026-2030 | USD 39379.3 million |
| Market structure | Fragmented |
| YoY growth 2025-2026(%) | 20.2% |
| Key countries | US, Canada, Mexico, Germany, UK, France, Italy, Spain, The Netherlands, China, Japan, India, South Korea, Australia, Indonesia, Saudi Arabia, UAE, South Africa, Israel, Turkey, Brazil, Argentina and Chile |
| Competitive landscape | Leading Companies, Market Positioning of Companies, Competitive Strategies, and Industry Risks |
Autonomous Delivery Robots Market: Key Questions Answered in This Report
-
What is the expected growth of the Autonomous Delivery Robots Market between 2026 and 2030?
-
The Autonomous Delivery Robots Market is expected to grow by USD 39.38 billion during 2026-2030, registering a CAGR of 21.5%. Year-over-year growth in 2026 is estimated at 20.2%%. This acceleration is shaped by surging e-commerce volume and demand for last-mile automation, which is intensifying demand across multiple end-use verticals covered in the report.
-
-
What segmentation does the market report cover?
-
The report is segmented by Type (Semi-autonomous, and Fully autonomous), Component (Hardware, and Software), Capacity (Light, Medium, and Heavy) and Geography (North America, Europe, APAC, Middle East and Africa, South America). Among these, the Semi-autonomous segment is estimated to witness significant growth during the forecast period, driven by rising adoption across key application areas. Each segment includes detailed qualitative and quantitative analysis, along with historical data from 2020-2024 and forecasts through 2030 with year-over-year growth rates.
-
-
Which regions are analyzed in the report?
-
The report covers North America, Europe, APAC, Middle East and Africa and South America. North America is estimated to contribute 43.6% to market growth during the forecast period. Country-level analysis includes US, Canada, Mexico, Germany, UK, France, Italy, Spain, The Netherlands, China, Japan, India, South Korea, Australia, Indonesia, Saudi Arabia, UAE, South Africa, Israel, Turkey, Brazil, Argentina and Chile, with dedicated market size tables and year-over-year growth for each.
-
-
What are the key growth drivers and market challenges?
-
The primary driver is surging e-commerce volume and demand for last-mile automation, which is accelerating investment and industry demand. The main challenge is crisis of regulatory fragmentation and absence of unified sidewalk governance, creating operational barriers for key market participants. The report quantifies the impact of each driver and challenge across 2026 and 2030 with comparative analysis.
-
-
Who are the major players in the Autonomous Delivery Robots Market?
-
Key vendors include Avride, Bear Robotics Inc., Beijing Yunji Technology Co., Cartken Inc., Cyan Robotics Inc., Exwayz, Keenon Robotics Co. Ltd., Neolix Technologies Co. Ltd., Ninerrobot Pte. Ltd., Ottonomy Inc., Peyk, Postmates Inc., Pudu Technology Co. Ltd., Relay Robotics Inc., Robomart Inc., Robot.com, Serve Robotics Inc. and Starship Technologies Inc.. The report provides qualitative and quantitative analysis categorizing companies as dominant, leading, strong, tentative, and weak based on their market positioning. Company profiles include business segment analysis, SWOT assessment, key offerings, and recent strategic developments.
-
Autonomous Delivery Robots Market Research Insights
Market dynamics are increasingly shaped by the push for operational efficiency and scalability, with the APAC region showing the highest growth potential at a 23.3% CAGR, compared to North America's 21.8%. This growth is driven by the adoption of subscription-based robotics, allowing businesses to leverage ai-powered logistics without significant upfront capital.
As enterprises evaluate new systems, compliance with emerging frameworks like the EU's AI Act, which governs the safety of autonomous systems, becomes a critical procurement factor.
A logistics provider, for example, would assess a vendor's robotic fleet orchestration capabilities not just on delivery speed but also on its adherence to data privacy and safety protocols, influencing the total cost of ownership. The development of sustainable propulsion systems further aligns these technologies with corporate ESG mandates and zero-emission urban zones.
We can help! Our analysts can customize this autonomous delivery robots market research report to meet your requirements.
 RIA -
RIA - 
