Aviation Borescope Market Analysis, Size, and Forecast 2026-2030: North America (US, Canada, and Mexico), Europe (UK, Germany, and France), APAC (China, Japan, and India), Middle East and Africa (Saudi Arabia, UAE, and South Africa), South America (Brazil, Argentina, and Colombia), and Rest of World (ROW)

Aviation Borescope Market Analysis, Size, and Forecast 2026-2030:
North America (US, Canada, and Mexico), Europe (UK, Germany, and France), APAC (China, Japan, and India), Middle East and Africa (Saudi Arabia, UAE, and South Africa), South America (Brazil, Argentina, and Colombia), and Rest of World (ROW)

Published: Jan 2026 297 Pages SKU: IRTNTR81234

Market Overview at a Glance

$698.2 Mn
Market Opportunity
8%
CAGR 2025 - 2030
32.5%
APAC Growth
$
Video borescopes segment 2024

Aviation Borescope Market Size 2026-2030

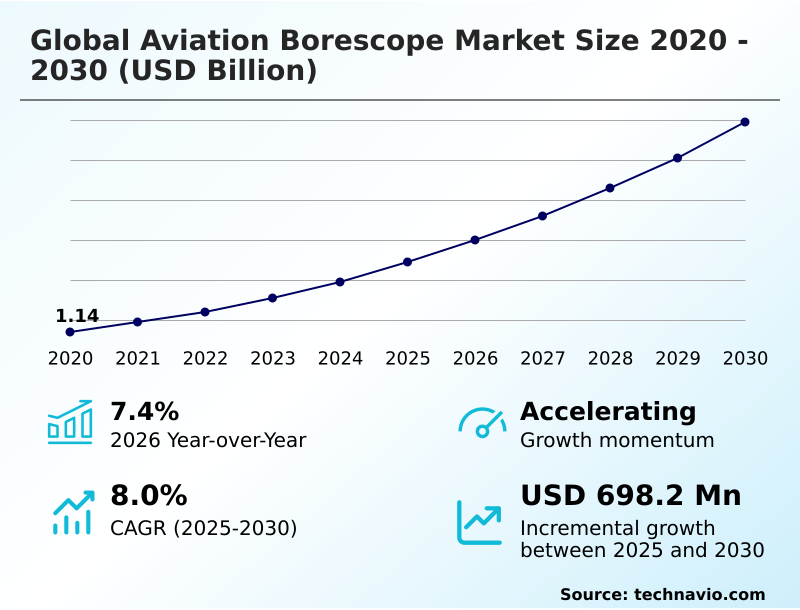
The aviation borescope market size is valued to increase by USD 698.2 million, at a CAGR of 8% from 2025 to 2030. Rapid expansion of global commercial aircraft fleets and increasing air traffic volumes will drive the aviation borescope market.

Major Market Trends & Insights

  • APAC dominated the market and accounted for a 32.5% growth during the forecast period.
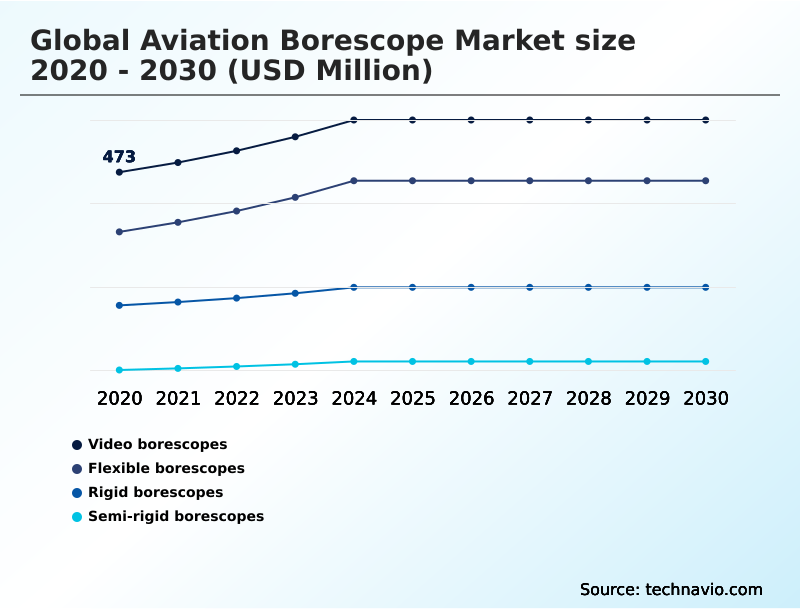
  • By Type - Video borescopes segment was valued at in 2024
  • By Application - Aircraft engine inspection segment accounted for the largest market revenue share in 2024

Market Size & Forecast

  • Market Opportunities: USD 1.05 billion
  • Market Future Opportunities: USD 698.2 million
  • CAGR from 2025 to 2030 : 8%

Market Summary

  • The aviation borescope market is driven by the non-negotiable requirements for safety and operational efficiency in the aviation industry. The imperative to inspect internal engine components and airframe structures without costly disassembly fuels demand for advanced remote visual inspection tools.
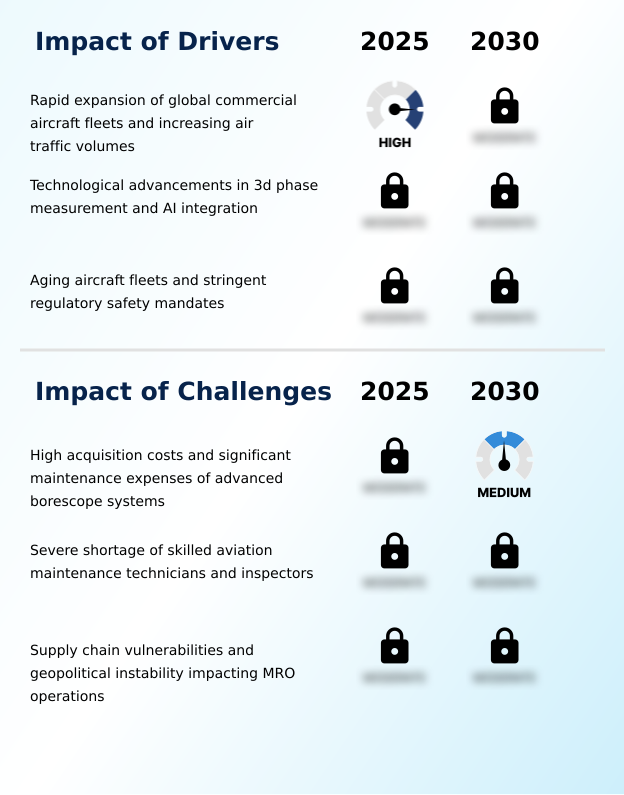
  • Key drivers include the expansion of the global aircraft fleet, the extended service life of aging aircraft, and increasingly stringent regulatory mandates for non-destructive testing. A significant trend is the integration of digital technologies, transforming inspection from a manual process into a data-centric one.
  • For instance, a maintenance, repair, and overhaul (MRO) provider can now use a connected device to stream live video of potential turbine blade damage to a remote engineering team, receive an immediate airworthiness decision, and digitally log the evidence, all within minutes. This capability drastically reduces aircraft downtime.
  • However, the market faces challenges from the high capital cost of advanced systems and a persistent shortage of skilled NDT technicians capable of interpreting the complex data these tools provide.

What will be the Size of the Aviation Borescope Market during the forecast period?

Get Key Insights on Market Forecast (PDF) Request Free Sample

How is the Aviation Borescope Market Segmented?

The aviation borescope industry research report provides comprehensive data (region-wise segment analysis), with forecasts and estimates in "USD million" for the period 2026-2030, as well as historical data from 2020-2024 for the following segments.

  • Type
    • Video borescopes
    • Flexible borescopes
    • Rigid borescopes
    • Semi-rigid borescopes
  • Application
    • Aircraft engine inspection
    • Airframe inspection
    • Component inspection
    • FOD inspection
  • End-user
    • Commercial airplanes
    • Military aviation airplanes
    • Business aviation airplanes
  • Geography
    • North America
      • US
      • Canada
      • Mexico
    • Europe
      • UK
      • Germany
      • France
    • APAC
      • China
      • Japan
      • India
    • Middle East and Africa
      • Saudi Arabia
      • UAE
      • South Africa
    • South America
      • Brazil
      • Argentina
      • Colombia
    • Rest of World (ROW)

By Type Insights

The video borescopes segment is estimated to witness significant growth during the forecast period.

The market is segmented by offerings where the high-resolution video probe segment is dominant. These instruments, leveraging advanced cmos imaging sensor technology and articulating insertion probe mechanics, are fundamental to modern MRO.

Their ability to perform quantitative defect assessment is displacing legacy methods like flexible fiber-optic imaging. The integration of automated defect recognition, which improves detection of issues like turbine blade thermal coating wear, allows for more consistent data-driven serviceability decisions.

Use of these tools has been shown to reduce certain inspection times by up to 30%, a critical factor in enhancing operational efficiency.

While rigid relay lens system and semi-rigid malleable probe designs serve niche applications like composite material inspection, video systems are central to geared turbofan (gtf) engine diagnostics.

Request Free Sample

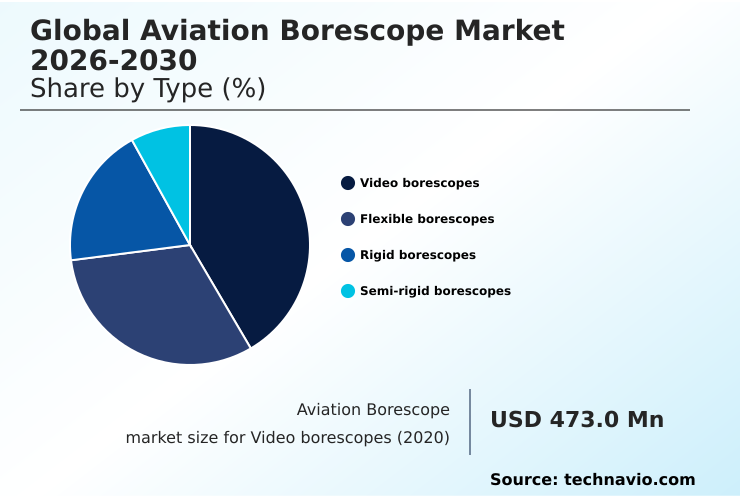
The Video borescopes segment was valued at in 2024 and showed a gradual increase during the forecast period.

Request Free Sample

Regional Analysis

APAC is estimated to contribute 32.5% to the growth of the global market during the forecast period.Technavio’s analysts have elaborately explained the regional trends and drivers that shape the market during the forecast period.

See How Aviation Borescope Market Demand is Rising in APAC Request Free Sample

The geographic landscape reveals a significant shift, with APAC poised to contribute over 32% of the market's incremental growth, driven by massive fleet expansions.

While North America remains a major market due to its large MRO infrastructure and focus on advanced remote visual inspection (rvi), its growth rate is surpassed by APAC's nearly 10% expansion.

This growth is fueled by the need for comprehensive engine health monitoring, including hot section component analysis and combustion chamber imaging, to manage new and aging aircraft.

Demand for tools to assess airframe structural integrity and perform auxiliary power unit (apu) review is rising globally, but the concentration of new deliveries in Asia is accelerating technology adoption in that region.

Market Dynamics

Our researchers analyzed the data with 2025 as the base year, along with the key drivers, trends, and challenges. A holistic analysis of drivers will help companies refine their marketing strategies to gain a competitive advantage.

  • Strategic adoption of advanced visual inspection technologies is becoming a key differentiator in aviation MRO. The use of virtual reality training for visual inspection helps bridge the skills gap, preparing technicians for complex tasks like the in-situ repair of compressor blades and the visual inspection of aging fleet structures.
  • On the hardware front, specialized high temperature probes for hot sections are critical for reducing engine cooling times before an examination. For next-generation aircraft, the visual inspection of composite airframes and the internal inspection of 3d printed parts demand new capabilities. RVI solutions for military aircraft sustainment require robust, secure systems.
  • Software and connectivity are equally important, with ai software for visual inspection analysis enabling more accurate findings. The integration of wi-fi enabled probes for remote collaboration facilitates faster decision-making. Moreover, visual data integration with maintenance logs supports rvi for airworthiness certification checks and builds comprehensive datasets for predictive models.
  • The specific challenges of new engines are also being addressed, with dedicated methods for visual inspection for gtf engine pmc issues. For specific tasks, specialized equipment like small diameter probes for apu inspection, uv inspection for hydraulic system leaks, and tools for fod retrieval from engine core are essential.
  • Firms that fully integrate these technologies report up to a 40% improvement in diagnostic accuracy compared to legacy methods.

What are the key market drivers leading to the rise in the adoption of Aviation Borescope Industry?

  • The rapid expansion of global commercial aircraft fleets, coupled with increasing air traffic volumes, serves as a primary driver for market growth.

  • Market expansion is driven by the need for stringent non-destructive testing (ndt) to ensure airworthiness directive compliance and reduce aircraft on ground (aog) reduction scenarios.
  • The growth in high-bypass turbofan inspection requirements for new and aging fleets is a significant factor. Advanced technologies like 3d phase measurement and stereo measurement technology offer precise data, facilitating engine teardown avoidance.
  • These tools are crucial for on-wing engine examination, enabling the accurate detection of issues such as compressor blade crack detection.
  • The high volume of maintenance repair overhaul (mro) activities, spurred by increased flight cycles, has solidified the demand for efficient inspection solutions, with adoption of advanced systems showing a 20% increase in certain MROs.

What are the market trends shaping the Aviation Borescope Industry?

  • The integration of artificial intelligence and assisted defect recognition in aviation inspection is a transformative market trend. This development is enhancing the accuracy and efficiency of critical maintenance procedures.

  • The market is evolving toward a fully integrated digital MRO ecosystem, driven by predictive maintenance analytics. A primary trend is the adoption of ai-assisted defect recognition to standardize inspections and enable data-driven serviceability decisions, which can reduce turnaround time (tat) optimization by over 25%. The shift to a paperless maintenance workflow is enabled by real-time remote collaboration features.
  • Advanced robotic snake-arm inspection and continuum manipulator guidance systems are being trialed for complex tasks. Furthermore, the demand for small-diameter articulating probe technology is rising. These trends converge in the digital twin data protocol, which is transforming asset management by enhancing inspection accuracy by more than 15%.

What challenges does the Aviation Borescope Industry face during its growth?

  • The high acquisition costs and significant maintenance expenses associated with advanced borescope systems present a key challenge to widespread market adoption.

  • High acquisition costs for systems with advanced features like in-situ blend repair tooling or automated defect recognition (adr) remain a barrier, with nearly 30% of smaller MROs postponing upgrades. The integrity of equipment, from the distal tip micro-camera to the tungsten braided tubing, necessitates costly repairs.
  • A shortage of technicians skilled in complex tasks like fatigue crack propagation monitoring and corrosion mapping and analysis further constrains the market. Supply chain disruptions affect the availability of specialized components for working channel instrumentation and tools for ultraviolet (uv) leak detection.
  • Ensuring positive tool control verification and managing the quality control of additive manufacturing components add further layers of operational complexity.

Exclusive Technavio Analysis on Customer Landscape

The aviation borescope market forecasting report includes the adoption lifecycle of the market, covering from the innovator’s stage to the laggard’s stage. It focuses on adoption rates in different regions based on penetration. Furthermore, the aviation borescope market report also includes key purchase criteria and drivers of price sensitivity to help companies evaluate and develop their market growth analysis strategies.

Customer Landscape of Aviation Borescope Industry

Competitive Landscape

Companies are implementing various strategies, such as strategic alliances, aviation borescope market forecast, partnerships, mergers and acquisitions, geographical expansion, and product/service launches, to enhance their presence in the industry.

CAE Inc. - Virtual reality maintenance simulations provide risk-free training for complex engine diagnostics, enhancing technician proficiency on critical non-destructive testing procedures.

The industry research and growth report includes detailed analyses of the competitive landscape of the market and information about key companies, including:

  • CAE Inc.
  • EFER Endoscopy
  • Evident Corp.
  • General Electric Co.
  • Gradient Lens Corporation
  • Guantai Automation Tech. Co. Ltd.
  • JME Technologies Inc.
  • Lenox Instrument Co.
  • Machida Endoscope Co. Ltd.
  • Medical Intubation Tech. Corp.
  • Oasis Scientific
  • PCE Holding GmbH
  • Richard Wolf GmbH
  • SPI Borescopes LLC
  • USA Borescopes LLC
  • ViewTech Borescopes
  • viZaar industrial imaging AG
  • Yateks

Qualitative and quantitative analysis of companies has been conducted to help clients understand the wider business environment as well as the strengths and weaknesses of key industry players. Data is qualitatively analyzed to categorize companies as pure play, category-focused, industry-focused, and diversified; it is quantitatively analyzed to categorize companies as dominant, leading, strong, tentative, and weak.

Recent Development and News in Aviation borescope market

  • In October, 2024, Rolls-Royce released updates on its IntelligentEngine program, detailing successful field trials of a collaborative snake robot for on-wing combustion chamber inspections of a Trent XWB engine.
  • In January, 2025, Evident Scientific released a case study demonstrating that its AI-enabled industrial videoscopes reduced engine inspection times by approximately 30% during routine A-checks for a major North American airline.
  • In March, 2025, a consortium of European maintenance providers announced the standardization of a Digital Twin protocol, mandating that all visual inspection data for leased aircraft be uploaded to a shared cloud environment.
  • In March, 2025, CAE Inc. continued its integration of advanced simulation training modules for non-destructive testing (NDT), aiming to improve inspector proficiency with complex remote visual inspection tools.

Dive into Technavio’s robust research methodology, blending expert interviews, extensive data synthesis, and validated models for unparalleled Aviation Borescope Market insights. See full methodology.

Market Scope
Page number 297
Base year 2025
Historic period 2020-2024
Forecast period 2026-2030
Growth momentum & CAGR Accelerate at a CAGR of 8%
Market growth 2026-2030 USD 698.2 million
Market structure Fragmented
YoY growth 2025-2026(%) 7.4%
Key countries US, Canada, Mexico, UK, Germany, France, Italy, Spain, The Netherlands, China, Japan, India, South Korea, Australia, Indonesia, Saudi Arabia, UAE, South Africa, Israel, Turkey, Brazil, Argentina and Colombia
Competitive landscape Leading Companies, Market Positioning of Companies, Competitive Strategies, and Industry Risks

Request Free Sample

Research Analyst Overview

  • The market's evolution is defined by the integration of sophisticated hardware and software designed to meet stringent safety and efficiency demands. Boardroom decisions on capital expenditure are increasingly influenced by the need to adopt tools featuring 3d phase measurement and ai-assisted defect recognition, which transition inspections from qualitative checks to quantitative analysis.
  • A high-resolution video probe with a durable tungsten braided insertion tube and an advanced cmos imaging sensor is now the industry standard. The capability for remote visual inspection (rvi) is enhanced by articulating insertion probe designs and small-diameter articulating probe variants for complex pathways.
  • Technologies like stereo measurement technology and automated defect recognition (adr) are pivotal for on-wing engine examination, particularly for hot section component analysis and combustion chamber imaging. These systems are crucial for identifying turbine blade thermal coating wear and compressor blade crack detection. Deployment of these tools has demonstrated up to a 30% reduction in inspection-related downtime.
  • The market also includes specialized systems for non-destructive testing (ndt) such as those for in-situ blend repair tooling and foreign object debris (fod) retrieval.

What are the Key Data Covered in this Aviation Borescope Market Research and Growth Report?

  • What is the expected growth of the Aviation Borescope Market between 2026 and 2030?

    • USD 698.2 million, at a CAGR of 8%

  • What segmentation does the market report cover?

    • The report is segmented by Type ( Video borescopes, Flexible borescopes, Rigid borescopes, and Semi-rigid borescopes), Application (Aircraft engine inspection, Airframe inspection, Component inspection, and FOD inspection), End-user (Commercial airplanes, Military aviation airplanes, and Business aviation airplanes) and Geography (North America, Europe, APAC, Middle East and Africa, South America)

  • Which regions are analyzed in the report?

    • North America, Europe, APAC, Middle East and Africa and South America

  • What are the key growth drivers and market challenges?

    • Rapid expansion of global commercial aircraft fleets and increasing air traffic volumes, High acquisition costs and significant maintenance expenses of advanced borescope systems

  • Who are the major players in the Aviation Borescope Market?

    • CAE Inc., EFER Endoscopy, Evident Corp., General Electric Co., Gradient Lens Corporation, Guantai Automation Tech. Co. Ltd., JME Technologies Inc., Lenox Instrument Co., Machida Endoscope Co. Ltd., Medical Intubation Tech. Corp., Oasis Scientific, PCE Holding GmbH, Richard Wolf GmbH, SPI Borescopes LLC, USA Borescopes LLC, ViewTech Borescopes, viZaar industrial imaging AG and Yateks

Market Research Insights

  • The market is shaped by the convergence of technologies aimed at enhancing engine health monitoring and airframe structural integrity. The use of predictive maintenance analytics is crucial for aircraft on ground (aog) reduction and turnaround time (tat) optimization. Within the digital MRO ecosystem, real-time remote collaboration and a paperless maintenance workflow enable data-driven serviceability decisions with over 95% accuracy.
  • This is vital for airworthiness directive compliance and engine teardown avoidance. Effective maintenance repair overhaul (mro) depends on quantitative defect assessment for tasks like fatigue crack propagation monitoring and corrosion mapping and analysis. This extends to auxiliary power unit (apu) review, landing gear strut examination, and composite material inspection.
  • The focus on asset condition traceability and positive tool control verification is critical, especially for electrical wiring interconnect system (ewis) checks and additive manufacturing quality control, where adoption rates have increased by 20%.

We can help! Our analysts can customize this aviation borescope market research report to meet your requirements.

Get in touch

1. Executive Summary

1.1 Market overview

Executive Summary - Chart on Market Overview
Executive Summary - Data Table on Market Overview
Executive Summary - Chart on Global Market Characteristics
Executive Summary - Chart on Market by Geography
Executive Summary - Chart on Market Segmentation by Type
Executive Summary - Chart on Market Segmentation by Application
Executive Summary - Chart on Market Segmentation by End-user
Executive Summary - Chart on Incremental Growth
Executive Summary - Data Table on Incremental Growth
Executive Summary - Chart on Company Market Positioning

2. Technavio Analysis

2.1 Analysis of price sensitivity, lifecycle, customer purchase basket, adoption rates, and purchase criteria

2.2 Criticality of inputs and Factors of differentiation

Chart on Overview on criticality of inputs and factors of differentiation

2.3 Factors of disruption

Chart on Overview on factors of disruption

2.4 Impact of drivers and challenges

Chart on Impact of drivers and challenges in 2025 and 2030

3. Market Landscape

3.1 Market ecosystem

Chart on Parent Market
Data Table on - Parent Market

3.2 Market characteristics

Chart on Market characteristics analysis

3.3 Value chain analysis

Chart on Value chain analysis

4. Market Sizing

4.1 Market definition

Data Table on Offerings of companies included in the market definition

4.2 Market segment analysis

Market segments

4.3 Market size 2025

4.4 Market outlook: Forecast for 2025-2030

Chart on Global - Market size and forecast 2025-2030 ($ million)
Data Table on Global - Market size and forecast 2025-2030 ($ million)
Chart on Global Market: Year-over-year growth 2025-2030 (%)
Data Table on Global Market: Year-over-year growth 2025-2030 (%)

5. Historic Market Size

5.1 Global Aviation Borescope Market 2020 - 2024

Historic Market Size - Data Table on Global Aviation Borescope Market 2020 - 2024 ($ million)

5.2 Type segment analysis 2020 - 2024

Historic Market Size - Type Segment 2020 - 2024 ($ million)

5.3 Application segment analysis 2020 - 2024

Historic Market Size - Application Segment 2020 - 2024 ($ million)

5.4 End-user segment analysis 2020 - 2024

Historic Market Size - End-user Segment 2020 - 2024 ($ million)

5.5 Geography segment analysis 2020 - 2024

Historic Market Size - Geography Segment 2020 - 2024 ($ million)

5.6 Country segment analysis 2020 - 2024

Historic Market Size - Country Segment 2020 - 2024 ($ million)

6. Qualitative Analysis

6.1 Impact of AI on the Global Aviation Borescope Market

7. Five Forces Analysis

7.1 Five forces summary

Five forces analysis - Comparison between 2025 and 2030

7.2 Bargaining power of buyers

Bargaining power of buyers - Impact of key factors 2025 and 2030

7.3 Bargaining power of suppliers

Bargaining power of suppliers - Impact of key factors in 2025 and 2030

7.4 Threat of new entrants

Threat of new entrants - Impact of key factors in 2025 and 2030

7.5 Threat of substitutes

Threat of substitutes - Impact of key factors in 2025 and 2030

7.6 Threat of rivalry

Threat of rivalry - Impact of key factors in 2025 and 2030

7.7 Market condition

Chart on Market condition - Five forces 2025 and 2030

8. Market Segmentation by Type

8.1 Market segments

Chart on Type - Market share 2025-2030 (%)
Data Table on Type - Market share 2025-2030 (%)

8.2 Comparison by Type

Chart on Comparison by Type
Data Table on Comparison by Type

8.3 Video borescopes - Market size and forecast 2025-2030

Chart on Video borescopes - Market size and forecast 2025-2030 ($ million)
Data Table on Video borescopes - Market size and forecast 2025-2030 ($ million)
Chart on Video borescopes - Year-over-year growth 2025-2030 (%)
Data Table on Video borescopes - Year-over-year growth 2025-2030 (%)

8.4 Flexible borescopes - Market size and forecast 2025-2030

Chart on Flexible borescopes - Market size and forecast 2025-2030 ($ million)
Data Table on Flexible borescopes - Market size and forecast 2025-2030 ($ million)
Chart on Flexible borescopes - Year-over-year growth 2025-2030 (%)
Data Table on Flexible borescopes - Year-over-year growth 2025-2030 (%)

8.5 Rigid borescopes - Market size and forecast 2025-2030

Chart on Rigid borescopes - Market size and forecast 2025-2030 ($ million)
Data Table on Rigid borescopes - Market size and forecast 2025-2030 ($ million)
Chart on Rigid borescopes - Year-over-year growth 2025-2030 (%)
Data Table on Rigid borescopes - Year-over-year growth 2025-2030 (%)

8.6 Semi-rigid borescopes - Market size and forecast 2025-2030

Chart on Semi-rigid borescopes - Market size and forecast 2025-2030 ($ million)
Data Table on Semi-rigid borescopes - Market size and forecast 2025-2030 ($ million)
Chart on Semi-rigid borescopes - Year-over-year growth 2025-2030 (%)
Data Table on Semi-rigid borescopes - Year-over-year growth 2025-2030 (%)

8.7 Market opportunity by Type

Market opportunity by Type ($ million)
Data Table on Market opportunity by Type ($ million)

9. Market Segmentation by Application

9.1 Market segments

Chart on Application - Market share 2025-2030 (%)
Data Table on Application - Market share 2025-2030 (%)

9.2 Comparison by Application

Chart on Comparison by Application
Data Table on Comparison by Application

9.3 Aircraft engine inspection - Market size and forecast 2025-2030

Chart on Aircraft engine inspection - Market size and forecast 2025-2030 ($ million)
Data Table on Aircraft engine inspection - Market size and forecast 2025-2030 ($ million)
Chart on Aircraft engine inspection - Year-over-year growth 2025-2030 (%)
Data Table on Aircraft engine inspection - Year-over-year growth 2025-2030 (%)

9.4 Airframe inspection - Market size and forecast 2025-2030

Chart on Airframe inspection - Market size and forecast 2025-2030 ($ million)
Data Table on Airframe inspection - Market size and forecast 2025-2030 ($ million)
Chart on Airframe inspection - Year-over-year growth 2025-2030 (%)
Data Table on Airframe inspection - Year-over-year growth 2025-2030 (%)

9.5 Component inspection - Market size and forecast 2025-2030

Chart on Component inspection - Market size and forecast 2025-2030 ($ million)
Data Table on Component inspection - Market size and forecast 2025-2030 ($ million)
Chart on Component inspection - Year-over-year growth 2025-2030 (%)
Data Table on Component inspection - Year-over-year growth 2025-2030 (%)

9.6 FOD inspection - Market size and forecast 2025-2030

Chart on FOD inspection - Market size and forecast 2025-2030 ($ million)
Data Table on FOD inspection - Market size and forecast 2025-2030 ($ million)
Chart on FOD inspection - Year-over-year growth 2025-2030 (%)
Data Table on FOD inspection - Year-over-year growth 2025-2030 (%)

9.7 Market opportunity by Application

Market opportunity by Application ($ million)
Data Table on Market opportunity by Application ($ million)

10. Market Segmentation by End-user

10.1 Market segments

Chart on End-user - Market share 2025-2030 (%)
Data Table on End-user - Market share 2025-2030 (%)

10.2 Comparison by End-user

Chart on Comparison by End-user
Data Table on Comparison by End-user

10.3 Commercial airplanes - Market size and forecast 2025-2030

Chart on Commercial airplanes - Market size and forecast 2025-2030 ($ million)
Data Table on Commercial airplanes - Market size and forecast 2025-2030 ($ million)
Chart on Commercial airplanes - Year-over-year growth 2025-2030 (%)
Data Table on Commercial airplanes - Year-over-year growth 2025-2030 (%)

10.4 Military aviation airplanes - Market size and forecast 2025-2030

Chart on Military aviation airplanes - Market size and forecast 2025-2030 ($ million)
Data Table on Military aviation airplanes - Market size and forecast 2025-2030 ($ million)
Chart on Military aviation airplanes - Year-over-year growth 2025-2030 (%)
Data Table on Military aviation airplanes - Year-over-year growth 2025-2030 (%)

10.5 Business aviation airplanes - Market size and forecast 2025-2030

Chart on Business aviation airplanes - Market size and forecast 2025-2030 ($ million)
Data Table on Business aviation airplanes - Market size and forecast 2025-2030 ($ million)
Chart on Business aviation airplanes - Year-over-year growth 2025-2030 (%)
Data Table on Business aviation airplanes - Year-over-year growth 2025-2030 (%)

10.6 Market opportunity by End-user

Market opportunity by End-user ($ million)
Data Table on Market opportunity by End-user ($ million)

11. Customer Landscape

11.1 Customer landscape overview

Analysis of price sensitivity, lifecycle, customer purchase basket, adoption rates, and purchase criteria

12. Geographic Landscape

12.1 Geographic segmentation

Chart on Market share by geography 2025-2030 (%)
Data Table on Market share by geography 2025-2030 (%)

12.2 Geographic comparison

Chart on Geographic comparison
Data Table on Geographic comparison

12.3 North America - Market size and forecast 2025-2030

Chart on North America - Market size and forecast 2025-2030 ($ million)
Data Table on North America - Market size and forecast 2025-2030 ($ million)
Chart on North America - Year-over-year growth 2025-2030 (%)
Data Table on North America - Year-over-year growth 2025-2030 (%)
Chart on Regional Comparison - North America
Data Table on Regional Comparison - North America

12.3.1 US - Market size and forecast 2025-2030

Chart on US - Market size and forecast 2025-2030 ($ million)
Data Table on US - Market size and forecast 2025-2030 ($ million)
Chart on US - Year-over-year growth 2025-2030 (%)
Data Table on US - Year-over-year growth 2025-2030 (%)

12.3.2 Canada - Market size and forecast 2025-2030

Chart on Canada - Market size and forecast 2025-2030 ($ million)
Data Table on Canada - Market size and forecast 2025-2030 ($ million)
Chart on Canada - Year-over-year growth 2025-2030 (%)
Data Table on Canada - Year-over-year growth 2025-2030 (%)

12.3.3 Mexico - Market size and forecast 2025-2030

Chart on Mexico - Market size and forecast 2025-2030 ($ million)
Data Table on Mexico - Market size and forecast 2025-2030 ($ million)
Chart on Mexico - Year-over-year growth 2025-2030 (%)
Data Table on Mexico - Year-over-year growth 2025-2030 (%)

12.4 Europe - Market size and forecast 2025-2030

Chart on Europe - Market size and forecast 2025-2030 ($ million)
Data Table on Europe - Market size and forecast 2025-2030 ($ million)
Chart on Europe - Year-over-year growth 2025-2030 (%)
Data Table on Europe - Year-over-year growth 2025-2030 (%)
Chart on Regional Comparison - Europe
Data Table on Regional Comparison - Europe

12.4.1 UK - Market size and forecast 2025-2030

Chart on UK - Market size and forecast 2025-2030 ($ million)
Data Table on UK - Market size and forecast 2025-2030 ($ million)
Chart on UK - Year-over-year growth 2025-2030 (%)
Data Table on UK - Year-over-year growth 2025-2030 (%)

12.4.2 Germany - Market size and forecast 2025-2030

Chart on Germany - Market size and forecast 2025-2030 ($ million)
Data Table on Germany - Market size and forecast 2025-2030 ($ million)
Chart on Germany - Year-over-year growth 2025-2030 (%)
Data Table on Germany - Year-over-year growth 2025-2030 (%)

12.4.3 France - Market size and forecast 2025-2030

Chart on France - Market size and forecast 2025-2030 ($ million)
Data Table on France - Market size and forecast 2025-2030 ($ million)
Chart on France - Year-over-year growth 2025-2030 (%)
Data Table on France - Year-over-year growth 2025-2030 (%)

12.4.4 Italy - Market size and forecast 2025-2030

Chart on Italy - Market size and forecast 2025-2030 ($ million)
Data Table on Italy - Market size and forecast 2025-2030 ($ million)
Chart on Italy - Year-over-year growth 2025-2030 (%)
Data Table on Italy - Year-over-year growth 2025-2030 (%)

12.4.5 Spain - Market size and forecast 2025-2030

Chart on Spain - Market size and forecast 2025-2030 ($ million)
Data Table on Spain - Market size and forecast 2025-2030 ($ million)
Chart on Spain - Year-over-year growth 2025-2030 (%)
Data Table on Spain - Year-over-year growth 2025-2030 (%)

12.4.6 The Netherlands - Market size and forecast 2025-2030

Chart on The Netherlands - Market size and forecast 2025-2030 ($ million)
Data Table on The Netherlands - Market size and forecast 2025-2030 ($ million)
Chart on The Netherlands - Year-over-year growth 2025-2030 (%)
Data Table on The Netherlands - Year-over-year growth 2025-2030 (%)

12.5 APAC - Market size and forecast 2025-2030

Chart on APAC - Market size and forecast 2025-2030 ($ million)
Data Table on APAC - Market size and forecast 2025-2030 ($ million)
Chart on APAC - Year-over-year growth 2025-2030 (%)
Data Table on APAC - Year-over-year growth 2025-2030 (%)
Chart on Regional Comparison - APAC
Data Table on Regional Comparison - APAC

12.5.1 China - Market size and forecast 2025-2030

Chart on China - Market size and forecast 2025-2030 ($ million)
Data Table on China - Market size and forecast 2025-2030 ($ million)
Chart on China - Year-over-year growth 2025-2030 (%)
Data Table on China - Year-over-year growth 2025-2030 (%)

12.5.2 Japan - Market size and forecast 2025-2030

Chart on Japan - Market size and forecast 2025-2030 ($ million)
Data Table on Japan - Market size and forecast 2025-2030 ($ million)
Chart on Japan - Year-over-year growth 2025-2030 (%)
Data Table on Japan - Year-over-year growth 2025-2030 (%)

12.5.3 India - Market size and forecast 2025-2030

Chart on India - Market size and forecast 2025-2030 ($ million)
Data Table on India - Market size and forecast 2025-2030 ($ million)
Chart on India - Year-over-year growth 2025-2030 (%)
Data Table on India - Year-over-year growth 2025-2030 (%)

12.5.4 South Korea - Market size and forecast 2025-2030

Chart on South Korea - Market size and forecast 2025-2030 ($ million)
Data Table on South Korea - Market size and forecast 2025-2030 ($ million)
Chart on South Korea - Year-over-year growth 2025-2030 (%)
Data Table on South Korea - Year-over-year growth 2025-2030 (%)

12.5.5 Australia - Market size and forecast 2025-2030

Chart on Australia - Market size and forecast 2025-2030 ($ million)
Data Table on Australia - Market size and forecast 2025-2030 ($ million)
Chart on Australia - Year-over-year growth 2025-2030 (%)
Data Table on Australia - Year-over-year growth 2025-2030 (%)

12.5.6 Indonesia - Market size and forecast 2025-2030

Chart on Indonesia - Market size and forecast 2025-2030 ($ million)
Data Table on Indonesia - Market size and forecast 2025-2030 ($ million)
Chart on Indonesia - Year-over-year growth 2025-2030 (%)
Data Table on Indonesia - Year-over-year growth 2025-2030 (%)

12.6 Middle East and Africa - Market size and forecast 2025-2030

Chart on Middle East and Africa - Market size and forecast 2025-2030 ($ million)
Data Table on Middle East and Africa - Market size and forecast 2025-2030 ($ million)
Chart on Middle East and Africa - Year-over-year growth 2025-2030 (%)
Data Table on Middle East and Africa - Year-over-year growth 2025-2030 (%)
Chart on Regional Comparison - Middle East and Africa
Data Table on Regional Comparison - Middle East and Africa

12.6.1 Saudi Arabia - Market size and forecast 2025-2030

Chart on Saudi Arabia - Market size and forecast 2025-2030 ($ million)
Data Table on Saudi Arabia - Market size and forecast 2025-2030 ($ million)
Chart on Saudi Arabia - Year-over-year growth 2025-2030 (%)
Data Table on Saudi Arabia - Year-over-year growth 2025-2030 (%)

12.6.2 UAE - Market size and forecast 2025-2030

Chart on UAE - Market size and forecast 2025-2030 ($ million)
Data Table on UAE - Market size and forecast 2025-2030 ($ million)
Chart on UAE - Year-over-year growth 2025-2030 (%)
Data Table on UAE - Year-over-year growth 2025-2030 (%)

12.6.3 South Africa - Market size and forecast 2025-2030

Chart on South Africa - Market size and forecast 2025-2030 ($ million)
Data Table on South Africa - Market size and forecast 2025-2030 ($ million)
Chart on South Africa - Year-over-year growth 2025-2030 (%)
Data Table on South Africa - Year-over-year growth 2025-2030 (%)

12.6.4 Israel - Market size and forecast 2025-2030

Chart on Israel - Market size and forecast 2025-2030 ($ million)
Data Table on Israel - Market size and forecast 2025-2030 ($ million)
Chart on Israel - Year-over-year growth 2025-2030 (%)
Data Table on Israel - Year-over-year growth 2025-2030 (%)

12.6.5 Turkey - Market size and forecast 2025-2030

Chart on Turkey - Market size and forecast 2025-2030 ($ million)
Data Table on Turkey - Market size and forecast 2025-2030 ($ million)
Chart on Turkey - Year-over-year growth 2025-2030 (%)
Data Table on Turkey - Year-over-year growth 2025-2030 (%)

12.7 South America - Market size and forecast 2025-2030

Chart on South America - Market size and forecast 2025-2030 ($ million)
Data Table on South America - Market size and forecast 2025-2030 ($ million)
Chart on South America - Year-over-year growth 2025-2030 (%)
Data Table on South America - Year-over-year growth 2025-2030 (%)
Chart on Regional Comparison - South America
Data Table on Regional Comparison - South America

12.7.1 Brazil - Market size and forecast 2025-2030

Chart on Brazil - Market size and forecast 2025-2030 ($ million)
Data Table on Brazil - Market size and forecast 2025-2030 ($ million)
Chart on Brazil - Year-over-year growth 2025-2030 (%)
Data Table on Brazil - Year-over-year growth 2025-2030 (%)

12.7.2 Argentina - Market size and forecast 2025-2030

Chart on Argentina - Market size and forecast 2025-2030 ($ million)
Data Table on Argentina - Market size and forecast 2025-2030 ($ million)
Chart on Argentina - Year-over-year growth 2025-2030 (%)
Data Table on Argentina - Year-over-year growth 2025-2030 (%)

12.7.3 Colombia - Market size and forecast 2025-2030

Chart on Colombia - Market size and forecast 2025-2030 ($ million)
Data Table on Colombia - Market size and forecast 2025-2030 ($ million)
Chart on Colombia - Year-over-year growth 2025-2030 (%)
Data Table on Colombia - Year-over-year growth 2025-2030 (%)

12.8 Market opportunity by geography

Market opportunity by geography ($ million)
Data Tables on Market opportunity by geography ($ million)

13. Drivers, Challenges, and Opportunity

13.1 Market drivers

Rapid expansion of global commercial aircraft fleets and increasing air traffic volumes
Technological advancements in 3d phase measurement and AI integration
Aging aircraft fleets and stringent regulatory safety mandates

13.2 Market challenges

High acquisition costs and significant maintenance expenses of advanced borescope systems
Severe shortage of skilled aviation maintenance technicians and inspectors
Supply chain vulnerabilities and geopolitical instability impacting MRO operations

13.3 Impact of drivers and challenges

Impact of drivers and challenges in 2025 and 2030

13.4 Market opportunities

Integration of AI and assisted defect recognition in aviation inspection
Shift toward connectivity and digital MRO ecosystems
Miniaturization and rise of robotic inspection platforms

14. Competitive Landscape

14.1 Overview

14.2

Overview on criticality of inputs and factors of differentiation

14.3 Landscape disruption

Overview on factors of disruption

14.4 Industry risks

Impact of key risks on business

15. Competitive Analysis

15.1 Companies profiled

Companies covered

15.2 Company ranking index

15.3 Market positioning of companies

Matrix on companies position and classification

15.4 CAE Inc.

CAE Inc. - Overview
CAE Inc. - Business segments
CAE Inc. - Key offerings
CAE Inc. - Segment focus
SWOT

15.5 EFER Endoscopy

EFER Endoscopy - Overview
EFER Endoscopy - Product / Service
EFER Endoscopy - Key offerings
SWOT

15.6 Evident Corp.

Evident Corp. - Overview
Evident Corp. - Product / Service
Evident Corp. - Key offerings
SWOT

15.7 General Electric Co.

General Electric Co. - Overview
General Electric Co. - Product / Service
General Electric Co. - Key offerings
SWOT

15.8 Gradient Lens Corporation

Gradient Lens Corporation - Overview
Gradient Lens Corporation - Product / Service
Gradient Lens Corporation - Key offerings
SWOT

15.9 Lenox Instrument Co.

Lenox Instrument Co. - Overview
Lenox Instrument Co. - Product / Service
Lenox Instrument Co. - Key offerings
SWOT

15.10 Machida Endoscope Co. Ltd.

Machida Endoscope Co. Ltd. - Overview
Machida Endoscope Co. Ltd. - Product / Service
Machida Endoscope Co. Ltd. - Key offerings
SWOT

15.11 Medical Intubation Tech. Corp.

Medical Intubation Tech. Corp. - Overview
Medical Intubation Tech. Corp. - Product / Service
Medical Intubation Tech. Corp. - Key offerings
SWOT

15.12 Oasis Scientific

Oasis Scientific - Overview
Oasis Scientific - Product / Service
Oasis Scientific - Key offerings
SWOT

15.13 PCE Holding GmbH

PCE Holding GmbH - Overview
PCE Holding GmbH - Product / Service
PCE Holding GmbH - Key offerings
SWOT

15.14 Richard Wolf GmbH

Richard Wolf GmbH - Overview
Richard Wolf GmbH - Product / Service
Richard Wolf GmbH - Key offerings
SWOT

15.15 SPI Borescopes LLC

SPI Borescopes LLC - Overview
SPI Borescopes LLC - Product / Service
SPI Borescopes LLC - Key offerings
SWOT

15.16 ViewTech Borescopes

ViewTech Borescopes - Overview
ViewTech Borescopes - Product / Service
ViewTech Borescopes - Key offerings
SWOT

15.17 viZaar industrial imaging AG

viZaar industrial imaging AG - Overview
viZaar industrial imaging AG - Product / Service
viZaar industrial imaging AG - Key offerings
SWOT

15.18 Yateks

Yateks - Overview
Yateks - Product / Service
Yateks - Key offerings
SWOT

16. Appendix

16.1 Scope of the report

Market definition
Objectives
Notes and caveats

16.2 Inclusions and exclusions checklist

Inclusions checklist
Exclusions checklist

16.3 Currency conversion rates for US$

16.4 Research methodology

16.5 Data procurement

Information sources

16.6 Data validation

16.7 Validation techniques employed for market sizing

16.8 Data synthesis

16.9 360 degree market analysis

16.10 List of abbreviations

Research Methodology

Technavio presents a detailed picture of the market by way of study, synthesis, and summation of data from multiple sources. The analysts have presented the various facets of the market with a particular focus on identifying the key industry influencers. The data thus presented is comprehensive, reliable, and the result of extensive research, both primary and secondary.

INFORMATION SOURCES

Primary sources

  • Manufacturers and suppliers
  • Channel partners
  • Industry experts
  • Strategic decision makers

Secondary sources

  • Industry journals and periodicals
  • Government data
  • Financial reports of key industry players
  • Historical data
  • Press releases

DATA ANALYSIS

Data Synthesis

  • Collation of data
  • Estimation of key figures
  • Analysis of derived insights

Data Validation

  • Triangulation with data models
  • Reference against proprietary databases
  • Corroboration with industry experts

REPORT WRITING

Qualitative

  • Market drivers
  • Market challenges
  • Market trends
  • Five forces analysis

Quantitative

  • Market size and forecast
  • Market segmentation
  • Geographical insights
  • Competitive landscape

Interested in this report?

Get your sample now to see our research methodology and insights!

Download Now

Frequently Asked Questions

Aviation Borescope market growth will increase by USD 698.2 million during 2026-2030 .

The Aviation Borescope market is expected to grow at a CAGR of 8% during 2026-2030 .

Aviation Borescope market is segmented by Type (Video borescopes, Flexible borescopes, Rigid borescopes, Semi-rigid borescopes) Application (Aircraft engine inspection, Airframe inspection, Component inspection, FOD inspection) End-user (Commercial airplanes, Military aviation airplanes, Business aviation airplanes)

CAE Inc., EFER Endoscopy, Evident Corp., General Electric Co., Gradient Lens Corporation, Guantai Automation Tech. Co. Ltd., JME Technologies Inc., Lenox Instrument Co., Machida Endoscope Co. Ltd., Medical Intubation Tech. Corp., Oasis Scientific, PCE Holding GmbH, Richard Wolf GmbH, SPI Borescopes LLC, USA Borescopes LLC, ViewTech Borescopes, viZaar industrial imaging AG, Yateks are a few of the key vendors in the Aviation Borescope market.

APAC will register the highest growth rate of 32.5% among the other regions. Therefore, the Aviation Borescope market in APAC is expected to garner significant business opportunities for the vendors during the forecast period.

US, Canada, Mexico, UK, Germany, France, Italy, Spain, The Netherlands, China, Japan, India, South Korea, Australia, Indonesia, Saudi Arabia, UAE, South Africa, Israel, Turkey, Brazil, Argentina, Colombia

  • Rapid expansion of global commercial aircraft fleets and increasing air traffic volumes is the driving factor this market.

The Aviation Borescope market vendors should focus on grabbing business opportunities from the Type segment as it accounted for the largest market share in the base year.