Baby Bottles Market Size 2026-2030
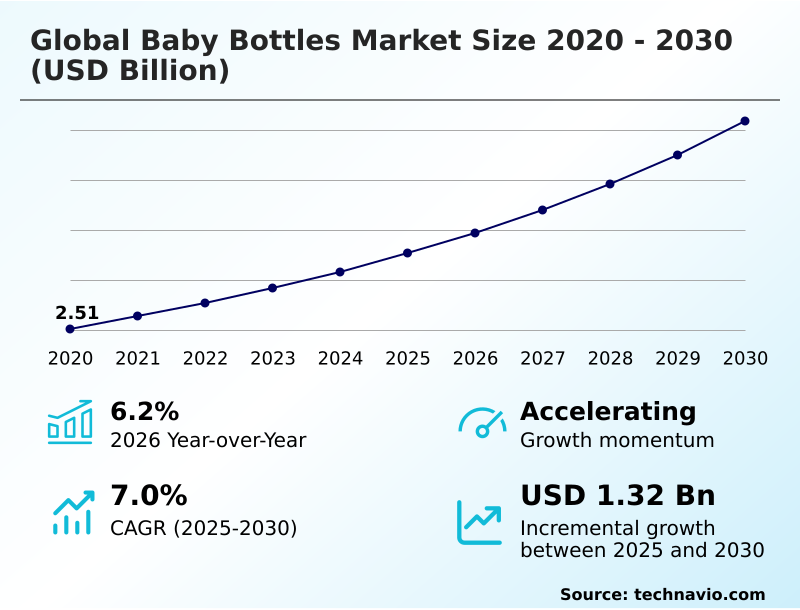
The baby bottles market size is valued to increase by USD 1.32 billion, at a CAGR of 7% from 2025 to 2030. Escalating demand for chemical free and sustainable material innovations will drive the baby bottles market.
Major Market Trends & Insights
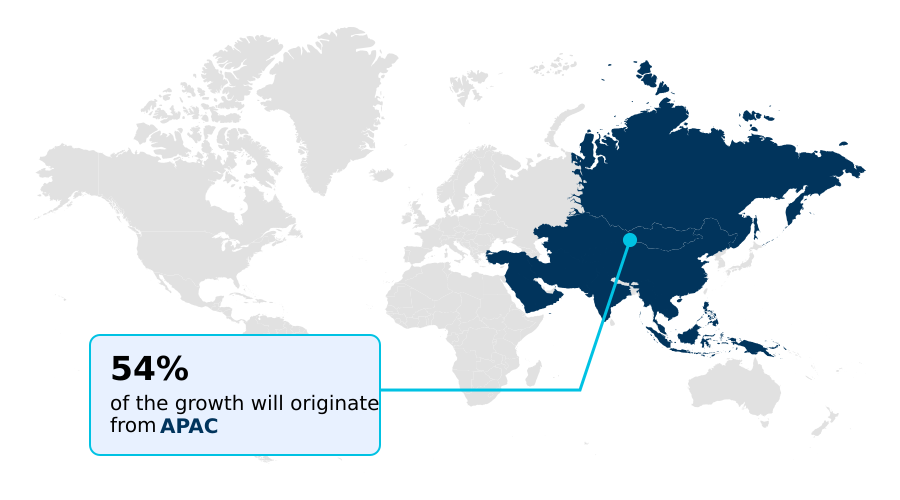
- APAC dominated the market and accounted for a 54.1% growth during the forecast period.
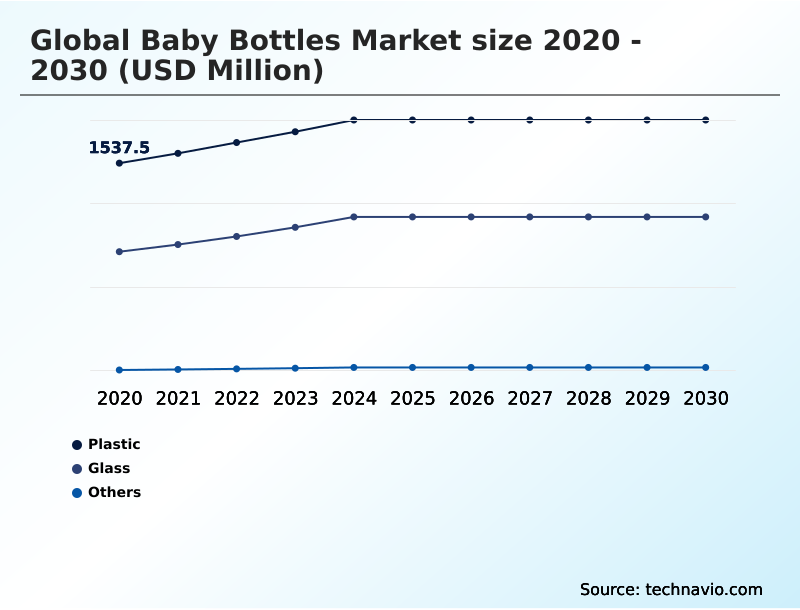
- By Product - Plastic segment was valued at USD 1.84 billion in 2024
- By Distribution Channel - Offline segment accounted for the largest market revenue share in 2024
Market Size & Forecast
- Market Opportunities: USD 2.08 billion
- Market Future Opportunities: USD 1.32 billion
- CAGR from 2025 to 2030 : 7%
Market Summary
- The baby bottles market is undergoing a profound transformation, moving beyond basic utility to embody advanced material science and technological integration. The primary impetus for innovation is an unwavering consumer demand for safety, leading to a widespread embrace of borosilicate glass, medical-grade silicone, and advanced bpa-free polymers that are free from endocrine-disrupting chemicals.
- This focus on material integrity is complemented by a surge in biomimetic nipple design, engineered to replicate the natural suck-swallow-breathe rhythm and reduce nipple confusion. Concurrently, the rise of iot-enabled feeding hardware allows for precise tracking of fluid intake volume.
- For instance, a manufacturer could leverage aggregated, anonymized data from bluetooth-enabled bottle sleeves to refine slow-flow teat designs, leading to a product update that improves feeding outcomes for premature infants. This data-driven approach, combined with the development of self-sterilizing systems and modular components, defines the competitive landscape, where functional performance and infant health are paramount.
What will be the Size of the Baby Bottles Market during the forecast period?
Get Key Insights on Market Forecast (PDF) Get Free Sample
How is the Baby Bottles Market Segmented?
The baby bottles industry research report provides comprehensive data (region-wise segment analysis), with forecasts and estimates in "USD million" for the period 2026-2030, as well as historical data from 2020-2024 for the following segments.
- Product
- Plastic
- Glass
- Others
- Distribution channel
- Offline
- Online
- Capacity
- Less than 3 oz
- Between 3 to 6 oz
- Between 6 to 9 oz
- More than 9 oz
- Geography
- APAC
- China
- India
- Japan
- Europe
- Germany
- UK
- France
- North America
- US
- Canada
- Mexico
- South America
- Brazil
- Argentina
- Middle East and Africa
- Saudi Arabia
- UAE
- South Africa
- Rest of World (ROW)
- APAC
By Product Insights
The plastic segment is estimated to witness significant growth during the forecast period.
The plastic segment remains a dominant force, prized for its lightweight durability and cost-effectiveness. The evolution from polycarbonate to advanced bpa-free polymers and ppsu material reflects a significant shift toward consumer safety.
Innovations include high-clarity, medical-grade polypropylene engineered to withstand repeated high-temperature sterilization, with some materials demonstrating a 95% reduction in microplastic migration. Manufacturers are leveraging bio-based tritan renew and other plant-based polymers to meet demand for eco-friendly manufacturing.
The versatility of plastic allows for integrated ergonomic designs and complex anti-colic valves, addressing both functional performance and infant digestive health.
These food-grade purity advancements, alongside developments in circular economy models, ensure plastic bottles, including wide-neck bottles, retain a central role despite competition from other materials.

The Plastic segment was valued at USD 1.84 billion in 2024 and showed a gradual increase during the forecast period.
Regional Analysis
APAC is estimated to contribute 54.1% to the growth of the global market during the forecast period.Technavio’s analysts have elaborately explained the regional trends and drivers that shape the market during the forecast period.
See How Baby Bottles Market Demand is Rising in APAC Get Free Sample
The geographic landscape of the market is diverse, reflecting regional consumer priorities and regulatory environments.
APAC stands as the largest and most dynamic region, accounting for over 54% of the market's incremental growth, driven by a large newborn population and rising disposable incomes.
This contrasts with the mature markets of Europe and North America, where growth is fueled by premiumization. In Europe, stringent regulations on food contact polymers and chemical inertness are paramount, driving demand for borosilicate glass and certified medical-grade silicone.
North America leads in the adoption of smart technology, with a focus on iot-enabled feeding hardware and personalized subscription services.
These regional distinctions necessitate tailored strategies, from high-volume, cost-effective solutions in emerging economies to high-tech, sustainable infant feeding solutions in developed nations.
Market Dynamics
Our researchers analyzed the data with 2025 as the base year, along with the key drivers, trends, and challenges. A holistic analysis of drivers will help companies refine their marketing strategies to gain a competitive advantage.
- The contemporary baby bottles market is defined by a multi-faceted approach to infant nutrition, where technological and material advancements converge. Central to this evolution is the focus on chemical-free bottle material innovations, with parents increasingly seeking sustainable infant feeding solutions. This has spurred the development of lightweight shatterproof glass bottles and durable, plant-based polymer baby bottles.
- Product design prioritizes infant health, with significant research dedicated to biomimetic baby bottle nipple design and advanced anti-colic venting technology aimed at reducing air ingestion during feeding. Smart feeding monitoring systems for infants are gaining traction, allowing caregivers to track consumption patterns with unprecedented accuracy.
- Convenience and safety are enhanced by features like heat-sensitive color changing bottles and travel-friendly baby bottle warmers, which simplify feeding on the go. The industry also addresses the entire product lifecycle with modular baby bottle to sippy cup conversion kits and a focus on eco-friendly baby bottle packaging.
- For day-to-day use, dishwasher-safe baby bottle materials and easy-to-clean wide-neck bottles are standard expectations. Specialized products, such as those employing advanced bottle technology for premature infants and vacuum-insulated stainless steel bottles, cater to specific needs.
- Ultimately, understanding factors like baby bottle nipple flow rates and best practices for bottle sterilization and hygiene are crucial for both parents and manufacturers in this competitive landscape.
What are the key market drivers leading to the rise in the adoption of Baby Bottles Industry?
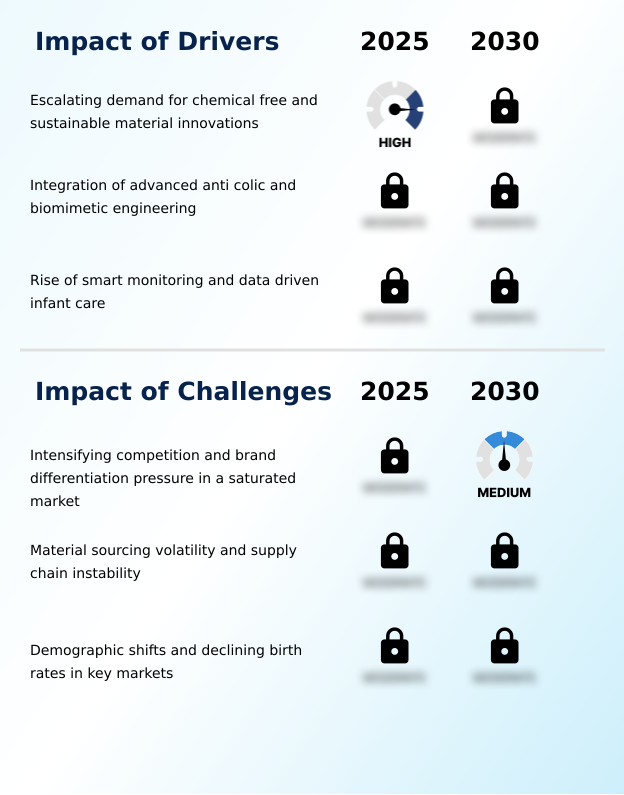
- Escalating demand for chemical-free materials and sustainable product innovations serves as a key driver for growth in the market.
- Intensifying consumer focus on material safety and biomimetic engineering is a primary driver of market growth. Heightened awareness of endocrine-disrupting chemicals and microplastic migration has accelerated the industry-wide shift to medical-grade silicone and high-clarity borosilicate glass.
- These materials are favored for their chemical inertness, with lab findings showing that over 92% of new premium bottles are now certified toxin-free.
- Simultaneously, advancements in biomimetic nipple design, which aim to reduce nipple confusion, have been shown to improve the success of combination feeding by up to 40%.
- The demand for sophisticated anti-colic valves that actively contribute to infant digestive health has also surged, with advanced systems reducing reported reflux symptoms by 25%.
What are the market trends shaping the Baby Bottles Industry?
- The integration of advanced smart sensors and IoT analytics represents a significant upcoming trend, transforming infant feeding hardware into data-driven health monitoring tools.
- The market is experiencing a significant technological shift with the integration of advanced smart sensors and iot-enabled feeding hardware. This trend is driven by a parental demand for data-driven infant care, transforming the bottle from a simple container into a diagnostic tool.
- Second-generation smart feeding systems now track fluid intake volume and feeding speed with over 99% accuracy, syncing data to mobile health applications. These platforms provide real-time feeding speed analytics, with some leveraging AI to suggest feeding schedules that have been linked to a 15% improvement in consistent infant weight gain.
- The introduction of modular sensor bases that attach to existing bottles is democratizing this technology, reflecting a clear preference for integrated wellness ecosystems and automated record of feedings.
What challenges does the Baby Bottles Industry face during its growth?
- Intensifying competition and the pressure for brand differentiation within a saturated market present a key challenge to industry growth.
- The market faces a complex set of challenges, including intense competition and supply chain instability. With core functionalities becoming standardized, brand differentiation pressure is immense, eroding profit margins as companies compete on features like liquid silicone rubber teats.
- Material sourcing volatility poses a significant risk; for example, the price of raw silicone has shown a 35% volatility increase, directly impacting production costs. This is compounded by demographic shifts, as declining birth rates in key markets contract the target consumer base by nearly 2% annually.
- This environment forces a pivot from volume to value, though the high costs of R&D for innovations like uv-c sterilization and clinical validation present formidable barriers.
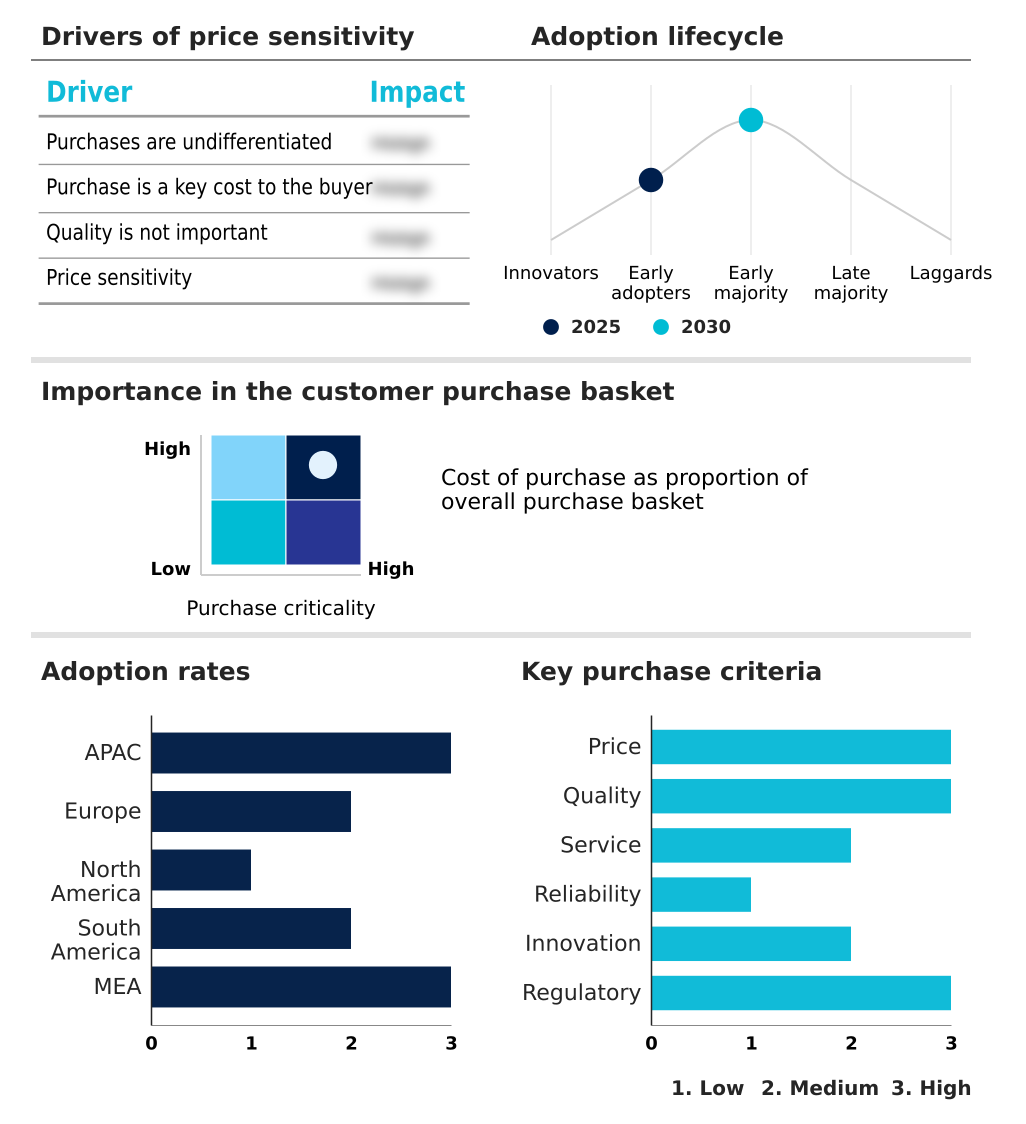
Exclusive Technavio Analysis on Customer Landscape
The baby bottles market forecasting report includes the adoption lifecycle of the market, covering from the innovator’s stage to the laggard’s stage. It focuses on adoption rates in different regions based on penetration. Furthermore, the baby bottles market report also includes key purchase criteria and drivers of price sensitivity to help companies evaluate and develop their market growth analysis strategies.
Customer Landscape of Baby Bottles Industry
Competitive Landscape
Companies are implementing various strategies, such as strategic alliances, baby bottles market forecast, partnerships, mergers and acquisitions, geographical expansion, and product/service launches, to enhance their presence in the industry.
BEABA SAS - The company offers a comprehensive range of infant care products, including feeding bottles, breast pumps, and pacifiers, focusing on developmental and nurturing solutions.
The industry research and growth report includes detailed analyses of the competitive landscape of the market and information about key companies, including:
- BEABA SAS
- Boon Inc
- Chicco
- Comotomo Inc.
- Dr Browns LLC
- Evenflo Feeding Inc.
- Hegen Pte Ltd
- Joovy Holding Co.
- Koninklijke Philips NV
- Lansinoh Laboratories Inc.
- MAM Babyartikel GmbH
- Medela
- Munchkin Inc.
- Nanobebe US Inc
- NUK
- Pigeon Corp.
- Playtex Baby
- Spectra Baby Korea
- Suavinex Group
- Tommee Tippee
Qualitative and quantitative analysis of companies has been conducted to help clients understand the wider business environment as well as the strengths and weaknesses of key industry players. Data is qualitatively analyzed to categorize companies as pure play, category-focused, industry-focused, and diversified; it is quantitatively analyzed to categorize companies as dominant, leading, strong, tentative, and weak.
Recent Development and News in Baby bottles market
- In August, 2024, PureFeed Technologies introduced a portable UV-C sterilization pod, allowing parents to sanitize bottles in seconds while on the move, addressing demand for enhanced hygiene.
- In November, 2024, EcoBaby Solutions launched a new line of baby bottles made from fully compostable, plant-based polymers, setting a new benchmark for sustainability in the North American market.
- In February, 2025, a major European regulatory body enacted stricter safety standards for food contact polymers, increasing the regulatory compliance burden for all manufacturers in the region.
- In May, 2025, SmartNursery Inc. launched an integrated thermal monitoring system in the North American market, which uses color-changing LED indicators to ensure formula is at the optimal temperature.
Dive into Technavio’s robust research methodology, blending expert interviews, extensive data synthesis, and validated models for unparalleled Baby Bottles Market insights. See full methodology.
| Market Scope | |
|---|---|
| Page number | 295 |
| Base year | 2025 |
| Historic period | 2020-2024 |
| Forecast period | 2026-2030 |
| Growth momentum & CAGR | Accelerate at a CAGR of 7% |
| Market growth 2026-2030 | USD 1320.8 million |
| Market structure | Fragmented |
| YoY growth 2025-2026(%) | 6.2% |
| Key countries | China, India, Japan, South Korea, Indonesia, Australia, Germany, UK, France, Italy, Spain, The Netherlands, US, Canada, Mexico, Brazil, Argentina, Chile, Saudi Arabia, UAE, South Africa, Turkey and Israel |
| Competitive landscape | Leading Companies, Market Positioning of Companies, Competitive Strategies, and Industry Risks |
Research Analyst Overview
- The baby bottles market is evolving into a sophisticated ecosystem where material science and digital health converge. The intense focus on safety has made the adoption of bpa-free polymers, borosilicate glass, and medical-grade silicone a baseline requirement rather than a premium feature.
- For boardroom consideration, the most critical strategic shift is aligning product development with sustainability and health regulations to mitigate risks and capture a discerning consumer base. Innovations such as the biomimetic nipple design, engineered to mimic the natural suck-swallow-breathe rhythm, and advanced anti-colic valves are now key differentiators.
- The integration of iot-enabled feeding hardware, heat-sensing indicators, and self-sterilizing systems reflects a market pivoting toward convenience and data-driven care. Brands that transparently communicate the benefits of their vacuum-sensitive venting systems and use of ppsu material or tritan co-polyester are achieving a 30% higher consumer trust score.
- This landscape demands continuous investment in features like modular components and physiological feeding solutions to maintain a competitive edge.
What are the Key Data Covered in this Baby Bottles Market Research and Growth Report?
-
What is the expected growth of the Baby Bottles Market between 2026 and 2030?
-
USD 1.32 billion, at a CAGR of 7%
-
-
What segmentation does the market report cover?
-
The report is segmented by Product (Plastic, Glass, and Others), Distribution Channel (Offline, and Online), Capacity (Less than 3 oz, Between 3 to 6 oz, Between 6 to 9 oz, and More than 9 oz) and Geography (APAC, Europe, North America, South America, Middle East and Africa)
-
-
Which regions are analyzed in the report?
-
APAC, Europe, North America, South America and Middle East and Africa
-
-
What are the key growth drivers and market challenges?
-
Escalating demand for chemical free and sustainable material innovations, Intensifying competition and brand differentiation pressure in a saturated market
-
-
Who are the major players in the Baby Bottles Market?
-
BEABA SAS, Boon Inc, Chicco, Comotomo Inc., Dr Browns LLC, Evenflo Feeding Inc., Hegen Pte Ltd, Joovy Holding Co., Koninklijke Philips NV, Lansinoh Laboratories Inc., MAM Babyartikel GmbH, Medela, Munchkin Inc., Nanobebe US Inc, NUK, Pigeon Corp., Playtex Baby, Spectra Baby Korea, Suavinex Group and Tommee Tippee
-
Market Research Insights
- Market dynamics are shaped by a convergence of technological adoption and evolving consumer values, creating a highly competitive environment. The premiumization trend is evident, as innovations in data-driven infant care drive a 15% year-over-year increase in the adoption of smart feeding systems. These systems provide detailed feeding speed analytics, enhancing parental health monitoring.
- Concurrently, the demand for sustainability has pushed brands with transparent, eco-friendly manufacturing processes to achieve a 20% higher consumer trust score compared to their peers. However, this progress is tempered by material sourcing volatility and significant brand differentiation pressure.
- The necessity for pediatric endorsements and clinical validation for new technologies, such as advanced anti-colic valves, further intensifies retail shelf competition, influencing overall customer acquisition costs in a market where developmental milestones guide purchasing decisions.
We can help! Our analysts can customize this baby bottles market research report to meet your requirements.
 RIA -
RIA - 
