Baby Food And Infant Formula Market Size 2026-2030
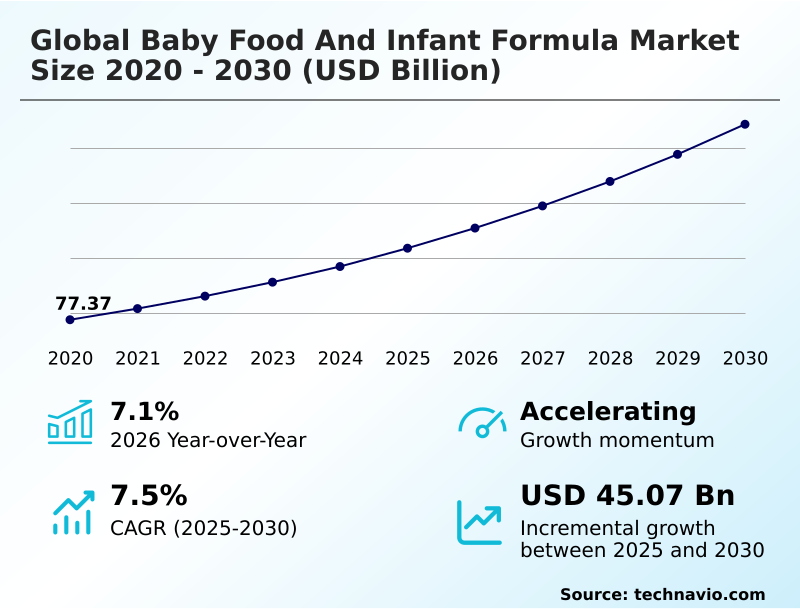
The baby food and infant formula market size is valued to increase by USD 45.07 billion, at a CAGR of 7.5% from 2025 to 2030. Mainstreaming of functional fortification and human milk oligosaccharide (HMO) integration will drive the baby food and infant formula market.
Major Market Trends & Insights
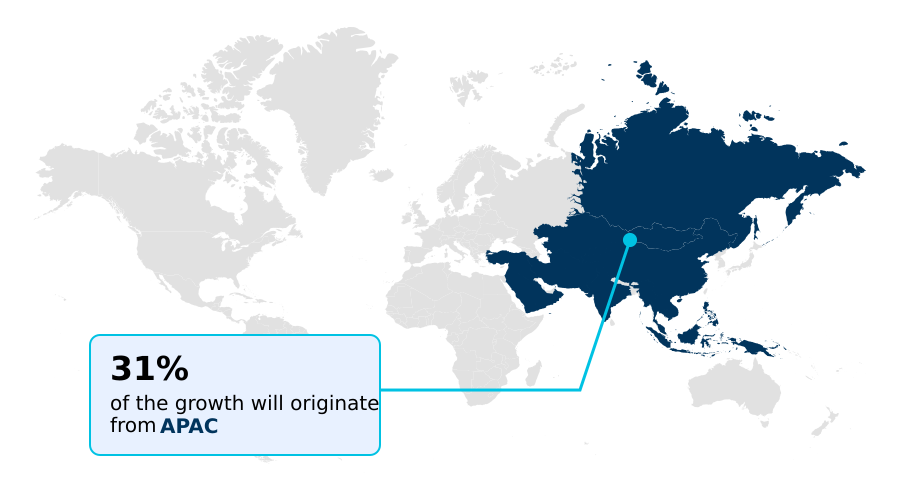
- APAC dominated the market and accounted for a 31.2% growth during the forecast period.
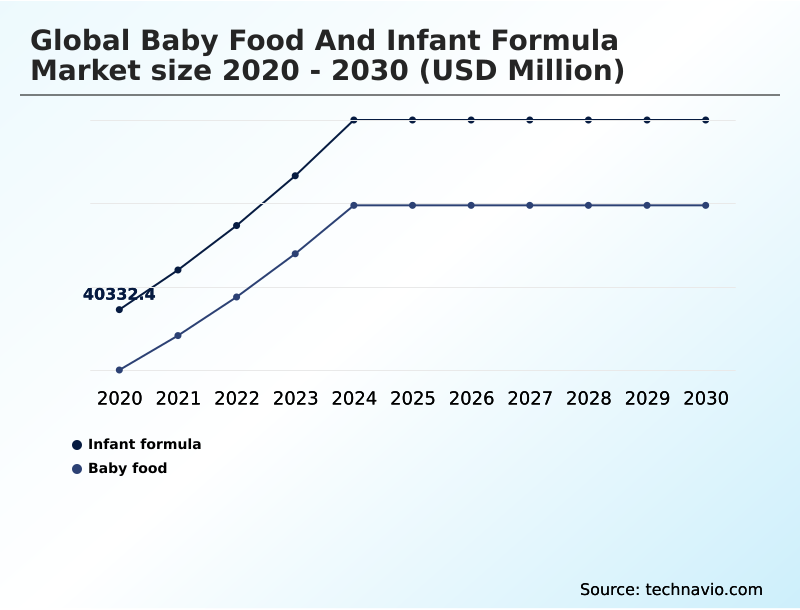
- By Product - Infant formula segment was valued at USD 50.69 billion in 2024
- By Type - Milk formula segment accounted for the largest market revenue share in 2024
Market Size & Forecast
- Market Opportunities: USD 71.08 billion
- Market Future Opportunities: USD 45.07 billion
- CAGR from 2025 to 2030 : 7.5%
Market Summary
- The baby food and infant formula market is undergoing a significant transformation, driven by a heightened focus on nutritional science and parental demand for transparency. The industry is moving beyond basic sustenance to deliver products featuring functional fortification and bioactive proteins aimed at supporting cognitive development and infant gut microbiome health.
- A key trend is the adoption of clean-label transparency, with an emphasis on non-gmo ingredients and comprehensive organic certification. This evolution is also shaped by supply chain dynamics, where, for instance, a manufacturer might implement a blockchain-based traceability system. This not only enhances ingredient provenance verification but also improves product recall management by over 40%, safeguarding consumer trust.
- Concurrently, the rise of direct-to-consumer models, facilitated by sophisticated digital omni-channel distribution, allows for personalized nutrition programs and subscription-based models, catering to modern caregivers. Challenges persist, including stringent food safety regulations and the need for sustainable packaging solutions, which compel continuous innovation in both formulation and operational practices.
- This competitive landscape rewards companies that can effectively balance scientific advancement with ethical sourcing and robust safety protocols.
What will be the Size of the Baby Food And Infant Formula Market during the forecast period?
Get Key Insights on Market Forecast (PDF) Get Free Sample
How is the Baby Food And Infant Formula Market Segmented?
The baby food and infant formula industry research report provides comprehensive data (region-wise segment analysis), with forecasts and estimates in "USD million" for the period 2026-2030, as well as historical data from 2020-2024 for the following segments.
- Product
- Infant formula
- Baby food
- Type
- Milk formula
- Dried baby food
- Prepared baby food
- Others
- Form factor
- Solid
- Liquid
- Geography
- APAC
- China
- India
- Indonesia
- Europe
- Germany
- UK
- France
- North America
- US
- Canada
- Mexico
- South America
- Brazil
- Argentina
- Middle East and Africa
- Saudi Arabia
- UAE
- South Africa
- Rest of World (ROW)
- APAC
By Product Insights
The infant formula segment is estimated to witness significant growth during the forecast period.
The infant formula segment is defined by a strategic pivot toward nutritional precision, where bio-mimicry guides product development. Manufacturers are leveraging pediatric nutrition science to replicate human milk's complexity, incorporating ingredients like A2 protein variants and exploring goat milk-based formulas.
The market is also preparing for disruptive technologies like cell-cultured breast milk. This drive for premium product positioning is supported by personalized nutrition programs available through expanding e-commerce platforms, which are growing nearly twice as fast as traditional retail.
Maintaining consumer trust and brand loyalty hinges on stringent microbial controls, a non-negotiable aspect for producers in this highly sensitive category, especially as quick-commerce reshapes distribution expectations for these essential goods.
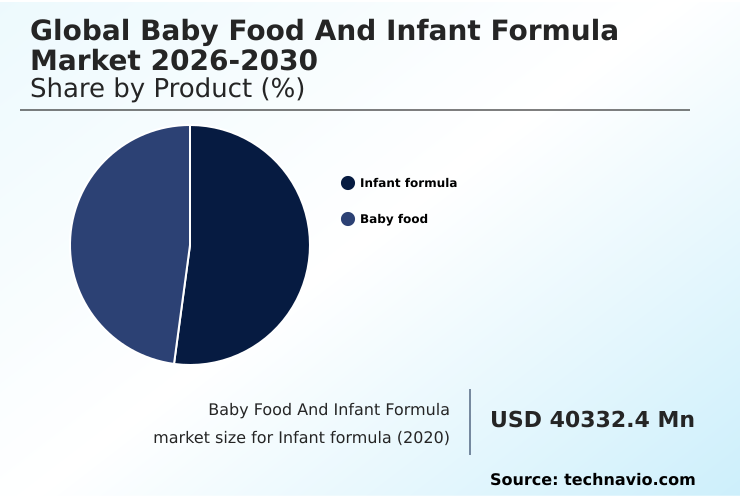
The Infant formula segment was valued at USD 50.69 billion in 2024 and showed a gradual increase during the forecast period.
Regional Analysis
APAC is estimated to contribute 31.2% to the growth of the global market during the forecast period.Technavio’s analysts have elaborately explained the regional trends and drivers that shape the market during the forecast period.
See How Baby Food And Infant Formula Market Demand is Rising in APAC Get Free Sample
Regional dynamics are highly varied, with APAC contributing over 31% of the incremental growth, driven by demand for fortified weaning foods.
In contrast, mature markets in Europe and North America focus on premium products like grass-fed formulas and hydrolyzed protein options. The demand for convenience is universal, boosting sales of ready-to-feed liquids that utilize ultra-high-temperature processing.
However, supply chain fragility remains a key concern, as a disruption in one region can impact global availability. Companies are investing in farm-to-table traceability to ensure ethical sourcing and mitigate risks.
Despite declining global fertility rates in some developed nations, the market avoids stagnation through innovation in products like zero-sugar solid cereals and those containing lactoferrin, while stringent microbiological monitoring helps prevent market consolidation driven by safety issues.
Market Dynamics
Our researchers analyzed the data with 2025 as the base year, along with the key drivers, trends, and challenges. A holistic analysis of drivers will help companies refine their marketing strategies to gain a competitive advantage.
- The future of infant nutrition is being shaped by several interconnected factors, creating a complex but opportunity-rich environment. The benefits of hmo fortified infant formula are a central focus for manufacturers, who are investing heavily in advanced formulations in infant nutrition to support cognitive development nutritionally.
- Simultaneously, plant-based baby food market growth is accelerating, driven by demand for allergen-free formula market trends and a broader consumer shift toward sustainable diets. This places immense pressure on companies to ensure organic baby food safety standards are impeccably maintained, especially with ongoing efforts aimed at reducing heavy metals in baby food.
- The industry must also navigate the significant impact of declining birth rates in key markets, which is pushing brands toward premiumization and innovative business models, such as subscription models for infant formula that enhance customer loyalty. To succeed, companies must master their operations.
- Ensuring robust traceability in the baby food supply chain is no longer optional, as consumer trust after product recalls is fragile and hard-won. This is particularly crucial given the stringent regulations for breast-milk substitutes and evolving digital marketing restrictions for formula. Innovations like high-pressure processing for purees and savory-first baby food development are creating new product categories.
- Ultimately, firms that are adept at managing supply chain disruptions effectively, while demonstrating clean-label transparency in baby food and adopting sustainable packaging for infant products, will lead the market. The adoption of subscription services has shown to improve customer lifetime value by over 20% compared to traditional retail models, highlighting a clear path for strategic growth.
What are the key market drivers leading to the rise in the adoption of Baby Food And Infant Formula Industry?
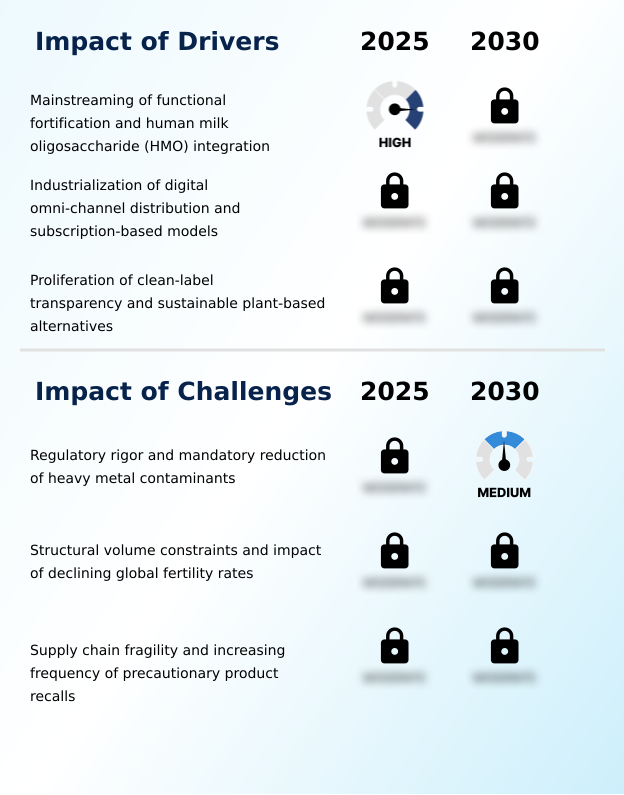
- The mainstreaming of functional fortification and the integration of human milk oligosaccharides (HMOs) are key drivers propelling market growth.
- A key driver is the industrialization of digital omni-channel distribution, which supports convenient subscription-based models that have seen adoption rates increase by 25% in urban centers.
- This shift is amplified by the proliferation of clean-label transparency and sustainable plant-based alternatives, appealing to parents who prioritize environmental stewardship. The adoption of high-pressure processing for savory-forward complementary foods preserves nutrients more effectively than traditional methods.
- Brands are also focusing on functional fortification to address micronutrient deficiencies, aligning with the principles of baby-led weaning.
- Furthermore, the move toward circular packaging is a core component of the circular economy principles being adopted, as manufacturers work to reduce waste and enhance sustainability.
What are the market trends shaping the Baby Food And Infant Formula Industry?
- The rise of bio-mimicry and precision fermentation in infant formula production is an upcoming market trend. This evolution focuses on accurately replicating the nutritional complexity of human milk.
- The market is increasingly shaped by the trend of palate engineering, which promotes savory-forward complementary foods to establish healthy eating habits. Innovations in advanced biotechnology are enabling the creation of dairy-free alternatives and specialized toddler milks that cater to specific dietary needs. The demand for medical-grade formulas is also rising to address allergen-aware formulations.
- To build trust, brands are focusing on ingredient provenance and supply chain traceability, with QR-code enabled packaging improving transparency by over 50%. This focus on third-party verified safety is critical, as food safety regulations concerning heavy metal contaminants become more stringent. Effective product recall management systems are now a baseline expectation for operational resilience.
What challenges does the Baby Food And Infant Formula Industry face during its growth?
- Increasing regulatory rigor and the mandatory reduction of heavy metal contaminants present a key challenge affecting industry growth.
- The market faces structural constraints from declining global fertility rates, compelling a strategic shift toward premium products. This includes hypoallergenic formulas and those with human milk oligosaccharides, developed through precision fermentation to produce unique bioactive proteins.
- The demand for organic certification and non-gmo ingredients in plant-based proteins is intensifying, but supply chain fragility presents a significant risk, with recalls leading to immediate sales drops of up to 40%. Direct-to-consumer models offer a buffer, but they also require flawless execution to maintain brand equity.
- Companies must invest in resilient sourcing for allergen-free formulations and sustainable packaging solutions to navigate these challenges and support early-life nutrition and the infant gut microbiome.
Exclusive Technavio Analysis on Customer Landscape
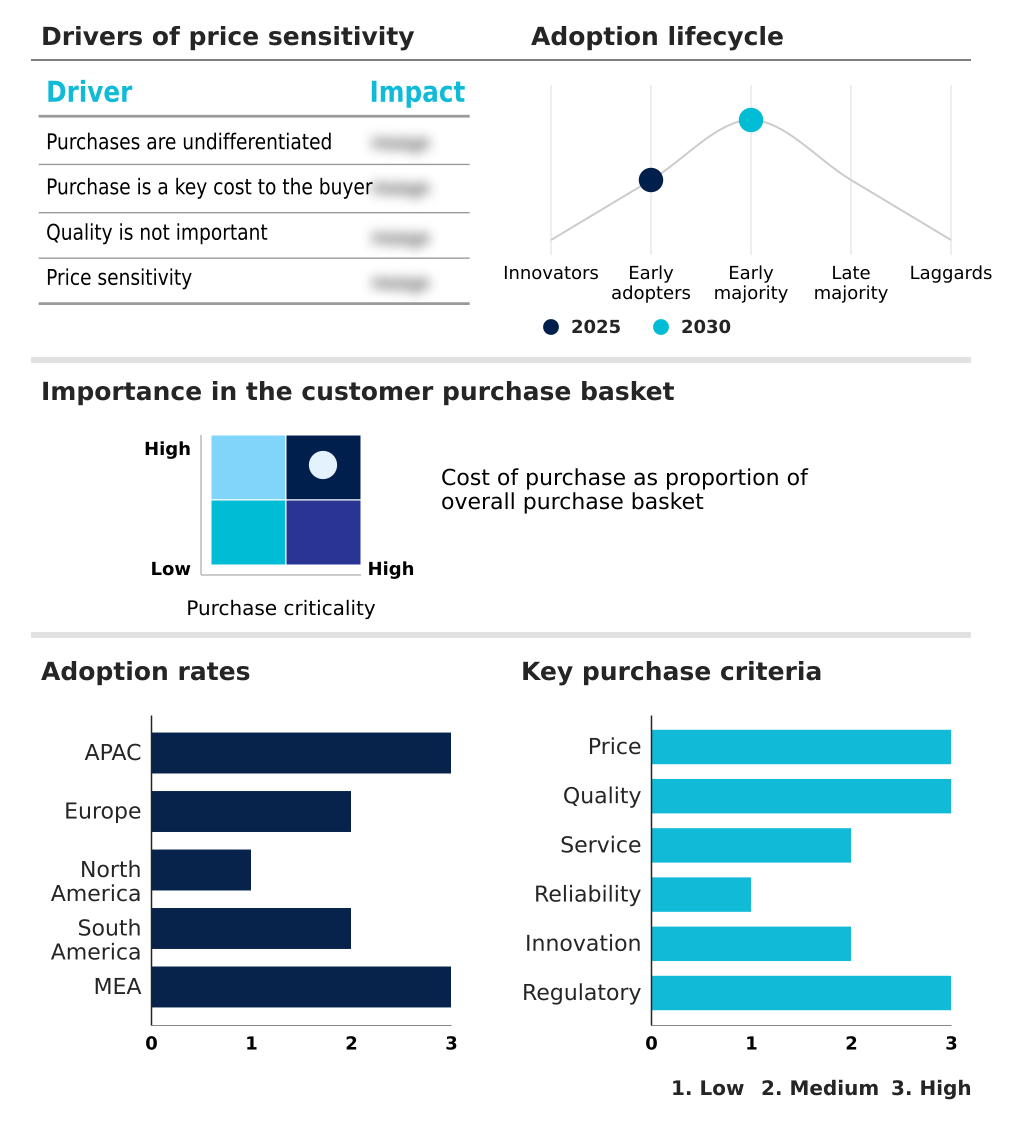
The baby food and infant formula market forecasting report includes the adoption lifecycle of the market, covering from the innovator’s stage to the laggard’s stage. It focuses on adoption rates in different regions based on penetration. Furthermore, the baby food and infant formula market report also includes key purchase criteria and drivers of price sensitivity to help companies evaluate and develop their market growth analysis strategies.
Customer Landscape of Baby Food And Infant Formula Industry
Competitive Landscape
Companies are implementing various strategies, such as strategic alliances, baby food and infant formula market forecast, partnerships, mergers and acquisitions, geographical expansion, and product/service launches, to enhance their presence in the industry.
Abbott Laboratories - Focuses on advanced formulations with prebiotic ingredients and tailored nutrition, designed to support crucial stages of infant development and health.
The industry research and growth report includes detailed analyses of the competitive landscape of the market and information about key companies, including:
- Abbott Laboratories
- Albertsons Companies Inc.
- Ausnutria Dairy Corp. Ltd.
- Danone SA
- Ellas Kitchen Brands Ltd.
- Else Nutrition Holdings Inc.
- Emirates Industry for Milk
- Fonterra Cooperative Group Ltd.
- Groupe Lactalis
- Gujarat Co. Milk Ltd.
- Hero AG
- HiPP GmbH and Co. Vertrieb KG
- Meiji Holdings Co. Ltd.
- Nestle SA
- Plum Organics PBC
- PZ Cussons Plc
- Reckitt Benckiser Group Plc
Qualitative and quantitative analysis of companies has been conducted to help clients understand the wider business environment as well as the strengths and weaknesses of key industry players. Data is qualitatively analyzed to categorize companies as pure play, category-focused, industry-focused, and diversified; it is quantitatively analyzed to categorize companies as dominant, leading, strong, tentative, and weak.
Recent Development and News in Baby food and infant formula market
- In January 2025, the United States Food and Drug Administration released its final guidance on action levels for lead in processed foods for babies, setting strict thresholds for manufacturers.
- In March 2025, the United States Food and Drug Administration launched Operation Stork Speed, a national initiative to modernize infant formula nutrient requirements and enhance supply chain resilience.
- In May 2025, Danone SA completed its acquisition of a majority stake in Kate Farms, a move that significantly bolsters its portfolio of plant-based and organic infant nutrition options.
- In May 2025, the seventy-eighth World Health Assembly approved a resolution to extend the comprehensive implementation plan on maternal and infant nutrition, including new mandates to restrict digital marketing of breast-milk substitutes.
Dive into Technavio’s robust research methodology, blending expert interviews, extensive data synthesis, and validated models for unparalleled Baby Food And Infant Formula Market insights. See full methodology.
| Market Scope | |
|---|---|
| Page number | 294 |
| Base year | 2025 |
| Historic period | 2020-2024 |
| Forecast period | 2026-2030 |
| Growth momentum & CAGR | Accelerate at a CAGR of 7.5% |
| Market growth 2026-2030 | USD 45067.3 million |
| Market structure | Fragmented |
| YoY growth 2025-2026(%) | 7.1% |
| Key countries | China, India, Indonesia, Japan, Australia, South Korea, Germany, UK, France, Italy, Spain, The Netherlands, US, Canada, Mexico, Brazil, Argentina, Chile, Saudi Arabia, UAE, South Africa, Turkey and Egypt |
| Competitive landscape | Leading Companies, Market Positioning of Companies, Competitive Strategies, and Industry Risks |
Research Analyst Overview
- The baby food and infant formula market is undergoing a scientific revolution, moving toward hyper-specialized products. The integration of human milk oligosaccharides and other bioactive proteins is now standard in premium offerings, driven by advanced biotechnology.
- This pursuit of nutritional precision has led to a surge in hypoallergenic formulas and hydrolyzed protein options to meet the needs of infants with specific dietary requirements. A key boardroom decision revolves around investment in precision fermentation to produce novel ingredients, a move that can reduce raw material volatility by up to 30%.
- The market is also bifurcating, with a strong push for both dairy-based innovations like A2 protein variants, goat milk-based formulas, and grass-fed formulas, alongside a rapidly growing category of dairy-free alternatives and sustainable plant-based proteins. Functional fortification and the development of zero-sugar solid cereals reflect a commitment to clean-label transparency.
- From fortified weaning foods and savory-forward complementary foods to convenient ready-to-feed liquids made with ultra-high-temperature processing, innovation is paramount. Ensuring non-gmo ingredients, organic certification, and the absence of heavy metal contaminants through rigorous microbial controls are critical for maintaining brand integrity in this competitive landscape.
What are the Key Data Covered in this Baby Food And Infant Formula Market Research and Growth Report?
-
What is the expected growth of the Baby Food And Infant Formula Market between 2026 and 2030?
-
USD 45.07 billion, at a CAGR of 7.5%
-
-
What segmentation does the market report cover?
-
The report is segmented by Product (Infant formula, and Baby food), Type (Milk formula, Dried baby food, Prepared baby food, and Others), Form Factor (Solid, and Liquid) and Geography (APAC, Europe, North America, South America, Middle East and Africa)
-
-
Which regions are analyzed in the report?
-
APAC, Europe, North America, South America and Middle East and Africa
-
-
What are the key growth drivers and market challenges?
-
Mainstreaming of functional fortification and human milk oligosaccharide (HMO) integration, Regulatory rigor and mandatory reduction of heavy metal contaminants
-
-
Who are the major players in the Baby Food And Infant Formula Market?
-
Abbott Laboratories, Albertsons Companies Inc., Ausnutria Dairy Corp. Ltd., Danone SA, Ellas Kitchen Brands Ltd., Else Nutrition Holdings Inc., Emirates Industry for Milk, Fonterra Cooperative Group Ltd., Groupe Lactalis, Gujarat Co. Milk Ltd., Hero AG, HiPP GmbH and Co. Vertrieb KG, Meiji Holdings Co. Ltd., Nestle SA, Plum Organics PBC, PZ Cussons Plc and Reckitt Benckiser Group Plc
-
Market Research Insights
- The market's dynamics are shaped by evolving consumer priorities and digital transformation. A focus on ingredient provenance and third-party verified safety protocols has become paramount, with companies adopting these measures seeing a 25% lower risk of reputational damage from safety alerts.
- The shift to direct-to-consumer models through digital omni-channel distribution is reshaping retail; these channels are expanding nearly twice as fast as traditional stores. This pivot enables personalized nutrition programs and subscription-based models, which have demonstrated a 15% higher customer retention rate compared to one-off purchases.
- Navigating this landscape requires balancing premium product positioning with effective product recall management and maintaining consumer trust through transparent supply chain traceability.
We can help! Our analysts can customize this baby food and infant formula market research report to meet your requirements.
 RIA -
RIA - 
