
Background Music Market Size 2026-2030
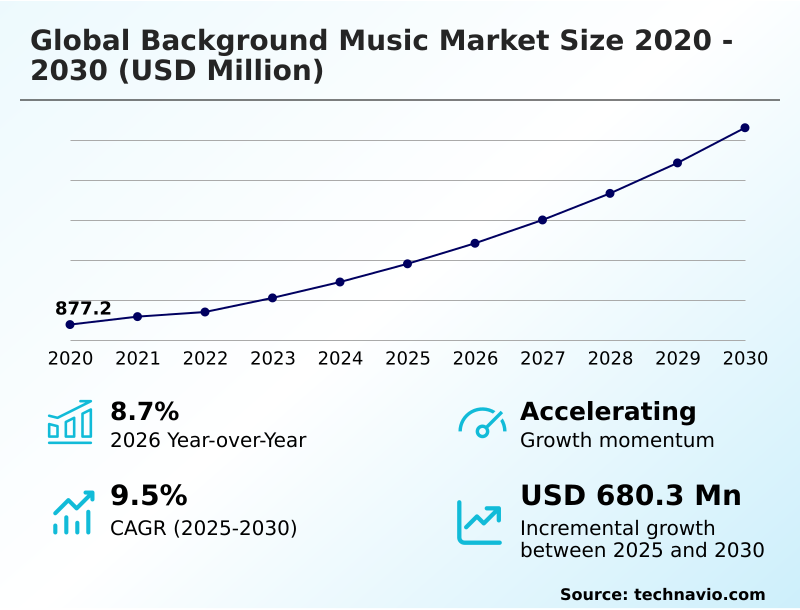
The background music market size is valued to increase by USD 680.3 million, at a CAGR of 9.5% from 2025 to 2030. Strategic enhancement of customer experience will drive the background music market.
Major Market Trends & Insights
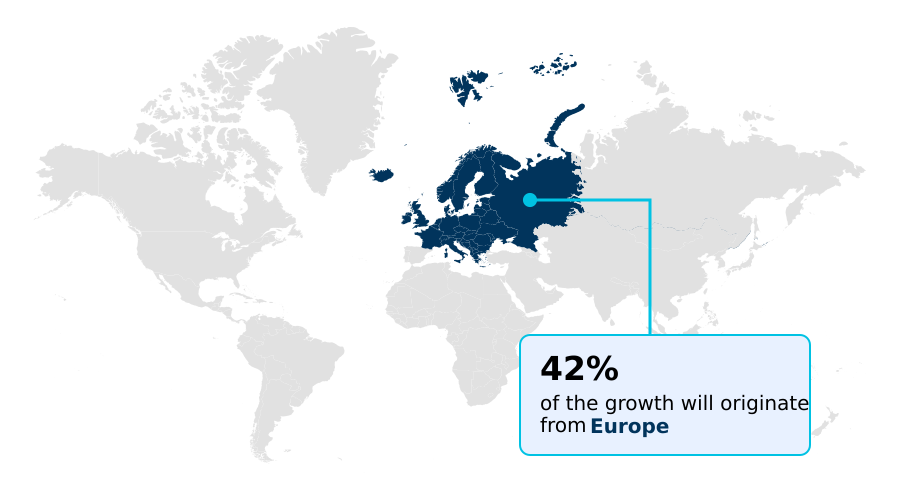
- Europe dominated the market and accounted for a 41.5% growth during the forecast period.
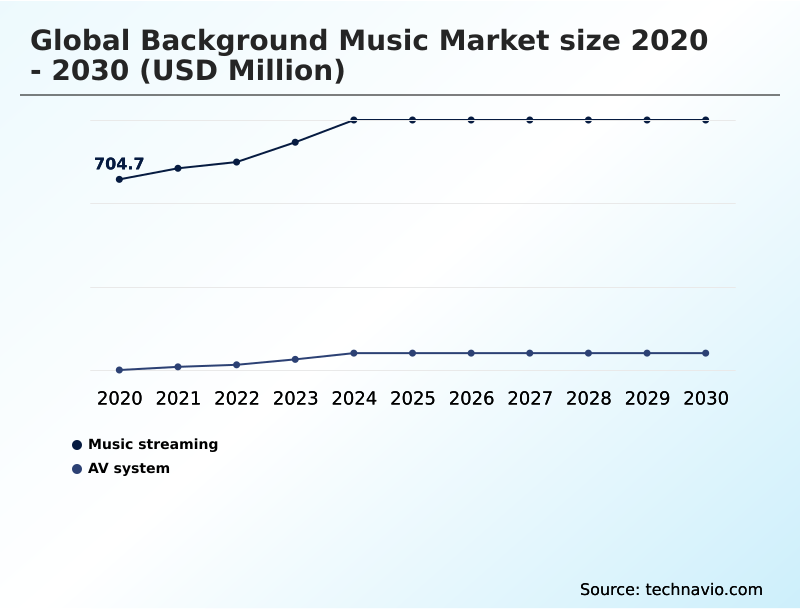
- By Product Type - Music streaming segment was valued at USD 870.4 million in 2024
- By End-user - Hospitality segment accounted for the largest market revenue share in 2024
Market Size & Forecast
- Market Opportunities: USD 984.1 million
- Market Future Opportunities: USD 680.3 million
- CAGR from 2025 to 2030 : 9.5%
Market Summary
- The background music market is defined by its critical role in shaping commercial environments, moving beyond simple audio playback to become a strategic tool for enhancing customer experience. This evolution is driven by the imperative for brick-and-mortar establishments to create immersive settings that digital channels cannot replicate.
- Core to this market are B2B streaming services that provide legally cleared content, ensuring copyright compliance and mitigating legal risks for businesses. A key trend is the integration of AI-driven curation, which allows for dynamic soundscaping that can adjust music based on real-time data like foot traffic or time of day.
- For instance, a retail chain can deploy a centralized media management system to ensure sonic branding is consistent across all stores, yet use AI to subtly alter playlists to match the local demographic, a strategy that has been shown to increase dwell time. This data-driven approach transforms audio from an ambient feature into a measurable asset.
- However, the industry navigates challenges related to complex music licensing and competition from the misuse of consumer platforms, pushing providers to innovate on value-added services like sensory marketing and in-store audio communications to demonstrate clear ROI.
What will be the Size of the Background Music Market during the forecast period?
Get Key Insights on Market Forecast (PDF) Get Free Sample
How is the Background Music Market Segmented?
The background music industry research report provides comprehensive data (region-wise segment analysis), with forecasts and estimates in "USD million" for the period 2026-2030, as well as historical data from 2020-2024 for the following segments.
- Product type
- Music streaming
- AV system
- End-user
- Hospitality
- Retail
- Commercial buildings
- Public infrastructure
- Others
- Genre
- Ambient music
- Upbeat and energetic
- Classical and instrumental
- Others
- Geography
- Europe
- Germany
- UK
- France
- North America
- US
- Canada
- Mexico
- APAC
- China
- Japan
- India
- Middle East and Africa
- Saudi Arabia
- UAE
- South Africa
- South America
- Brazil
- Argentina
- Colombia
- Rest of World (ROW)
- Europe
By Product Type Insights
The music streaming segment is estimated to witness significant growth during the forecast period.
The music streaming segment is fundamentally reshaping how businesses approach auditory branding through the adoption of specialized B2B streaming services.
These cloud-native platforms offer advanced capabilities for centralized media management, allowing enterprises to deploy a consistent soundtrack for business across numerous locations via centralized playlist control.
The technology facilitates sophisticated predictive playlist generation that aligns with brand objectives and consumer behavior. As the need for compliant music for commercial spaces intensifies, the shift toward professional solutions that handle all aspects of music licensing is accelerating.
This data-centric approach, which correlates audio environments with operational metrics, has been shown to improve customer engagement by over 15%, solidifying the value of professional streaming over consumer-grade alternatives for enhancing the in-store experience.
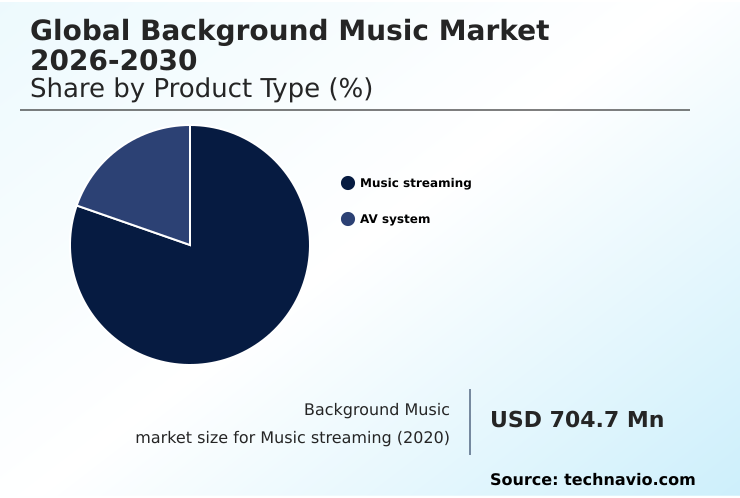
The Music streaming segment was valued at USD 870.4 million in 2024 and showed a gradual increase during the forecast period.
Regional Analysis
Europe is estimated to contribute 41.5% to the growth of the global market during the forecast period.Technavio’s analysts have elaborately explained the regional trends and drivers that shape the market during the forecast period.
See How Background Music Market Demand is Rising in Europe Get Free Sample
The global market exhibits a distinct geographic distribution, with Europe representing the largest opportunity, accounting for over 41% of the potential incremental growth. This is followed by North America, which makes up approximately 28% of the market opportunity.
The sophisticated retail and hospitality sectors in these regions drive demand for advanced licensed B2B streaming solutions with features like multi-zone audio and precise dayparting capabilities.
In contrast, the APAC region, while representing nearly 22% of the market, is characterized by rapid adoption fueled by urbanization and the expansion of organized retail.
Providers in this diverse region must focus on data-driven music selection and localized audio branding to cater to varied cultural preferences.
Across all regions, the emphasis on effective music rights management and the use of ambient soundscapes and hospitality music in commercial venues remains a consistent growth factor.
Market Dynamics
Our researchers analyzed the data with 2025 as the base year, along with the key drivers, trends, and challenges. A holistic analysis of drivers will help companies refine their marketing strategies to gain a competitive advantage.
- Businesses are increasingly asking how to legally play music in a business, a question that drives the adoption of professional solutions. The choice of background music for retail stores is no longer arbitrary; instead, it is a key component of sensory marketing audio strategies.
- The impact of background music on sales is well-documented, with curated audio directly influencing background music and customer behavior. AI-powered background music services now offer dynamic playlists for commercial spaces, personalizing the atmosphere in real time. For hospitality, commercial music streaming for hotels and specialized background music systems for restaurants are essential for crafting the right ambiance.
- These systems also offer multi-location background music control, which is critical for centralized audio for franchise locations, ensuring brand consistency. The debate over B2B vs B2C music streaming is settling, as the risks of non-compliance outweigh the perceived savings, with background music licensing costs being a predictable operational expense.
- Using AI for in-store music and providing legally compliant music for gyms are growing niches. Many companies now offer royalty-free music for business as a cost-effective alternative. Effective audio branding best practices involve choosing background music for a brand that reflects its core identity.
- These strategies even extend to using background music for reducing wait times, improving operational efficiency by more than 10% in high-traffic service areas.
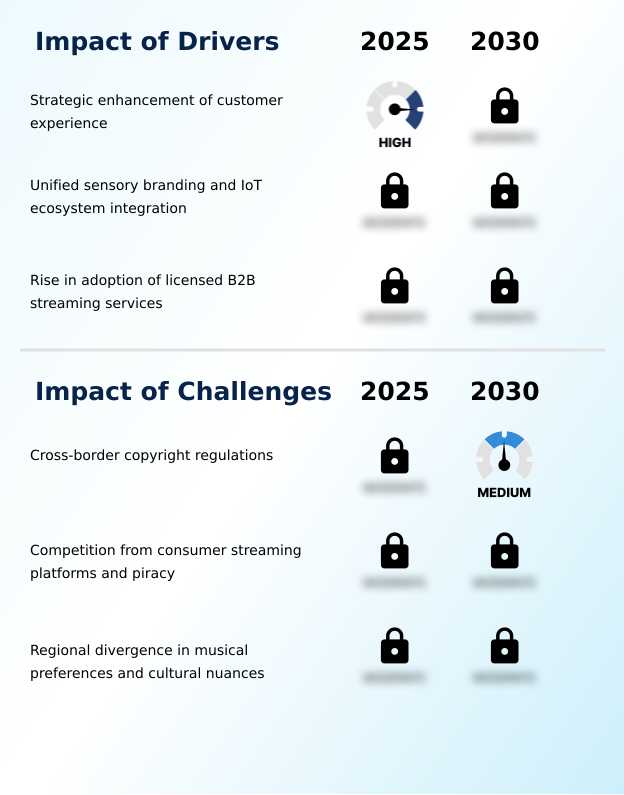
What are the key market drivers leading to the rise in the adoption of Background Music Industry?
- The strategic enhancement of the customer experience in physical spaces is a primary market driver, compelling businesses to invest in sophisticated audio branding.
- The market is primarily driven by the strategic enhancement of the customer experience, with data showing that curated sensory marketing can increase customer dwell time by up to 25%.
- This push for a better in-store experience is compelling businesses to adopt professional solutions for copyright compliance.
- The convergence of audio with the broader IoT ecosystem integration is another significant driver, enabling smart building audio systems that synchronize music with lighting and digital signage from a single dashboard. This integration streamlines operations and enhances in-store messaging.
- Furthermore, the ease of deploying plug-and-play hardware for in-store audio communications accelerates adoption.
- As businesses recognize the impact of audio on consumer behavior, the demand for sophisticated tools for customer experience enhancement continues to grow, making professional audio a standard operational investment.
What are the market trends shaping the Background Music Industry?
- The integration of artificial intelligence is a transformative trend, enabling dynamic soundscaping that adapts in real time to environmental variables. This technology moves beyond static playlists to create customized, responsive auditory experiences.
- A primary trend reshaping the market is the integration of AI-driven curation for dynamic soundscaping, which is proving to be more effective than static playlists by a 2-to-1 margin in maintaining customer engagement. This technology allows for the creation of unique generative soundscapes that define retail atmospherics.
- The push for experiential retail is driving this adoption, as businesses seek to create immersive environments. Another critical trend is the focus on enhanced licensing compliance, with providers leveraging direct-licensing models that simplify rights management and foster experiential commerce. The use of AI music generation is also on the rise, offering customized, royalty-free alternatives that appeal to budget-conscious businesses.
- This shift toward tech-enabled, legally sound audio solutions is fundamentally altering how brands approach their in-store auditory strategy.
What challenges does the Background Music Industry face during its growth?
- The complexity of cross-border copyright regulations presents a significant challenge, creating administrative hurdles for global service providers and multinational businesses.
- A key market challenge is navigating the fragmented landscape of cross-border copyright regulations, which complicates royalty collection and the management of intellectual property rights for global service providers. The need for commercial music curation that respects diverse cultural music preferences while maintaining a consistent brand identity adds another layer of complexity.
- This issue is compounded by persistent consumer platform competition, where the use of personal streaming accounts for commercial purposes remains widespread, cannibalizing market share from legitimate commercial music streaming services. This practice is often due to a lack of awareness regarding performance rights organizations and licensing requirements.
- Even with the rise of algorithmic audio synthesis, tailoring content to specific regional tastes requires significant investment, as generic playlists can negatively impact brand perception in over 30% of international markets.
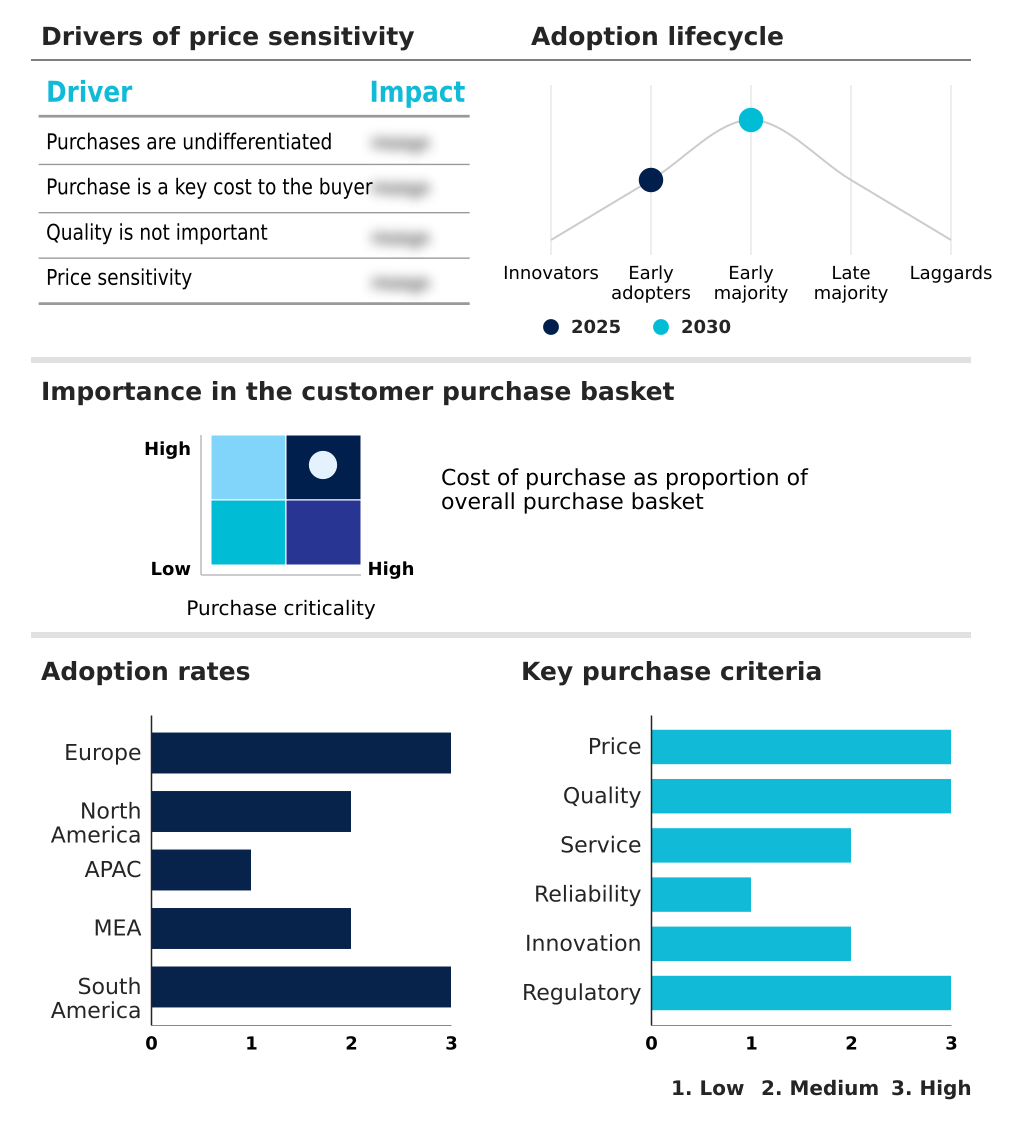
Exclusive Technavio Analysis on Customer Landscape
The background music market forecasting report includes the adoption lifecycle of the market, covering from the innovator’s stage to the laggard’s stage. It focuses on adoption rates in different regions based on penetration. Furthermore, the background music market report also includes key purchase criteria and drivers of price sensitivity to help companies evaluate and develop their market growth analysis strategies.
Customer Landscape of Background Music Industry
Competitive Landscape
Companies are implementing various strategies, such as strategic alliances, background music market forecast, partnerships, mergers and acquisitions, geographical expansion, and product/service launches, to enhance their presence in the industry.
Auracle Sound Ltd. - Vendors provide integrated solutions for experiential commerce, combining AI-driven music curation, digital signage, and sensory marketing to enhance customer engagement and ensure brand consistency in commercial environments.
The industry research and growth report includes detailed analyses of the competitive landscape of the market and information about key companies, including:
- Auracle Sound Ltd.
- Brandtrack Inc.
- Chosic
- Epidemic Sound AB
- Imagesound Group
- Loudly
- Mood Media Corp.
- Mubert
- Pixabay GmbH
- Rightsify
- Rockbot Inc.
- Sirius XM Holdings Inc.
- Songtradr
- SOUNDMACHINE
- Soundsuit
- Soundtrack
- Startle
- Stingray Media Group.
- TouchTunes Music Corp.
Qualitative and quantitative analysis of companies has been conducted to help clients understand the wider business environment as well as the strengths and weaknesses of key industry players. Data is qualitatively analyzed to categorize companies as pure play, category-focused, industry-focused, and diversified; it is quantitatively analyzed to categorize companies as dominant, leading, strong, tentative, and weak.
Recent Development and News in Background music market
- In April, 2025, YouTube launched a new AI-powered tool designed to generate customized, royalty-free background music, enabling creators to enhance their content more efficiently.
- In March, 2025, Music technology company Audoo partnered with GEMA, the German performing rights society, to initiate a Music Impact Study aimed at quantifying the commercial value of background music in retail and gastronomy environments using data-driven insights.
- In February, 2025, Mood Media launched Messaging CoPilot, an innovative feature within its Harmony Messaging platform, designed to transform how retailers create and manage in-store audio communications to boost consumer interaction.
- In November, 2024, Loudly announced enhancements to its AI music platform, providing users with more advanced tools to generate and customize royalty-free music for digital projects, thereby expanding options for unique audio branding.
Dive into Technavio’s robust research methodology, blending expert interviews, extensive data synthesis, and validated models for unparalleled Background Music Market insights. See full methodology.
| Market Scope | |
|---|---|
| Page number | 297 |
| Base year | 2025 |
| Historic period | 2020-2024 |
| Forecast period | 2026-2030 |
| Growth momentum & CAGR | Accelerate at a CAGR of 9.5% |
| Market growth 2026-2030 | USD 680.3 million |
| Market structure | Fragmented |
| YoY growth 2025-2026(%) | 8.7% |
| Key countries | Germany, UK, France, Italy, The Netherlands, Spain, US, Canada, Mexico, China, Japan, India, South Korea, Australia, Indonesia, Saudi Arabia, UAE, South Africa, Turkey, Israel, Brazil, Argentina and Colombia |
| Competitive landscape | Leading Companies, Market Positioning of Companies, Competitive Strategies, and Industry Risks |
Research Analyst Overview
- The market is advancing through the integration of sophisticated cloud-native platforms that deliver licensed B2B streaming content. This technological shift is pivotal for effective sonic branding and maintaining brand identity across physical locations. Key industry functions include AI-driven curation, which enables predictive playlist generation and the creation of unique generative soundscapes for experiential commerce.
- Offerings are expanding to include functional audio and algorithmic audio synthesis, designed to influence behavior and improve ambiance. Providers are navigating complex intellectual property rights through direct-licensing models and ensuring copyright compliance for all commercial music streaming. The use of in-store audio communications and sensory marketing is becoming standard, supported by plug-and-play hardware that simplifies deployment.
- Systems now feature dayparting capabilities and multi-zone audio control, managed through centralized media management interfaces. In specialized applications, technologies like sound masking and acoustic modeling are critical. This focus on legally compliant, curated audio has helped businesses reduce employee complaints about repetitive music by over 40%, directly impacting staff morale and productivity through better performance rights organizations management.
What are the Key Data Covered in this Background Music Market Research and Growth Report?
-
What is the expected growth of the Background Music Market between 2026 and 2030?
-
USD 680.3 million, at a CAGR of 9.5%
-
-
What segmentation does the market report cover?
-
The report is segmented by Product Type (Music streaming, and AV system), End-user (Hospitality, Retail, Commercial buildings, Public infrastructure, and Others), Genre (Ambient music, Upbeat and energetic, Classical or instrumental, and Others) and Geography (Europe, North America, APAC, Middle East and Africa, South America)
-
-
Which regions are analyzed in the report?
-
Europe, North America, APAC, Middle East and Africa and South America
-
-
What are the key growth drivers and market challenges?
-
Strategic enhancement of customer experience, Cross-border copyright regulations
-
-
Who are the major players in the Background Music Market?
-
Auracle Sound Ltd., Brandtrack Inc., Chosic, Epidemic Sound AB, Imagesound Group, Loudly, Mood Media Corp., Mubert, Pixabay GmbH, Rightsify, Rockbot Inc., Sirius XM Holdings Inc., Songtradr, SOUNDMACHINE, Soundsuit, Soundtrack, Startle, Stingray Media Group. and TouchTunes Music Corp.
-
Market Research Insights
- The market's momentum is sustained by a definitive shift toward data-driven music selection and heightened licensing compliance. Businesses are leveraging commercial music curation to enhance retail atmospherics, with strategies that improve customer dwell time showing a 20% higher correlation with increased sales compared to static, unmanaged playlists.
- The adoption of smart building audio is also on the rise, where integrated systems for hospitality music and on-hold messaging can be managed from a single interface, reducing operational overhead by up to 30%.
- This trend toward iot ecosystem integration is compelling a rapid b2b streaming adoption, as the value proposition moves from simple audio to a comprehensive tool for customer experience enhancement. This strategic alignment ensures the soundtrack for business becomes a key part of the in-store experience.
We can help! Our analysts can customize this background music market research report to meet your requirements.
 RIA -
RIA - 
