
Visual Content Market Size 2025-2029
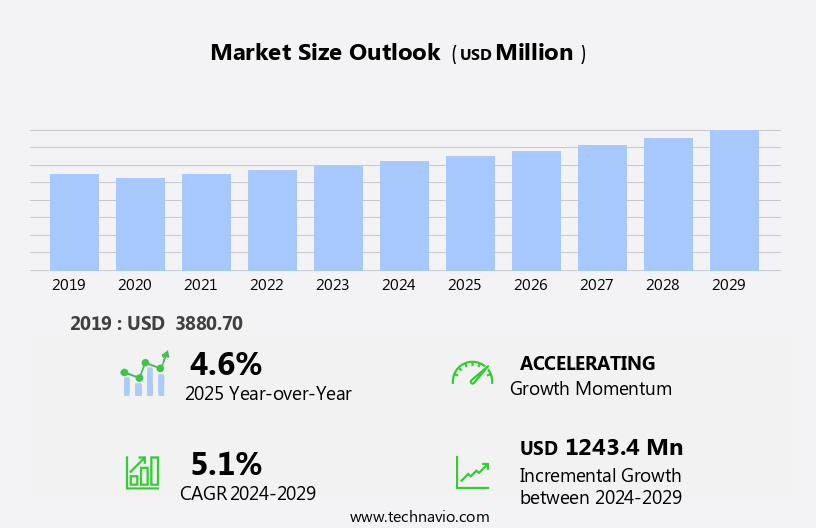
The visual content market size is forecast to increase by USD 1.24 billion at a CAGR of 5.1% between 2024 and 2029.
- The market, encompassing digital stock images and software-generated graphics, continues to experience significant growth In the US. Key drivers include the increasing demand for digital content in various sectors such as real estate, education, and digital marketing. A catalyst for this growth is the rising preference for visuals like 360-degree images and videos. However, the market faces challenges, including limited online video consumption due to slow internet speeds. As digital marketing becomes more prevalent, the need for high-quality, visually engaging content is increasingly important. This trend is expected to continue, with advancements in technology further enhancing the potential of visual content to captivate audiences and drive engagement.
What will be the Size of the Visual Content Market During the Forecast Period?
- The market continues to expand as businesses recognize the power of engaging, shareable content to capture audience attention and drive performance. The human brain processes visual information 60,000 times faster than text, making infographics, videos, photos, and interactive visuals effective tools for conveying complex information and boosting brand awareness. For example, a brand may include a CTA in an infographic, inviting users to sign up for a newsletter or download an e-book. Visual content drives ROI through increased traffic, backlinks, and calls to action.
- Platforms and others provide businesses with a range of image-based and interactive content solutions. As the market evolves, expect to see a continued focus on creating high-quality, shareable visuals that resonate with audiences and deliver measurable results. Visual capitalists are leveraging a variety of formats, including pictures, diagrams, charts, online videos, slide decks, native video, and ultimate guides, to present complex data and insights in an engaging and accessible way.
How is this Visual Content Industry segmented and which is the largest segment?
The industry research report provides comprehensive data (region-wise segment analysis), with forecasts and estimates in "USD billion" for the period 2025-2029, as well as historical data from 2019-2023 for the following segments.
- Product
- Stock images
- Stock video
- Application
- Editorial
- Commercial
- License Model
- RF
- RM
- End-user
- Media and entertainment
- Advertising
- Corporate
- Others
- Geography
- North America
- Canada
- US
- Europe
- Germany
- UK
- France
- Italy
- APAC
- China
- India
- Japan
- Middle East and Africa
- South America
- North America
By Product Insights
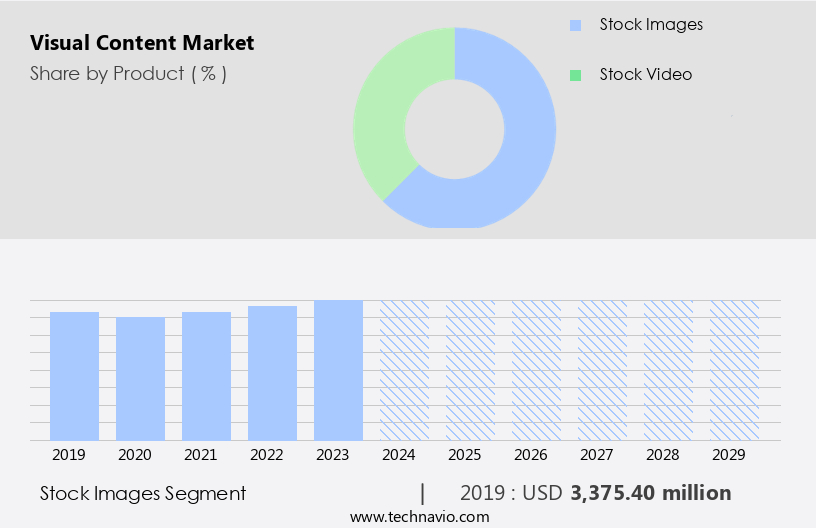
- The stock images segment is estimated to witness significant growth during the forecast period.
The market experienced significant growth in 2024, with stock images leading the segment. The proliferation of digital photography, driven by the easy accessibility and affordability of digital single-lens reflex (DSLR) cameras, has contributed to market expansion. Notably, there has been an increasing trend of collaborations among companies, enabling them to broaden their offerings, reach larger audiences, and enhance customer value. The market exhibits minimal price differentiation based on picture resolution due to the transition to mobile and online platforms. The demand for responsive web design has fueled the need for high-quality, small images, leading to advancements in image resolution technology. Visual content encompasses various formats, including infographics, videos, YouTube, Hubspot, and social media, among others.
Get a glance at the Visual Content Industry report of share of various segments Request Free Sample
The stock images segment was valued at USD 3.38 billion in 2019 and showed a gradual increase during the forecast period.
Regional Analysis
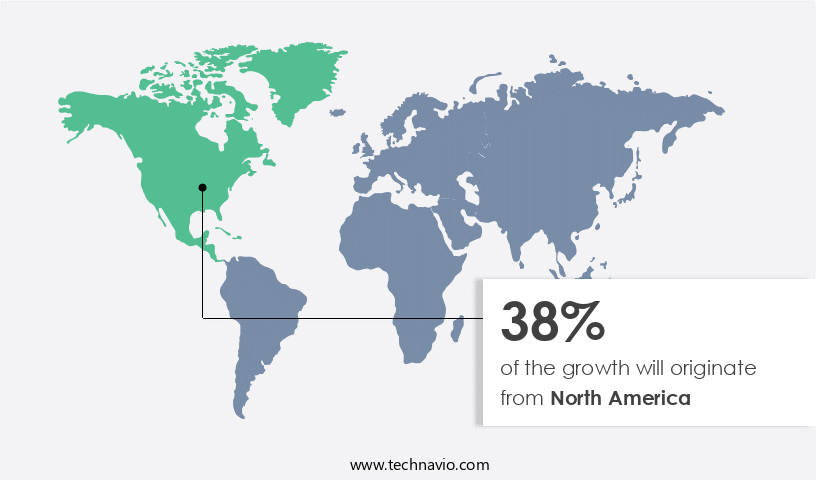
- North America is estimated to contribute 38% to the growth of the global market during the forecast period.
Technavio's analysts have elaborately explained the regional trends and drivers that shape the market during the forecast period.
For more insights on the market share of various regions, Request Free Sample
The North American market holds the largest share In the global visual content industry. The US is the primary contributor to this market's growth due to the increasing demand for video content among commercial consumers. Factors such as enhanced broadband penetration and faster internet speeds facilitate smoother video consumption. Furthermore, the proliferation of social media platforms like Facebook and Instagram In the US fuels market expansion. Visual content encompasses various formats, including infographics, videos, YouTube, Hubspot, and interactive visuals. These elements play a crucial role in brand awareness and social media engagement. For instance, infographics generate 3x more backlinks and 2x more social shares than other types of content.
Market Dynamics
Our researchers analyzed the data with 2024 as the base year, along with the key drivers, trends, and challenges. A holistic analysis of drivers will help companies refine their marketing strategies to gain a competitive advantage.
What are the key market drivers leading to the rise In the adoption of Visual Content Industry?
Growing digital marketing is the key driver of the market.
- The market has experienced significant growth due to the increasing trend of digital marketing. With a larger audience engaging in digital platforms, businesses have recognized the potential of using visual content for marketing and promotion. Images and videos are essential tools for businesses to enhance customer engagement, boost brand awareness, and reach potential customers.
- Social media networks have evolved to prioritize visual content, with various platforms leading the way. Studies show that visual content generates more social shares and backlinks than text-based content, resulting in increased traffic and link-building opportunities. Furthermore, visual marketing formats such as infographics, slideshows, interactive visuals, and data visualizations have become popular due to their ability to effectively convey complex information in an engaging and easily digestible manner.
What are the market trends shaping the Visual Content Industry?
Demand for 360-degree images and videos is the upcoming market trend.
- The market is experiencing significant growth due to the increasing preference for engaging and interactive content. According to recent statistics, visuals account for 93% of human communication, making them an essential tool for businesses to connect with their audience. Marketers are leveraging various forms of visual content, including infographics, videos, and still images, to enhance brand awareness. Infographics, GIFs, memes, screenshots, illustrations, data visualizations, slideshows, and interactive visuals are other forms of visual content that businesses use to capture their audience's attention.
- Players in the market offer a range of visual content, including stock photos, 360-degree images and videos, and design tools like Photoshop. The trend toward 360-degree visuals is particularly noteworthy, with marketers using them to showcase products, promote destinations, and share experiences. Getty Images, for example, provides over 12,000 premium 360-degree images, with new content added daily. Visual marketing strategies that include calls-to-action, backlinks, social shares, traffic, and link-building have proven effective in driving ROI. Platforms help businesses track the performance of their visual content and identify trends. Ultimately, visual content is an essential component of a successful marketing strategy, with benefits ranging from increased social media engagement to improved brand awareness.
What challenges does the Visual Content Industry face during its growth?
Digital online video consumption limited by Internet speeds is a key challenge affecting the industry growth.
- The human brain processes visual content 60,000 times faster than text, making visual marketing a powerful tool for businesses. Visual content also drives through backlinks and social shares, leading to increased traffic. Platforms leverage this trend, creating a market for image-based content.
- Tools like Photoshop and Infographic guest posts further facilitate the creation and distribution of visual content. Despite slower internet speeds in some areas, the consumption of visual content, particularly videos, is on the rise. With improvements in network technology, this trend is expected to continue, leading to increased video traffic and ROI for businesses.
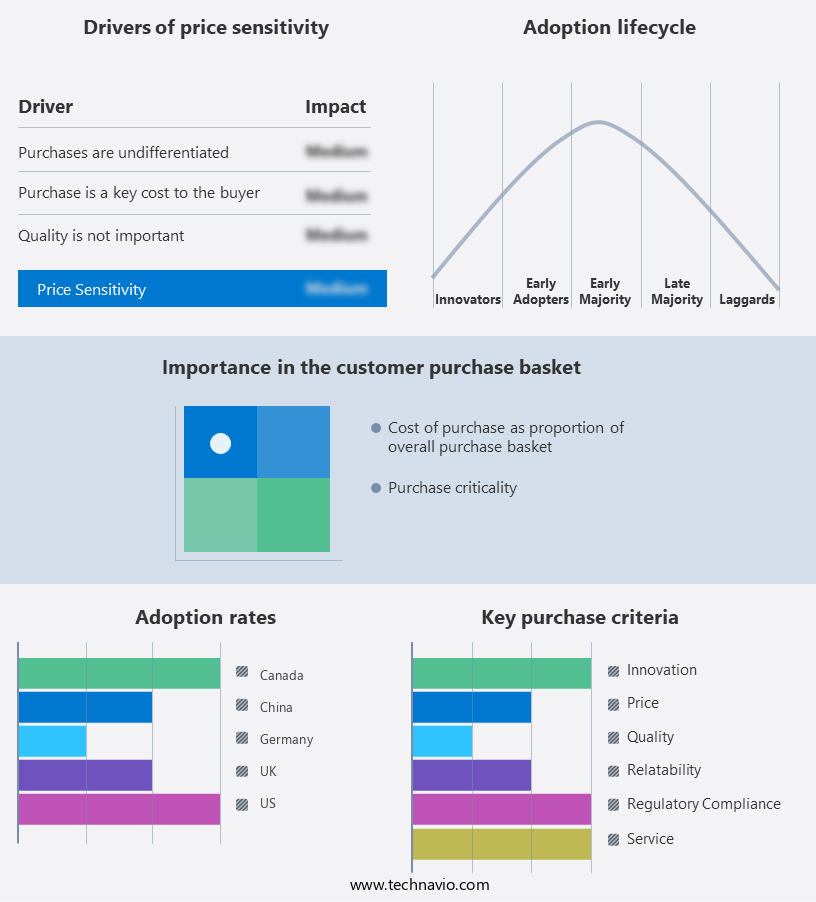
Exclusive Customer Landscape
The market forecasting report includes the adoption lifecycle of the market, covering from the innovator's stage to the laggard's stage. It focuses on adoption rates in different regions based on penetration. Furthermore, the market report also includes key purchase criteria and drivers of price sensitivity to help companies evaluate and develop their market growth analysis strategies.
Customer Landscape
Key Companies & Market Insights
Companies are implementing various strategies, such as strategic alliances, market forecast, partnerships, mergers and acquisitions, geographical expansion, and product/service launches, to enhance their presence In the industry.
Adobe Inc. - The company specializes in providing visual content solutions, encompassing a range of graphic design tools including Adobe Photoshop and Illustrator, enabling users to create and modify images and illustrations.
The industry research and growth report includes detailed analyses of the competitive landscape of the market and information about key companies, including:
- Adobe Inc.
- Animaker Inc
- Biteable
- Buildscale Inc.
- Canva Pty Ltd.
- Crello Ltd.
- Fotor
- Getty Images Holdings Inc.
- Infogram
- Kapwing
- Lumen5
- Pixlr
- Powtoon Inc
- Rendeforest
- Shutterstock Inc.
- Stencil
- Venngage Inc
- Visually Inc.
- wec360 AB
- Wondershare Technology Co. Ltd.
Qualitative and quantitative analysis of companies has been conducted to help clients understand the wider business environment as well as the strengths and weaknesses of key industry players. Data is qualitatively analyzed to categorize companies as pure play, category-focused, industry-focused, and diversified; it is quantitatively analyzed to categorize companies as dominant, leading, strong, tentative, and weak.
Research Analyst Overview
The market continues to evolve as businesses recognize the power of engaging and informative visuals in capturing audience attention and driving brand awareness. With the human brain processing visual information 60,000 times faster than text, it is no wonder that it has become a crucial component of effective marketing strategies. Infographics, videos, and other forms of visual content have gained significant traction in recent years. Moreover, a correlation exists between internet speeds and video streaming, with faster connections resulting in higher viewership. This is particularly effective on social media platforms, where it can generate high levels of engagement and shares.
Furthermore, it comes in various forms, including stock photos, gifs, memes, screenshots, illustrations, data visualizations, slideshows, interactive visuals, television, and software. Each type has its unique advantages and applications. For instance, data visualizations are particularly effective in making complex data easier to understand, while interactive visuals allow users to engage with the content more creatively. Calls-to-action (CTAs) are an essential component, as they help to convert viewers into customers. A well-designed CTA can increase conversion rates significantly. The Human Food Bar, for example, uses visually appealing CTAs to encourage users to sign up for their meal delivery service.
|
Market Scope |
|
|
Report Coverage |
Details |
|
Page number |
229 |
|
Base year |
2024 |
|
Historic period |
2019-2023 |
|
Forecast period |
2025-2029 |
|
Growth momentum & CAGR |
Accelerate at a CAGR of 5.1% |
|
Market Growth 2025-2029 |
USD 1.24 billion |
|
Market structure |
Fragmented |
|
YoY growth 2024-2025(%) |
4.6 |
|
Key countries |
US, Canada, UK, Germany, France, India, China, Japan, The Netherlands, and Italy |
|
Competitive landscape |
Leading Companies, Market Positioning of Companies, Competitive Strategies, and Industry Risks |
What are the Key Data Covered in this Market Research and Growth Report?
- CAGR of the industry during the forecast period
- Detailed information on factors that will drive the market growth and forecasting between 2025 and 2029
- Precise estimation of the size of the market and its contribution of the industry in focus to the parent market
- Accurate predictions about upcoming growth and trends and changes in consumer behaviour
- Growth of the market across North America, Europe, APAC, Middle East and Africa, and South America
- Thorough analysis of the market's competitive landscape and detailed information about companies
- Comprehensive analysis of factors that will challenge the market growth of industry companies
We can help! Our analysts can customize this market research report to meet your requirements.
 RIA -
RIA - 
