Bag Filter Market Analysis North America, Europe, APAC, South America, Middle East and Africa - US, China, India, UK, Germany - Size and Forecast 2024-2028

Bag Filter Market Analysis North America, Europe, APAC, South America, Middle East and Africa - US, China, India, UK, Germany - Size and Forecast 2024-2028

Published: Aug 2024 160 Pages SKU: IRTNTR74401

Market Overview at a Glance

$1.25 B
Market Opportunity
4.5%
CAGR
4.23
YoY growth 2023-2024(%)

Bag Filter Market Size 2024-2028 

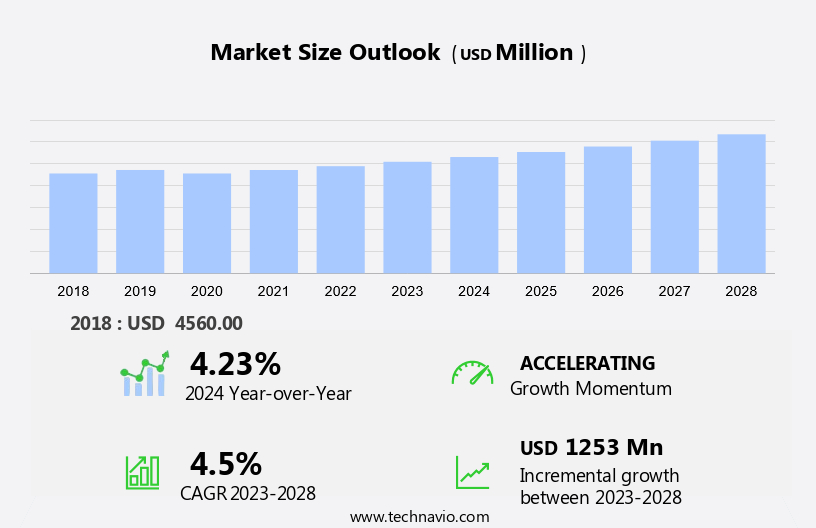
The bag filter market size is forecast to increase by USD 1.25 billion at a CAGR of 4.5% between 2023 and 2028.

  • The market is witnessing significant growth due to the increasing number of mining operations and the need for effective air pollution control. Mining activities generate large amounts of particulate matter and other pollutants, necessitating the use of cleaner production technologies such as bag filters. These filters are available in various materials, including nylon, polyester, and polypropylene, each offering unique benefits in terms of filtration efficiency and durability. Sustainable practices are also gaining importance in the market, with companies focusing on reducing their carbon footprint and minimizing waste. Bag filters contribute to this effort by enabling the reuse of filter media and reducing the need for frequent replacement. Additionally, the development of high-efficiency filters is driving market growth, as these filters offer improved filtration performance and longer service life. However, the slow implementation of pollution control reforms in some regions poses a challenge to market growth. Despite these challenges, the market is expected to continue its expansion, driven by the increasing demand for cleaner air and stricter emission regulations. Companies in the market are focusing on innovation and collaboration to meet the evolving needs of their customers and stay competitive in the market.

What will be the Size of the Market During the Forecast Period?

Bag Filter Market Size

 Request Free Sample

  • The market plays a crucial role in mitigating industrial emissions and ensuring improved air quality. These filters are extensively used in various industries, including cement, to control dust and contaminants from fluid streams and gases. Industrial activities, such as construction projects, generate significant amounts of dust and other pollutants. Bag filters, with their large surface area and efficient filtration capabilities, help minimize the release of these contaminants into the environment. The Clean Air Act and Air Quality Directive are regulatory frameworks that prioritize the importance of implementing effective pollution control programs to reduce industrial emissions.
  • In addition, bag filters come in various forms, including cartridges, cloth filter tubes, envelopes, sediment filters, and microfiltration systems. Cartridge filters, for instance, are suitable for handling high viscosity liquids, while microfiltration systems excel at removing even the smallest particles from gases. The pulse jet segment and nonwoven segment are two significant categories within the market. Pulse jet filters use compressed air to clean the filter media, making them ideal for applications involving high-volume, low-pressure dust streams. Nonwoven filters, on the other hand, feature a uniform, web-like structure that ensures consistent filtration performance and easy replacement. Bag filters are essential in various industries, including cement, to meet stringent air quality regulations.

How is this market segmented and which is the largest segment?

The market research report provides comprehensive data (region-wise segment analysis), with forecasts and estimates in "USD billion" for the period 2024-2028, as well as historical data from 2018-2022 for the following segments.
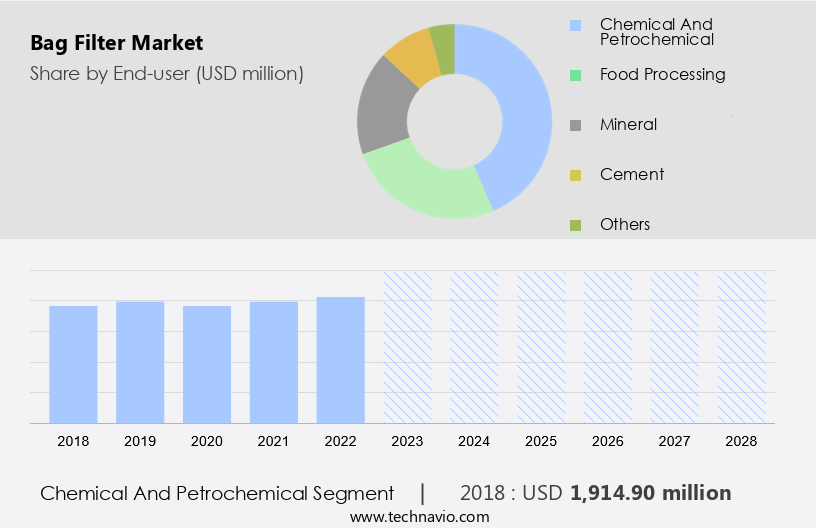
  • End-user
    • Chemical and petrochemical
    • Food processing
    • Mineral
    • Cement
    • Others
  • Product Type
    • Pulse jet
    • Reverse air
    • Shaker
  • Geography
    • North America
      • US
    • Europe
      • Germany
      • UK
    • APAC
      • China
      • India
    • South America
    • Middle East and Africa

By End-user Insights

  • The chemical and petrochemical segment is estimated to witness significant growth during the forecast period.

Pulse jet bag filters are a critical component in ensuring compliance with environmental regulations such as the Clean Air Act and the Air Quality Directive. These filters play a significant role in pollution control programs by effectively capturing particulate matter from various industries, including those relying on renewable energy sources like hydro power, wind power, and nuclear power. The filtration process begins with individual bags, which are secured to a cell plate at the top of the baghouse using a metal cage. Polluted gas enters the baghouse from the bottom and flows through the outside of the bags. The metal cage prevents the bags from collapsing during the filtration process.

Bag Filter Market Size

Get a glance at the market report of share of various segments Request Free Sample

The chemical and petrochemical segment was valued at USD 1.91 billion in 2018 and showed a gradual increase during the forecast period.

Regional Analysis

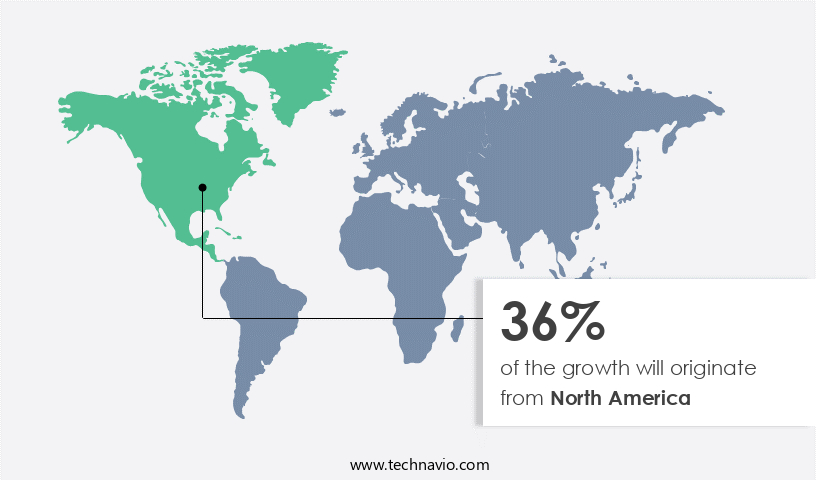
  • North America is estimated to contribute 36% to the growth of the global market during the forecast period.

Technavio's analysts have elaborately explained the regional trends and drivers that shape the market during the forecast period.

Bag Filter Market Share by Geography

For more insights on the market share of various regions Request Free Sample

Market Dynamics

Our researchers analyzed the data with 2023 as the base year, along with the key drivers, trends, and challenges. A holistic analysis of drivers will help companies refine their marketing strategies to gain a competitive advantage.

What are the key market drivers leading to the rise in adoption of Bag Filter Market?

Rise in number of stringent emission control regulations is the key driver of the market.

  • In response to the growing concern over industrial emissions, which contain harmful gases like CO2 and particulate matter, governments worldwide have implemented stringent regulations to minimize pollution and safeguard public health and the environment. The Paris Agreement, an international accord, mandates companies emitting greenhouse gases (GHGs) to pay taxes on their emissions, referred to as carbon prices. By 2040, these carbon prices are projected to reach USD90-USD100 per metric ton of CO2 emitted.
  • Moreover, monitoring systems play a crucial role in ensuring compliance with these regulations. Various filter media, such as nanofiber, woven, and non-woven, are employed in filtration systems like Pulse Jet, Shaker, Reverse Air, and Bag Filters, to capture and remove pollutants from industrial emissions.

What are the market trends shaping the Bag Filter Market?

Development of high-efficiency filters is the upcoming trend in the market.

  • In the Power Generation industry, the effective functioning of a baghouse filtration system relies heavily on choosing the right filter elements and system settings. Prolonged filtration cycles and the need for frequent cleaning of filter components significantly influence the overall lifespan of a bag filter. Freudenberg Filtration Technologies provides filter solutions that boast extended service life and save space and costs, depending on the application.
  • For example, sinTexx Plus is a corrugated polyester filter media with a nanofiber layer that excels at removing fine dust generated during welding, cutting, and coating processes. This media effectively filters hard-to-handle dust particles, surpassing the capabilities of conventional polyester media or expanded polytetrafluoroethylene (ePTFE) membrane media. The enhanced performance of the sinTexx Plus filter cartridges leads to an improved energy balance within the system.

What challenges does Bag Filter Market face during the growth?

Slow implementation of pollution control reforms is a key challenge affecting market growth.

  • The market is significant in the context of mining operations and air pollution control, with key players in this industry based in developed countries, including the US. Advanced air pollution regulations and technologies are stringently enforced in the US, driving the demand for effective air filtration systems. In contrast, developing countries in the Asia Pacific and Africa face challenges in implementing pollution control reforms due to limited resources and infrastructure for research and development. In the US, the implementation of the Clean Air Act, a strong economy, and the presence of several industrial clean air technology companies have positioned the country as a leader in The market.
  • Moreover, Nylon, polyester, and polypropylene materials are commonly used in bag filters for their durability and filtration efficiency. Sustainable practices are increasingly important in this industry, with companies focusing on reducing waste and improving energy efficiency. Effective implementation of cleaner production technologies and adherence to air pollution control regulations are essential for mining operations to minimize their environmental impact.

Exclusive Customer Landscape

The market forecasting report includes the adoption lifecycle of the market, covering from the innovator's stage to the laggard's stage. It focuses on adoption rates in different regions based on penetration. Furthermore, the market report also includes key purchase criteria and drivers of price sensitivity to help companies evaluate and develop their market growth analysis strategies.

Bag Filter Market Share by Geography

 Customer Landscape

Key Companies & Market Insights

Companies are implementing various strategies, such as strategic alliances, market forecast , partnerships, mergers and acquisitions, geographical expansion, and product/service launches, to enhance their presence in the market.

The market research and growth report includes detailed analyses of the competitive landscape of the market and information about key companies, including:

  • Ahlstrom Munksjo Oyj
  • Babcock and Wilcox Enterprises Inc.
  • BWF Offermann Waldenfels and Co. KG
  • Camfil AB
  • Danaher Corp.
  • Donaldson Co. Inc.
  • Eaton Corp. Plc
  • European Filter Corp Belgium NV
  • Filter Concept Pvt. Ltd.
  • Filtration Group Corp.
  • Fleetlife Inc.
  • FLSmidth and Co. AS
  • General Electric Co.
  • Lenntech BV
  • Mitsubishi Heavy Industries Ltd.
  • Parker Hannifin Corp.
  • Rosedale Products Inc.
  • Unifrax I LLC
  • W. L. Gore and Associates Inc.

Qualitative and quantitative analysis of companies has been conducted to help clients understand the wider business environment as well as the strengths and weaknesses of key market players. Data is qualitatively analyzed to categorize companies as pure play, category-focused, industry-focused, and diversified; it is quantitatively analyzed to categorize companies as dominant, leading, strong, tentative, and weak.

Research Analyst Overview

The market is witnessing significant growth due to the increasing concern for air pollution and the need for effective filtration systems in various industries. Industrial emissions from cement production, mining operations, and other industrial activities contribute significantly to air pollution. Bag filters play a crucial role in controlling these emissions by trapping dust, contaminants, and high viscosity liquids, as well as gases. The pulse jet segment and nonwoven segment are the major types of bag filters in the market. Pulse jet filters use a pulsed air jet to clean the filter media, while nonwoven filters use a mechanical shaking mechanism.

The Clean Air Act and Air Quality Directive have set stringent regulations for industrial emissions, leading to an increase in demand for bag filters in various industries. The power generation industry, particularly from renewable energy sources such as wind, solar, hydro, nuclear, and natural gas, also utilizes bag filters for effective filtration. Bag filters find applications in various industries, including infection control measures in hospital HVAC systems and filtration systems in industrial activities and construction projects. The use of nanofiber filter media, cleaning mechanisms, and monitoring systems further enhances the performance of bag filters. Sustainable practices and cleaner production technologies are also driving the growth of the market. Filter media made from sustainable materials such as nylon, polyester, and polypropylene are gaining popularity due to their durability and effectiveness. Bag filters are essential for maintaining air quality and ensuring compliance with regulations, making them an indispensable component of various industries.

Market Scope

Report Coverage

Details

Page number

160

Base year

2023

Historic period

2018-2022

Forecast period

2024-2028

Growth momentum & CAGR

Accelerate at a CAGR of 4.5%

Market growth 2024-2028

USD 1.25 billion

Market structure

Fragmented

YoY growth 2023-2024(%)

4.23

Key countries

US, China, India, UK, and Germany

Competitive landscape

Leading Companies, Market Positioning of Companies, Competitive Strategies, and Industry Risks

Request Free Sample

What are the Key Data Covered in this Market Research and Growth Report?

  • CAGR of the market during the forecast period
  • Detailed information on factors that will drive the market growth and forecasting between 2024 and 2028
  • Precise estimation of the size of the market  and its contribution of the market in focus to the parent market
  • Accurate predictions about upcoming market growth and trends and changes in consumer behaviour
  • Growth of the market across North America, Europe, APAC, South America, and Middle East and Africa
  • Thorough analysis of the market's competitive landscape and detailed information about companies
  • Comprehensive analysis of factors that will challenge the growth of market companies

We can help! Our analysts can customize this market research report to meet your requirements. Get in touch

1 Executive Summary

  • 1.1 Market overview
    • Executive Summary - Chart on Market Overview
    • Executive Summary - Data Table on Market Overview
    • Executive Summary - Chart on Global Market Characteristics
    • Executive Summary - Chart on Market by Geography
    • Executive Summary - Chart on Market Segmentation by End-user
    • Executive Summary - Chart on Market Segmentation by Product Type
    • Executive Summary - Chart on Incremental Growth
    • Executive Summary - Data Table on Incremental Growth
    • Executive Summary - Chart on Company Market Positioning

2 Market Landscape

  • 2.1 Market ecosystem
    • Parent Market
    • Data Table on - Parent Market
  • 2.2 Market characteristics
    • Market characteristics analysis
  • 2.3 Value chain analysis
    • Value Chain Analysis

3 Market Sizing

  • 3.1 Market definition
    • Offerings of companies included in the market definition
  • 3.2 Market segment analysis
    • Market segments
  • 3.3 Market size 2023
    • 3.4 Market outlook: Forecast for 2023-2028
      • Chart on Global - Market size and forecast 2023-2028 ($ million)
      • Data Table on Global - Market size and forecast 2023-2028 ($ million)
      • Chart on Global Market: Year-over-year growth 2023-2028 (%)
      • Data Table on Global Market: Year-over-year growth 2023-2028 (%)

    4 Historic Market Size

    • 4.1 Global Bag Filter Market 2018 - 2022
      • Historic Market Size - Data Table on Global Bag Filter Market 2018 - 2022 ($ million)
    • 4.2 End-user segment analysis 2018 - 2022
      • Historic Market Size - End-user Segment 2018 - 2022 ($ million)
    • 4.3 Product Type segment analysis 2018 - 2022
      • Historic Market Size - Product Type Segment 2018 - 2022 ($ million)
    • 4.4 Geography segment analysis 2018 - 2022
      • Historic Market Size - Geography Segment 2018 - 2022 ($ million)
    • 4.5 Country segment analysis 2018 - 2022
      • Historic Market Size - Country Segment 2018 - 2022 ($ million)

    5 Five Forces Analysis

    • 5.1 Five forces summary
      • Five forces analysis - Comparison between 2023 and 2028
    • 5.2 Bargaining power of buyers
      • Bargaining power of buyers - Impact of key factors 2023 and 2028
    • 5.3 Bargaining power of suppliers
      • Bargaining power of suppliers - Impact of key factors in 2023 and 2028
    • 5.4 Threat of new entrants
      • Threat of new entrants - Impact of key factors in 2023 and 2028
    • 5.5 Threat of substitutes
      • Threat of substitutes - Impact of key factors in 2023 and 2028
    • 5.6 Threat of rivalry
      • Threat of rivalry - Impact of key factors in 2023 and 2028
    • 5.7 Market condition
      • Chart on Market condition - Five forces 2023 and 2028

    6 Market Segmentation by End-user

    • 6.1 Market segments
      • Chart on End-user - Market share 2023-2028 (%)
      • Data Table on End-user - Market share 2023-2028 (%)
    • 6.2 Comparison by End-user
      • Chart on Comparison by End-user
      • Data Table on Comparison by End-user
    • 6.3 Chemical and petrochemical - Market size and forecast 2023-2028
      • Chart on Chemical and petrochemical - Market size and forecast 2023-2028 ($ million)
      • Data Table on Chemical and petrochemical - Market size and forecast 2023-2028 ($ million)
      • Chart on Chemical and petrochemical - Year-over-year growth 2023-2028 (%)
      • Data Table on Chemical and petrochemical - Year-over-year growth 2023-2028 (%)
    • 6.4 Food processing - Market size and forecast 2023-2028
      • Chart on Food processing - Market size and forecast 2023-2028 ($ million)
      • Data Table on Food processing - Market size and forecast 2023-2028 ($ million)
      • Chart on Food processing - Year-over-year growth 2023-2028 (%)
      • Data Table on Food processing - Year-over-year growth 2023-2028 (%)
    • 6.5 Mineral - Market size and forecast 2023-2028
      • Chart on Mineral - Market size and forecast 2023-2028 ($ million)
      • Data Table on Mineral - Market size and forecast 2023-2028 ($ million)
      • Chart on Mineral - Year-over-year growth 2023-2028 (%)
      • Data Table on Mineral - Year-over-year growth 2023-2028 (%)
    • 6.6 Cement - Market size and forecast 2023-2028
      • Chart on Cement - Market size and forecast 2023-2028 ($ million)
      • Data Table on Cement - Market size and forecast 2023-2028 ($ million)
      • Chart on Cement - Year-over-year growth 2023-2028 (%)
      • Data Table on Cement - Year-over-year growth 2023-2028 (%)
    • 6.7 Others - Market size and forecast 2023-2028
      • Chart on Others - Market size and forecast 2023-2028 ($ million)
      • Data Table on Others - Market size and forecast 2023-2028 ($ million)
      • Chart on Others - Year-over-year growth 2023-2028 (%)
      • Data Table on Others - Year-over-year growth 2023-2028 (%)
    • 6.8 Market opportunity by End-user
      • Market opportunity by End-user ($ million)
      • Data Table on Market opportunity by End-user ($ million)

    7 Market Segmentation by Product Type

    • 7.1 Market segments
      • Chart on Product Type - Market share 2023-2028 (%)
      • Data Table on Product Type - Market share 2023-2028 (%)
    • 7.2 Comparison by Product Type
      • Chart on Comparison by Product Type
      • Data Table on Comparison by Product Type
    • 7.3 Pulse jet - Market size and forecast 2023-2028
      • Chart on Pulse jet - Market size and forecast 2023-2028 ($ million)
      • Data Table on Pulse jet - Market size and forecast 2023-2028 ($ million)
      • Chart on Pulse jet - Year-over-year growth 2023-2028 (%)
      • Data Table on Pulse jet - Year-over-year growth 2023-2028 (%)
    • 7.4 Reverse air - Market size and forecast 2023-2028
      • Chart on Reverse air - Market size and forecast 2023-2028 ($ million)
      • Data Table on Reverse air - Market size and forecast 2023-2028 ($ million)
      • Chart on Reverse air - Year-over-year growth 2023-2028 (%)
      • Data Table on Reverse air - Year-over-year growth 2023-2028 (%)
    • 7.5 Shaker - Market size and forecast 2023-2028
      • Chart on Shaker - Market size and forecast 2023-2028 ($ million)
      • Data Table on Shaker - Market size and forecast 2023-2028 ($ million)
      • Chart on Shaker - Year-over-year growth 2023-2028 (%)
      • Data Table on Shaker - Year-over-year growth 2023-2028 (%)
    • 7.6 Market opportunity by Product Type
      • Market opportunity by Product Type ($ million)
      • Data Table on Market opportunity by Product Type ($ million)

    8 Customer Landscape

    • 8.1 Customer landscape overview
      • Analysis of price sensitivity, lifecycle, customer purchase basket, adoption rates, and purchase criteria

    9 Geographic Landscape

    • 9.1 Geographic segmentation
      • Chart on Market share by geography 2023-2028 (%)
      • Data Table on Market share by geography 2023-2028 (%)
    • 9.2 Geographic comparison
      • Chart on Geographic comparison
      • Data Table on Geographic comparison
    • 9.3 North America - Market size and forecast 2023-2028
      • Chart on North America - Market size and forecast 2023-2028 ($ million)
      • Data Table on North America - Market size and forecast 2023-2028 ($ million)
      • Chart on North America - Year-over-year growth 2023-2028 (%)
      • Data Table on North America - Year-over-year growth 2023-2028 (%)
    • 9.4 Europe - Market size and forecast 2023-2028
      • Chart on Europe - Market size and forecast 2023-2028 ($ million)
      • Data Table on Europe - Market size and forecast 2023-2028 ($ million)
      • Chart on Europe - Year-over-year growth 2023-2028 (%)
      • Data Table on Europe - Year-over-year growth 2023-2028 (%)
    • 9.5 APAC - Market size and forecast 2023-2028
      • Chart on APAC - Market size and forecast 2023-2028 ($ million)
      • Data Table on APAC - Market size and forecast 2023-2028 ($ million)
      • Chart on APAC - Year-over-year growth 2023-2028 (%)
      • Data Table on APAC - Year-over-year growth 2023-2028 (%)
    • 9.6 South America - Market size and forecast 2023-2028
      • Chart on South America - Market size and forecast 2023-2028 ($ million)
      • Data Table on South America - Market size and forecast 2023-2028 ($ million)
      • Chart on South America - Year-over-year growth 2023-2028 (%)
      • Data Table on South America - Year-over-year growth 2023-2028 (%)
    • 9.7 Middle East and Africa - Market size and forecast 2023-2028
      • Chart on Middle East and Africa - Market size and forecast 2023-2028 ($ million)
      • Data Table on Middle East and Africa - Market size and forecast 2023-2028 ($ million)
      • Chart on Middle East and Africa - Year-over-year growth 2023-2028 (%)
      • Data Table on Middle East and Africa - Year-over-year growth 2023-2028 (%)
    • 9.8 US - Market size and forecast 2023-2028
      • Chart on US - Market size and forecast 2023-2028 ($ million)
      • Data Table on US - Market size and forecast 2023-2028 ($ million)
      • Chart on US - Year-over-year growth 2023-2028 (%)
      • Data Table on US - Year-over-year growth 2023-2028 (%)
    • 9.9 China - Market size and forecast 2023-2028
      • Chart on China - Market size and forecast 2023-2028 ($ million)
      • Data Table on China - Market size and forecast 2023-2028 ($ million)
      • Chart on China - Year-over-year growth 2023-2028 (%)
      • Data Table on China - Year-over-year growth 2023-2028 (%)
    • 9.10 India - Market size and forecast 2023-2028
      • Chart on India - Market size and forecast 2023-2028 ($ million)
      • Data Table on India - Market size and forecast 2023-2028 ($ million)
      • Chart on India - Year-over-year growth 2023-2028 (%)
      • Data Table on India - Year-over-year growth 2023-2028 (%)
    • 9.11 UK - Market size and forecast 2023-2028
      • Chart on UK - Market size and forecast 2023-2028 ($ million)
      • Data Table on UK - Market size and forecast 2023-2028 ($ million)
      • Chart on UK - Year-over-year growth 2023-2028 (%)
      • Data Table on UK - Year-over-year growth 2023-2028 (%)
    • 9.12 Germany - Market size and forecast 2023-2028
      • Chart on Germany - Market size and forecast 2023-2028 ($ million)
      • Data Table on Germany - Market size and forecast 2023-2028 ($ million)
      • Chart on Germany - Year-over-year growth 2023-2028 (%)
      • Data Table on Germany - Year-over-year growth 2023-2028 (%)
    • 9.13 Market opportunity by geography
      • Market opportunity by geography ($ million)
      • Data Tables on Market opportunity by geography ($ million)

    10 Drivers, Challenges, and Opportunity/Restraints

    • 10.1 Market drivers
      • 10.2 Market challenges
        • 10.3 Impact of drivers and challenges
          • Impact of drivers and challenges in 2023 and 2028
        • 10.4 Market opportunities/restraints

          11 Competitive Landscape

          • 11.1 Overview
            • 11.2 Competitive Landscape
              • Overview on criticality of inputs and factors of differentiation
            • 11.3 Landscape disruption
              • Overview on factors of disruption
            • 11.4 Industry risks
              • Impact of key risks on business

            12 Competitive Analysis

            • 12.1 Companies profiled
              • Companies covered
            • 12.2 Market positioning of companies
              • Matrix on companies position and classification
            • 12.3 Babcock and Wilcox Enterprises Inc.
              • Babcock and Wilcox Enterprises Inc. - Overview
              • Babcock and Wilcox Enterprises Inc. - Business segments
              • Babcock and Wilcox Enterprises Inc. - Key news
              • Babcock and Wilcox Enterprises Inc. - Key offerings
              • Babcock and Wilcox Enterprises Inc. - Segment focus
            • 12.4 BWF Offermann Waldenfels and Co. KG
              • BWF Offermann Waldenfels and Co. KG - Overview
              • BWF Offermann Waldenfels and Co. KG - Product / Service
              • BWF Offermann Waldenfels and Co. KG - Key news
              • BWF Offermann Waldenfels and Co. KG - Key offerings
            • 12.5 Camfil AB
              • Camfil AB - Overview
              • Camfil AB - Product / Service
              • Camfil AB - Key offerings
            • 12.6 Danaher Corp.
              • Danaher Corp. - Overview
              • Danaher Corp. - Business segments
              • Danaher Corp. - Key news
              • Danaher Corp. - Key offerings
              • Danaher Corp. - Segment focus
            • 12.7 Eaton Corp. Plc
              • Eaton Corp. Plc - Overview
              • Eaton Corp. Plc - Business segments
              • Eaton Corp. Plc - Key news
              • Eaton Corp. Plc - Key offerings
              • Eaton Corp. Plc - Segment focus
            • 12.8 FLSmidth and Co. AS
              • FLSmidth and Co. AS - Overview
              • FLSmidth and Co. AS - Business segments
              • FLSmidth and Co. AS - Key news
              • FLSmidth and Co. AS - Key offerings
              • FLSmidth and Co. AS - Segment focus
            • 12.9 Lenntech BV
              • Lenntech BV - Overview
              • Lenntech BV - Product / Service
              • Lenntech BV - Key offerings
            • 12.10 Mitsubishi Heavy Industries Ltd.
              • Mitsubishi Heavy Industries Ltd. - Overview
              • Mitsubishi Heavy Industries Ltd. - Business segments
              • Mitsubishi Heavy Industries Ltd. - Key news
              • Mitsubishi Heavy Industries Ltd. - Key offerings
              • Mitsubishi Heavy Industries Ltd. - Segment focus
            • 12.11 Parker Hannifin Corp.
              • Parker Hannifin Corp. - Overview
              • Parker Hannifin Corp. - Business segments
              • Parker Hannifin Corp. - Key news
              • Parker Hannifin Corp. - Key offerings
              • Parker Hannifin Corp. - Segment focus
            • 12.12 W. L. Gore and Associates Inc.
              • W. L. Gore and Associates Inc. - Overview
              • W. L. Gore and Associates Inc. - Product / Service
              • W. L. Gore and Associates Inc. - Key news
              • W. L. Gore and Associates Inc. - Key offerings

            13 Appendix

            • 13.1 Scope of the report
              • 13.2 Inclusions and exclusions checklist
                • Inclusions checklist
                • Exclusions checklist
              • 13.3 Currency conversion rates for US$
                • Currency conversion rates for US$
              • 13.4 Research methodology
                • Research methodology
              • 13.5 Data procurement
                • Information sources
              • 13.6 Data validation
                • Data validation
              • 13.7 Validation techniques employed for market sizing
                • Validation techniques employed for market sizing
              • 13.8 Data synthesis
                • Data synthesis
              • 360 degree market analysis
                • 360 degree market analysis
              • 13.10 List of abbreviations
                • List of abbreviations

              Research Methodology

              Technavio presents a detailed picture of the market by way of study, synthesis, and summation of data from multiple sources. The analysts have presented the various facets of the market with a particular focus on identifying the key industry influencers. The data thus presented is comprehensive, reliable, and the result of extensive research, both primary and secondary.

              INFORMATION SOURCES

              Primary sources

              • Manufacturers and suppliers
              • Channel partners
              • Industry experts
              • Strategic decision makers

              Secondary sources

              • Industry journals and periodicals
              • Government data
              • Financial reports of key industry players
              • Historical data
              • Press releases

              DATA ANALYSIS

              Data Synthesis

              • Collation of data
              • Estimation of key figures
              • Analysis of derived insights

              Data Validation

              • Triangulation with data models
              • Reference against proprietary databases
              • Corroboration with industry experts

              REPORT WRITING

              Qualitative

              • Market drivers
              • Market challenges
              • Market trends
              • Five forces analysis

              Quantitative

              • Market size and forecast
              • Market segmentation
              • Geographical insights
              • Competitive landscape

              Interested in this report?

              Get your sample now to see our research methodology and insights!

              Download Now

              Frequently Asked Questions

              Bag Filter market growth will increase by $ 1253 mn during 2024-2028.

              The Bag Filter market is expected to grow at a CAGR of 4.5% during 2024-2028.

              Bag Filter market is segmented by End-user( Chemical and petrochemical, Food processing, Mineral, Cement, Others) Product Type( Pulse jet, Reverse air, Shaker)

              Ahlstrom Munksjo Oyj, Babcock and Wilcox Enterprises Inc., BWF Offermann Waldenfels and Co. KG, Camfil AB, Danaher Corp., Donaldson Co. Inc., Eaton Corp. Plc, European Filter Corp Belgium NV, Filter Concept Pvt. Ltd., Filtration Group Corp., Fleetlife Inc., FLSmidth and Co. AS, General Electric Co., Lenntech BV, Mitsubishi Heavy Industries Ltd., Parker Hannifin Corp., Rosedale Products Inc., Unifrax I LLC, W. L. Gore and Associates Inc. are a few of the key vendors in the Bag Filter market.

              North America will register the highest growth rate of 36% among the other regions. Therefore, the Bag Filter market in North America is expected to garner significant business opportunities for the vendors during the forecast period.

              US, China, India, UK, Germany

              • Rise in number of stringent emission control regulationsIndustrial emissions that include natural gases such as CO2 and particulate matter are identified as insidious pollutants. They cause severe respiratory illnesses and corrosive damage to buildings and the environment. Consequently is the driving factor this market.
              • stringent regulations have been enforced by government agencies to reduce pollution and protect the environment and public health.Governments of several countries across the world are addressing this issue through the Paris Agreement. Under this agreement is the driving factor this market.
              • the companies that emit GHGs through their operations are required to pay taxes on emissions is the driving factor this market.
              • known as carbon prices. By 2040 is the driving factor this market.
              • global carbon prices are expected to rise to $90-$100 per metric ton of CO2 released. The Paris Agreement aims to decrease CO2 emissions by 2% every year in Paris. However is the driving factor this market.
              • many steel-manufacturing companies are failing to fulfill this limit. Thus is the driving factor this market.
              • The World Bank Group and the International Monetary Fund have persuaded regional governments to increase carbon prices and force companies to pay taxes for their carbon emissions. This has led to an exponential increase in carbon prices in the European Union in 2021 compared with the prices in 2020. To address the rise in carbon prices is the driving factor this market.
              • companies are compelled to change their emission policies is the driving factor this market.
              • which is subsequently driving the growth of the global bag filter market. Manufacturing facilities must ensure compliance with regulations while discharging waste during their operations. One of the techniques to reduce SO2 emissions is the use of flue-gas desulfurization (FGD) systems is the driving factor this market.
              • which can help in removing sulfur content from coal and other fuels prior to combustion. China has been focusing on reducing its emissions through The Innovative Financing for Air Pollution Control program. The program was designed to support the implementation of the government’s Air Pollution Control Action Plan and the 13th Five-Year Plan (2016-2020) targets for energy efficiency and clean energy. The Chinese government has also issued technical guidelines to assist the installation of pollution control devices and simplify the process of equipment planning is the driving factor this market.
              • designing is the driving factor this market.
              • procurement is the driving factor this market.
              • installation is the driving factor this market.
              • commissioning is the driving factor this market.
              • and operation. Such factors are expected to encourage the adoption of bag filters and propel the growth of the bag filter market during the forecast period. is the driving factor this market.

              The Bag Filter market vendors should focus on grabbing business opportunities from the Chemical and petrochemical segment as it accounted for the largest market share in the base year.
              RIA - Research AI Assistant
              Ask RIA