Bagged Industrial Salt Market Analysis APAC, North America, Europe, Middle East and Africa, South America - China, US, India, Canada, Germany, Mexico, Russia, Japan, France, South Korea - Size and Forecast 2025-2029

Bagged Industrial Salt Market Analysis APAC, North America, Europe, Middle East and Africa, South America - China, US, India, Canada, Germany, Mexico, Russia, Japan, France, South Korea - Size and Forecast 2025-2029

Published: Dec 2024 206 Pages SKU: IRTNTR80465

Market Overview at a Glance

$328 Mn
Market Opportunity
1.2%
CAGR
1.1
YoY growth 2024-2025(%)

What is the Bagged Industrial Salt Market Size?

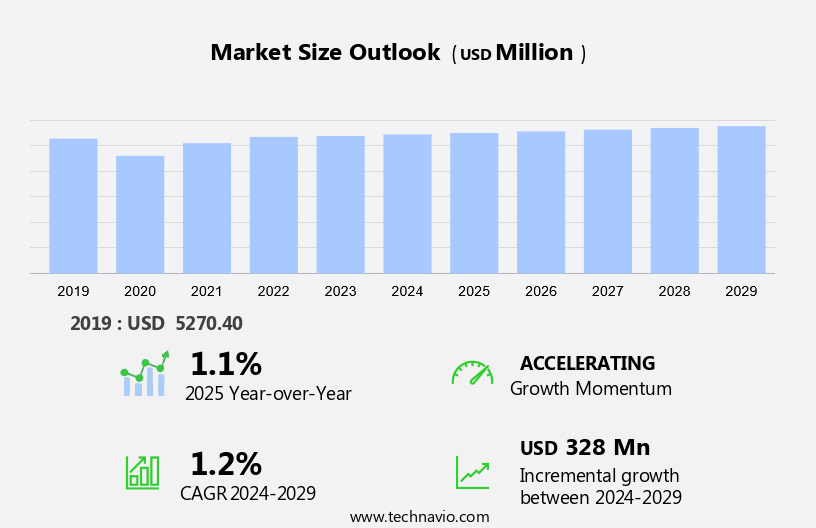
The bagged industrial salt market size is forecast to increase by USD 328 million, at a CAGR of 1.2% between 2024 and 2029. The market is experiencing significant growth, driven by the increasing exploration and initiation of new salt-based projects. Government regulations, particularly in North America, are also fueling market expansion. The demand for bagged industrial salt is on the rise due to its convenience and ease of use in various industries, including water softening, de-icing, and food processing. Additionally, the growing awareness of the importance of water treatment and management is driving the market forward. However, challenges such as fluctuating raw material prices and intense competition from alternative desalination technologies pose significant risks to market growth. Producers must stay abreast of these trends and challenges to remain competitive and succeed in this dynamic market.

What will be the size of the Market during the forecast period?

Bagged Industrial Salt Market Size

Request Free Bagged Industrial Salt Market Sample

Market Segmentation

The market report provides comprehensive data (region-wise segment analysis), with forecasts and estimates in "USD million" for the period 2025-2029, as well as historical data from 2019 - 2023 for the following segments.

  • Product Type
    • Fine
    • Coarse
  • Application
    • Chemical industry
    • De-icing
    • Food processing industry
    • Water treatment
    • Others
  • Geography
    • APAC
      • China
      • India
    • North America
      • Canada
      • US
    • Europe
      • Germany
    • Middle East and Africa
    • South America

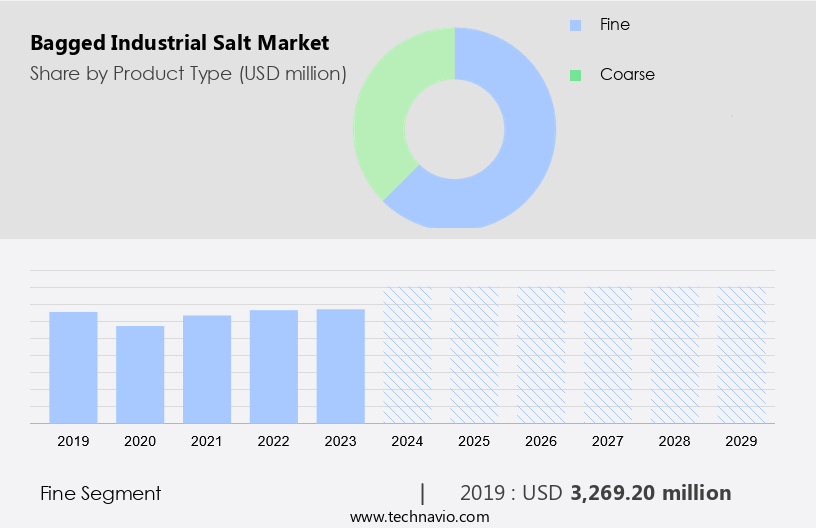
Which is the largest segment driving market growth?

The fine segment is estimated to witness significant growth during the forecast period. In the realm of industrial salts, fine bagged industrial salt, alternatively known as fine-screened or pulverized salt, occupies a significant position within the market. This type of sodium chloride is distinguished by its finely ground, consistent particles, making it an ideal choice for various industrial applications. The production process ensures the salt particles are uniformly small, which is vital for their effectiveness in industrial processes. Fine industrial salt's fine texture enables it to dissolve rapidly and evenly, a crucial factor in applications necessitating precise chemical reactions. One of its primary applications is in the chlor-alkali process, which involves the production of high-grade chemicals such as chlorine, caustic soda, and hydrochloric acid. These chemicals are integral to numerous industries, including water treatment, PVC manufacturing, and the production of titanium dioxide, a common pigment in paints and plastics.

Bagged Industrial Salt Market Size

Get a glance at the market share of various regions. Download the PDF Sample

The fine segment was valued at USD 3.27 billion in 2019. In water treatment, fine industrial salt is used as a softener, improving the quality of water for various applications, including industrial processes and household use. In the realm of plastics, fine industrial salt is an essential ingredient in the production of PVC, a versatile plastic used in various industries, including construction, automotive, and healthcare. The use of high-purity salts in these applications ensures the production of superior quality products, enhancing the overall efficiency and effectiveness of the industrial processes.

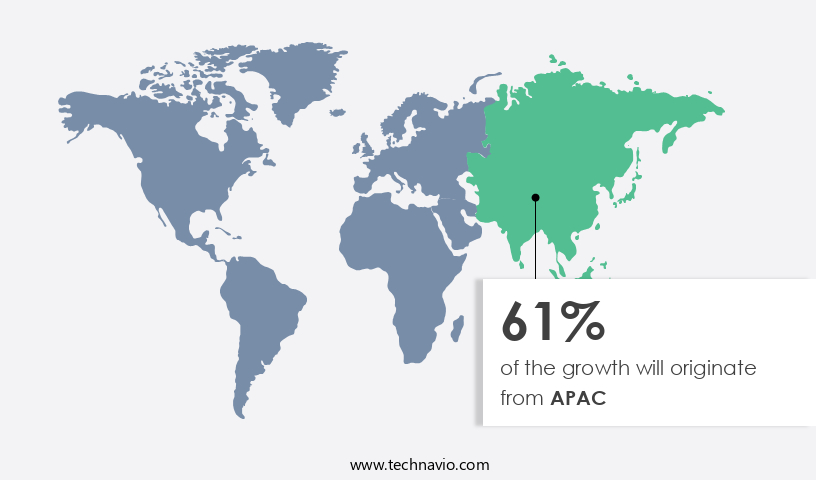
Which region is leading the market?

Bagged Industrial Salt Market Share by Geography

For more insights on the market share of various regions, Request Free Sample

APAC is estimated to contribute 61% to the growth of the global market during the forecast period. Technavio's analysts have elaborately explained the regional trends and drivers that shape the market during the forecast period. The APAC region, specifically India, plays a pivotal role in the global bagged industrial salt market. According to the Indian Salt Manufacturers Association (ISMA), salt production in India reached an impressive seven-year high in the 2024 fiscal year, totaling 337.56 lakh MT. This represents a 10% increase from the previous year's production of 308.01 lakh MT. This growth is a positive sign for the market, indicating strong demand and favorable conditions for manufacturers in the region. Bagged industrial salt is essential for various industries, including energy production and manufacturing processes. In energy generation, it is used in the production of chlor-alkali and other chemicals. In manufacturing, it is utilized as a raw material in the production of circuit boards and other electronic components.

Furthermore, it is crucial for environmental protection agency regulations and the production of clean drinking water. Salt is produced through various methods, such as vacuum pan technology, solution mining, and mining. Logistical services play a significant role in the transportation and distribution of bagged industrial salt. Companies that specialize in this area ensure the timely delivery of salt to various industries, including hospitals and energy production facilities. Moreover, salt is also used in the production of brine, which is an essential component in energy generation, particularly in the production of geothermal and solar energy. The increasing demand for renewable energy sources is expected to drive the growth of the bagged industrial salt market in the coming years. In conclusion, the bagged industrial salt market is a vital sector, with significant applications in various industries, including energy production, manufacturing processes, environmental protection, and clean drinking water production. The APAC region, particularly India, is a major player in the global market, with production reaching a seven-year high in the 2024 fiscal year. The growth of the market is attributed to the increasing demand for salt in various industries and the production of renewable energy sources.

How do company ranking index and market positioning come to your aid?

Companies are implementing various strategies, such as strategic alliances, partnerships, mergers and acquisitions, geographical expansion, and product/service launches, to enhance their presence in the market.

  • ANGEL CHEMICALS Pvt, Ltd.: The company offers bagged industrial salt used in water treatment processes, softening water by removing calcium and magnesium ions, and in the production of various chemicals such as sodium hydroxide and chlorine.

Technavio provides the ranking index for the top 20 companies along with insights on the market positioning of:

  • Archean Chemical Industries Ltd.
  • Benzer Multitech India Pvt Ltd.
  • Cargill Inc.
  • Delmon Group
  • Dhaval Enterprises
  • Dominion Salt Ltd.
  • Donald Brown Group
  • INEOS Group Holdings S.A.
  • Krishna Group
  • KS Aktiengesellschaft
  • Mitsui and Co. Ltd.
  • Nahta Salt AND Chemicals Pvt Ltd.
  • Namco Pools
  • Rio Tinto Ltd.
  • Tata Chemicals Ltd.
  • Usb Chemicals

Explore our company rankings and market positioning. Request Free Sample

How can Technavio assist you in making critical decisions?

Bagged Industrial Salt Market Size

What is the market structure and year-over-year growth of the Market?

Market structure

Fragmented

YoY growth 2024-2025

1.1

Market Dynamics

The market is essential for various applications, including chemical manufacturing, industrial automation, and water purification. The market is driven by the demand for salt for pharmaceuticals, salt for agriculture, salt for food preservation, and salt for industrial use. Key industries like mineral extraction, salt mining, and salt harvesting rely on advanced process engineering to enhance salt refining and salt processing methods. Sustainability is a growing concern, with companies adopting green manufacturing practices and complying with environmental regulations to ensure environmental sustainability. Saltwater management, saltwater desalination, and saltwater recycling are critical for managing resources efficiently, especially in water treatment applications and saltwater disposal. The market is also influenced by regulatory compliance, including environment agency licenses, local authority permits, and environmental certifications. As industries adopt sustainable manufacturing and environmental auditing, the market sees increased demand for salt in de-icing, water softening, and agriculture. Our researchers analyzed the data with 2024 as the base year, along with the key drivers, trends, and challenges. A holistic analysis of drivers will help companies refine their marketing strategies to gain a competitive advantage.

What are the primary factors driving the market growth?

Increasing salt exploration is the key factor driving the market growth. The bagged industrial salt market is experiencing substantial growth due to the increasing exploitation of salt deposits, particularly in regions with abundant reserves. Further, magnesium, sodium fluorosilicate, and other high-purity salts are essential in various industries, such as chemical processing, water treatment, and agriculture. In the chemical industry production, magnesium chloride is used in the manufacturing processes of PVC, while sodium fluorosilicate is a critical component in the production of phosphate fertilizers. In the agriculture industry, sulfates and chlorides are vital for enhancing soil fertility and improving crop yields. Moreover, the healthcare sector utilizes high-grade salts for various applications, including intravenous formulas and contact solutions. In the food and beverage industry, salt is a crucial ingredient in laundry care products, such as detergent and soap, as well as in food processing and food items. In the energy sector, evaporated salt is used in solar pools, solar evaporation, and energy production.

However, environmental regulations and compliance are essential considerations in the bagged industrial salt market. The Environmental Protection Agency (EPA) sets strict regulations to minimize CO2 emissions and noise levels during mining activities and manufacturing processes. Vacuum pan technology, solution mining, and logistical services are employed to optimize supply chain management and ensure clean drinking water. In conclusion, the bagged industrial salt market is witnessing significant growth due to the increasing demand for high-purity salts in various industries, including the chemical, agriculture, healthcare, food and beverage, and energy sectors. The exploration of new salt deposits and the implementation of advanced technologies and sustainable practices are essential to meet the rising demand and ensure environmental compliance. Thus, such factors are driving the growth of the market during the forecast period.

What are the significant trends being witnessed in the market?

Initiation of new salt based projects is the primary trend shaping the market growth. The market is experiencing notable expansion due to the commencement of new salt-based projects, increasing production capacities, and catering to the rising demand for high-grade industrial salts. The vacuum pan technique and solution mining are essential methods used in the salt industry for the production of high-purity salts. These techniques ensure the production of salt with minimal bacterial formation and maintain environmental compliance with regulations set by the Environmental Protection Agency. The salt industry also plays a crucial role in water treatment, supplying high-purity salts for the production of chlorine, chlorine dioxide, and calcium hypochlorite. Industrial salt is also used in various manufacturing processes, including the production of PVC, plastics, and circuit boards. In the energy sector, industrial salt is used in energy production and as a coolant in manufacturing processes. The solar evaporation method is used to produce evaporated salt for solar pools and thermal energy generation. In the food industry, industrial salt is used in the production of various food items, including meat and cosmetics. In the pharmaceutical industry, high-purity salts are used in the production of therapeutic drugs and in the manufacturing of capsules.

Moreover, the mining and supply chain management of salt deposits also contribute significantly to the economy, with salt mines being a vital source of CO2 emissions reduction and noise levels control. In conclusion, the bagged industrial salt market is witnessing significant growth due to the increasing demand for high-purity salts in various industries. The production of high-purity salts through advanced techniques like vacuum pan technology and solution mining ensures environmental compliance and meets the stringent requirements of various industries. The versatility of industrial salt in manufacturing processes, water treatment, food processing, and the pharmaceutical industry makes it an indispensable commodity. Thus, such trends will shape the growth of the market during the forecast period.

What are the major market challenges?

Government regulation is the major challenge that impedes market growth. The market encounters rigorous challenges due to escalating environmental regulations and government policies. The Environmental Protection Agency (EPA) and other regulatory bodies enforce stringent reporting regimes and control measures to minimize CO2 emissions and noise levels. In the mining sector, solution mining and vacuum pan technology are increasingly used to extract high-purity salts, including sodium chloride, potassium chloride, and calcium hypochlorite, for various applications, including laundry care products, meat processing, and solar pools. However, these mining activities can negatively impact the environment, necessitating the implementation of environmental performance standards and best practices. The bagged industrial salt market's growth is further influenced by the demand for specialty salts, such as sodium chlorate, used in manufacturing processes, circuit boards, and energy production.

Additionally, the healthcare sector's demand for intravenous formulas, contact solutions, and lubricants, as well as the agriculture industry's need for salt for agricultural applications, further fuels market growth. Despite these challenges and opportunities, the bagged industrial salt market continues to evolve, driven by advancements in technology, increasing demand for clean drinking water, and the growing importance of environmental protection. Companies in the market must adapt to these changes and maintain a strong supply chain management system to meet the evolving needs of their customers. Hence, the above factors will impede the growth of the market during the forecast period.

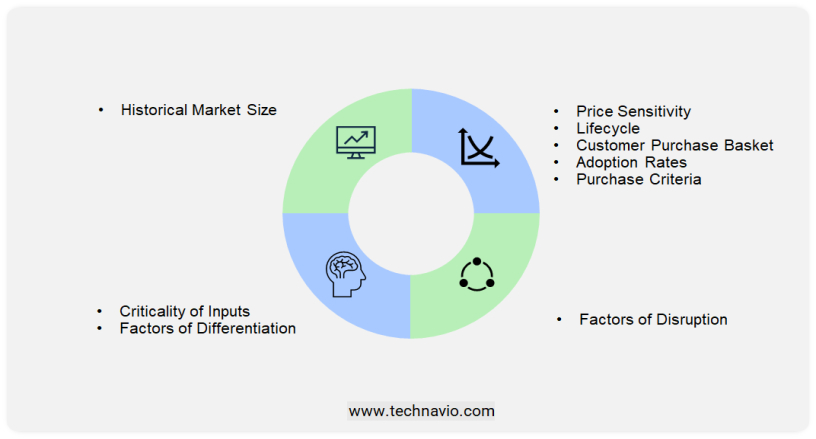
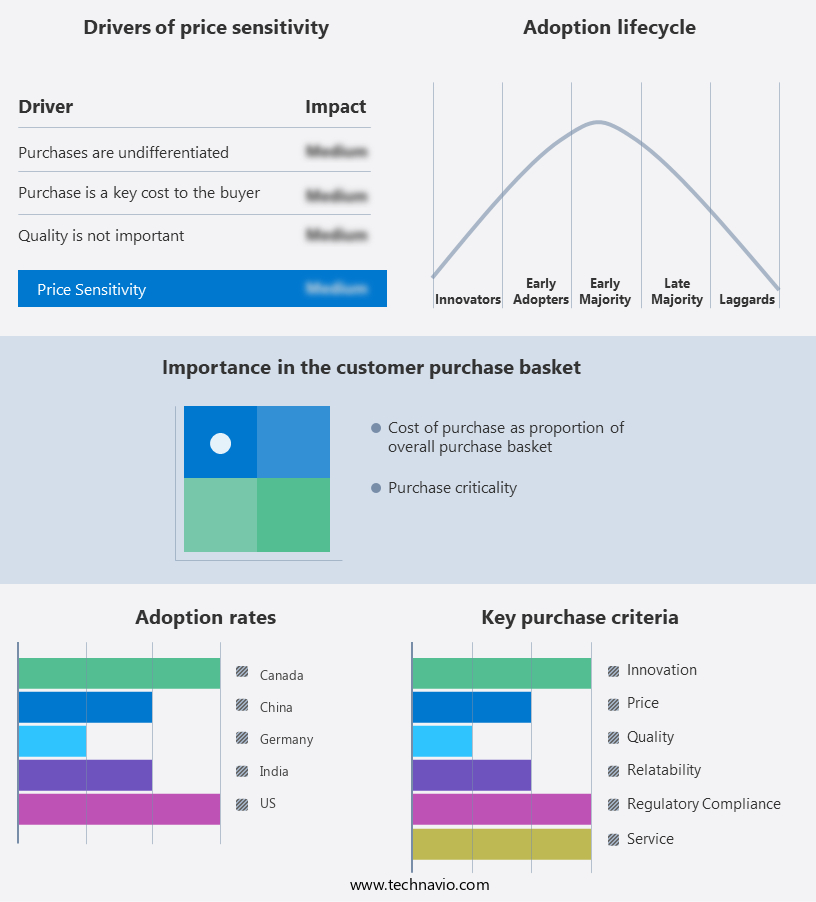
Exclusive Customer Landscape

The market forecasting report includes the adoption lifecycle of the market, covering from the innovator's stage to the laggard's stage. The market forecast report focuses on adoption rates in different regions based on penetration and market trends. Furthermore, the market research and growth report also includes key purchase criteria and drivers of price sensitivity to help companies evaluate and develop their market growth analysis strategies.

Bagged Industrial Salt Market Share by Geography

 Customer Landscape

Market Analyst Overview

The market for bagged industrial salt is driven by several factors, both internal and external. Internal factors, such as chemical processing, play a significant role in the demand for bagged industrial salts. Magnesium, sodium fluorosilicate, and sulfates are essential raw materials used in the production of high-purity salts, which are in high demand in the chemical industry. These salts are used in the manufacturing processes of various products, such as detergents, soaps, and pharmaceuticals. The food industry is another major consumer of bagged industrial salt. Perishable products, meat, and dairy require preservation to maintain their quality and extend their shelf life. Sodium chloride, or common table salt, is widely used as a preservative in food processing. However, high-grade salts, such as rock salt and evaporated salt, are used in the production of various food items, including pickles, canned foods, and solar pools. The mining industry is a significant contributor to the bagged industrial salt market. Salt mines are the primary source of rock salt, which is used in various applications, including water treatment, agriculture, and de-icing. Mining activities also lead to the discovery of other minerals, such as magnesium, potassium, and calcium, which are used in the production of high-purity salts. External factors, such as environmental regulations, also impact the bagged industrial salt market.

Further, the Environmental Protection Agency (EPA) and other regulatory bodies have set strict guidelines for the use and disposal of certain chemicals, including chlorides and sulfates. This has led to an increase in demand for natural brine and vacuum pan technology, which are used in the production of high-purity salts without the use of harmful chemicals. The healthcare industry is another significant consumer of bagged industrial salt. Sodium chloride is used in the production of intravenous formulas, contact solutions, and other medical applications. Titanium dioxide, a white pigment used in cosmetics, is also produced using bagged industrial salt. The laundry industry is another major consumer of bagged industrial salt. Laundry care products, such as detergents and fabric softeners, require large quantities of sodium chloride for their production. Cold packaging is also a growing trend in the laundry industry, which requires the use of high-purity salts to maintain the quality of the products during transportation and storage.

Moreover, potassium chloride is used as a fertilizer and a livestock feed additive. The manufacturing sector also uses bagged industrial salt in various applications. Sodium chlorate is used as a bleaching agent in the production of paper and pulp. Calcium hypochlorite and sodium hypochlorite are used as disinfectants in various manufacturing processes. Sodium chloride is also used as a coolant in manufacturing processes, such as metalworking and plastic processing. In conclusion, the bagged industrial salt market is driven by various internal and external factors. The chemical industry, food processing, water treatment, and the mining industry are significant consumers of bagged industrial salt. Environmental regulations and the discovery of new minerals also impact the market. The healthcare, laundry, agricultural, and manufacturing industries are other major consumers of bagged industrial salt. The market is expected to grow in the coming years due to the increasing demand for high-purity salts and the growing awareness of environmental regulations.

Market Scope

Report Coverage

Details

Page number

206

Base year

2024

Historic period

2019 - 2023

Forecast period

2025-2029

Growth momentum & CAGR

Accelerate at a CAGR of 1.2%

Market growth 2025-2029

USD 328 million

Regional analysis

APAC, North America, Europe, Middle East and Africa, and South America

Performing market contribution

APAC at 61%

Key countries

China, US, India, Canada, and Germany

Competitive landscape

Leading Companies, Market Positioning of Companies, Competitive Strategies, and Industry Risks

Key companies profiled

ANGEL CHEMICALS Pvt, Ltd., Archean Chemical Industries Ltd., Benzer Multitech India Pvt Ltd., Cargill Inc., Delmon Group, Dhaval Enterprises, Dominion Salt Ltd., Donald Brown Group, INEOS Group Holdings S.A., Krishna Group, KS Aktiengesellschaft, Mitsui and Co. Ltd., Nahta Salt AND Chemicals Pvt Ltd., Namco Pools, Rio Tinto Ltd., Tata Chemicals Ltd., and Usb Chemicals

Market Segmentation

Product Type (Fine and Coarse), Application (Chemical industry, De-icing, Food processing industry, Water treatment, and Others), and Geography (APAC, North America, Europe, Middle East and Africa, and South America)

Customization purview

If our report has not included the data that you are looking for, you can reach out to our analysts and get segments customized.

Download PDF Sample

What are the Key Data Covered in this Market Research Report?

  • CAGR of the market during the forecast period
  • Detailed information on factors that will drive the market growth and forecasting between 2025 and 2029
  • Precise estimation of the size of the market  and its contribution of the market in focus to the parent market
  • Accurate predictions about upcoming market growth and trends and changes in consumer behavior
  • Growth of the market across APAC, North America, Europe, Middle East and Africa, and South America
  • Thorough analysis of the market's competitive landscape and detailed information about companies
  • Comprehensive analysis of factors that will challenge the growth of market companies

1 Executive Summary

  • 1.1 Market overview
    • Executive Summary - Chart on Market Overview
    • Executive Summary - Data Table on Market Overview
    • Executive Summary - Chart on Global Market Characteristics
    • Executive Summary - Chart on Market by Geography
    • Executive Summary - Chart on Market Segmentation by Product Type
    • Executive Summary - Chart on Market Segmentation by Application
    • Executive Summary - Chart on Incremental Growth
    • Executive Summary - Data Table on Incremental Growth
    • Executive Summary - Chart on Company Market Positioning

2 Technavio Analysis

  • 2.1 Analysis of price sensitivity, lifecycle, customer purchase basket, adoption rates, and purchase criteria
    • Analysis of price sensitivity, lifecycle, customer purchase basket, adoption rates, and purchase criteria
  • 2.2 Criticality of inputs and Factors of differentiation
    • Overview on criticality of inputs and factors of differentiation
  • 2.3 Factors of disruption
    • Overview on factors of disruption
  • 2.4 Impact of drivers and challenges
    • Impact of drivers and challenges in 2024 and 2029

3 Market Landscape

  • 3.1 Market ecosystem
    • Parent Market
    • Data Table on - Parent Market
  • 3.2 Market characteristics
    • Market characteristics analysis
  • 3.3 Value chain analysis
    • Value chain analysis

4 Market Sizing

  • 4.1 Market definition
    • Offerings of companies included in the market definition
  • 4.2 Market segment analysis
    • Market segments
  • 4.3 Market size 2024
    • 4.4 Market outlook: Forecast for 2024-2029
      • Chart on Global - Market size and forecast 2024-2029 ($ million)
      • Data Table on Global - Market size and forecast 2024-2029 ($ million)
      • Chart on Global Market: Year-over-year growth 2024-2029 (%)
      • Data Table on Global Market: Year-over-year growth 2024-2029 (%)

    5 Historic Market Size

    • 5.1 Global Bagged Industrial Salt Market 2019 - 2023
      • Historic Market Size - Data Table on Global Bagged Industrial Salt Market 2019 - 2023 ($ million)
    • 5.2 Product Type segment analysis 2019 - 2023
      • Historic Market Size - Product Type Segment 2019 - 2023 ($ million)
    • 5.3 Application segment analysis 2019 - 2023
      • Historic Market Size - Application Segment 2019 - 2023 ($ million)
    • 5.4 Geography segment analysis 2019 - 2023
      • Historic Market Size - Geography Segment 2019 - 2023 ($ million)
    • 5.5 Country segment analysis 2019 - 2023
      • Historic Market Size - Country Segment 2019 - 2023 ($ million)

    6 Qualitative Analysis

    • 6.1 Impact of AI on the Global Bagged Industrial Salt Market

      7 Five Forces Analysis

      • 7.1 Five forces summary
        • Five forces analysis - Comparison between 2024 and 2029
      • 7.2 Bargaining power of buyers
        • Bargaining power of buyers - Impact of key factors 2024 and 2029
      • 7.3 Bargaining power of suppliers
        • Bargaining power of suppliers - Impact of key factors in 2024 and 2029
      • 7.4 Threat of new entrants
        • Threat of new entrants - Impact of key factors in 2024 and 2029
      • 7.5 Threat of substitutes
        • Threat of substitutes - Impact of key factors in 2024 and 2029
      • 7.6 Threat of rivalry
        • Threat of rivalry - Impact of key factors in 2024 and 2029
      • 7.7 Market condition
        • Chart on Market condition - Five forces 2024 and 2029

      8 Market Segmentation by Product Type

      • 8.1 Market segments
        • Chart on Product Type - Market share 2024-2029 (%)
        • Data Table on Product Type - Market share 2024-2029 (%)
      • 8.2 Comparison by Product Type
        • Chart on Comparison by Product Type
        • Data Table on Comparison by Product Type
      • 8.3 Fine - Market size and forecast 2024-2029
        • Chart on Fine - Market size and forecast 2024-2029 ($ million)
        • Data Table on Fine - Market size and forecast 2024-2029 ($ million)
        • Chart on Fine - Year-over-year growth 2024-2029 (%)
        • Data Table on Fine - Year-over-year growth 2024-2029 (%)
      • 8.4 Coarse - Market size and forecast 2024-2029
        • Chart on Coarse - Market size and forecast 2024-2029 ($ million)
        • Data Table on Coarse - Market size and forecast 2024-2029 ($ million)
        • Chart on Coarse - Year-over-year growth 2024-2029 (%)
        • Data Table on Coarse - Year-over-year growth 2024-2029 (%)
      • 8.5 Market opportunity by Product Type
        • Market opportunity by Product Type ($ million)
        • Data Table on Market opportunity by Product Type ($ million)

      9 Market Segmentation by Application

      • 9.1 Market segments
        • Chart on Application - Market share 2024-2029 (%)
        • Data Table on Application - Market share 2024-2029 (%)
      • 9.2 Comparison by Application
        • Chart on Comparison by Application
        • Data Table on Comparison by Application
      • 9.3 Chemical industry - Market size and forecast 2024-2029
        • Chart on Chemical industry - Market size and forecast 2024-2029 ($ million)
        • Data Table on Chemical industry - Market size and forecast 2024-2029 ($ million)
        • Chart on Chemical industry - Year-over-year growth 2024-2029 (%)
        • Data Table on Chemical industry - Year-over-year growth 2024-2029 (%)
      • 9.4 De-icing - Market size and forecast 2024-2029
        • Chart on De-icing - Market size and forecast 2024-2029 ($ million)
        • Data Table on De-icing - Market size and forecast 2024-2029 ($ million)
        • Chart on De-icing - Year-over-year growth 2024-2029 (%)
        • Data Table on De-icing - Year-over-year growth 2024-2029 (%)
      • 9.5 Food processing industry - Market size and forecast 2024-2029
        • Chart on Food processing industry - Market size and forecast 2024-2029 ($ million)
        • Data Table on Food processing industry - Market size and forecast 2024-2029 ($ million)
        • Chart on Food processing industry - Year-over-year growth 2024-2029 (%)
        • Data Table on Food processing industry - Year-over-year growth 2024-2029 (%)
      • 9.6 Water treatment - Market size and forecast 2024-2029
        • Chart on Water treatment - Market size and forecast 2024-2029 ($ million)
        • Data Table on Water treatment - Market size and forecast 2024-2029 ($ million)
        • Chart on Water treatment - Year-over-year growth 2024-2029 (%)
        • Data Table on Water treatment - Year-over-year growth 2024-2029 (%)
      • 9.7 Others - Market size and forecast 2024-2029
        • Chart on Others - Market size and forecast 2024-2029 ($ million)
        • Data Table on Others - Market size and forecast 2024-2029 ($ million)
        • Chart on Others - Year-over-year growth 2024-2029 (%)
        • Data Table on Others - Year-over-year growth 2024-2029 (%)
      • 9.8 Market opportunity by Application
        • Market opportunity by Application ($ million)
        • Data Table on Market opportunity by Application ($ million)

      10 Customer Landscape

      • 10.1 Customer landscape overview
        • Analysis of price sensitivity, lifecycle, customer purchase basket, adoption rates, and purchase criteria

      11 Geographic Landscape

      • 11.1 Geographic segmentation
        • Chart on Market share by geography 2024-2029 (%)
        • Data Table on Market share by geography 2024-2029 (%)
      • 11.2 Geographic comparison
        • Chart on Geographic comparison
        • Data Table on Geographic comparison
      • 11.3 APAC - Market size and forecast 2024-2029
        • Chart on APAC - Market size and forecast 2024-2029 ($ million)
        • Data Table on APAC - Market size and forecast 2024-2029 ($ million)
        • Chart on APAC - Year-over-year growth 2024-2029 (%)
        • Data Table on APAC - Year-over-year growth 2024-2029 (%)
      • 11.4 North America - Market size and forecast 2024-2029
        • Chart on North America - Market size and forecast 2024-2029 ($ million)
        • Data Table on North America - Market size and forecast 2024-2029 ($ million)
        • Chart on North America - Year-over-year growth 2024-2029 (%)
        • Data Table on North America - Year-over-year growth 2024-2029 (%)
      • 11.5 Europe - Market size and forecast 2024-2029
        • Chart on Europe - Market size and forecast 2024-2029 ($ million)
        • Data Table on Europe - Market size and forecast 2024-2029 ($ million)
        • Chart on Europe - Year-over-year growth 2024-2029 (%)
        • Data Table on Europe - Year-over-year growth 2024-2029 (%)
      • 11.6 Middle East and Africa - Market size and forecast 2024-2029
        • Chart on Middle East and Africa - Market size and forecast 2024-2029 ($ million)
        • Data Table on Middle East and Africa - Market size and forecast 2024-2029 ($ million)
        • Chart on Middle East and Africa - Year-over-year growth 2024-2029 (%)
        • Data Table on Middle East and Africa - Year-over-year growth 2024-2029 (%)
      • 11.7 South America - Market size and forecast 2024-2029
        • Chart on South America - Market size and forecast 2024-2029 ($ million)
        • Data Table on South America - Market size and forecast 2024-2029 ($ million)
        • Chart on South America - Year-over-year growth 2024-2029 (%)
        • Data Table on South America - Year-over-year growth 2024-2029 (%)
      • 11.8 China - Market size and forecast 2024-2029
        • Chart on China - Market size and forecast 2024-2029 ($ million)
        • Data Table on China - Market size and forecast 2024-2029 ($ million)
        • Chart on China - Year-over-year growth 2024-2029 (%)
        • Data Table on China - Year-over-year growth 2024-2029 (%)
      • 11.9 US - Market size and forecast 2024-2029
        • Chart on US - Market size and forecast 2024-2029 ($ million)
        • Data Table on US - Market size and forecast 2024-2029 ($ million)
        • Chart on US - Year-over-year growth 2024-2029 (%)
        • Data Table on US - Year-over-year growth 2024-2029 (%)
      • 11.10 India - Market size and forecast 2024-2029
        • Chart on India - Market size and forecast 2024-2029 ($ million)
        • Data Table on India - Market size and forecast 2024-2029 ($ million)
        • Chart on India - Year-over-year growth 2024-2029 (%)
        • Data Table on India - Year-over-year growth 2024-2029 (%)
      • 11.11 Canada - Market size and forecast 2024-2029
        • Chart on Canada - Market size and forecast 2024-2029 ($ million)
        • Data Table on Canada - Market size and forecast 2024-2029 ($ million)
        • Chart on Canada - Year-over-year growth 2024-2029 (%)
        • Data Table on Canada - Year-over-year growth 2024-2029 (%)
      • 11.12 Germany - Market size and forecast 2024-2029
        • Chart on Germany - Market size and forecast 2024-2029 ($ million)
        • Data Table on Germany - Market size and forecast 2024-2029 ($ million)
        • Chart on Germany - Year-over-year growth 2024-2029 (%)
        • Data Table on Germany - Year-over-year growth 2024-2029 (%)
      • 11.13 Mexico - Market size and forecast 2024-2029
        • Chart on Mexico - Market size and forecast 2024-2029 ($ million)
        • Data Table on Mexico - Market size and forecast 2024-2029 ($ million)
        • Chart on Mexico - Year-over-year growth 2024-2029 (%)
        • Data Table on Mexico - Year-over-year growth 2024-2029 (%)
      • 11.14 Russia - Market size and forecast 2024-2029
        • Chart on Russia - Market size and forecast 2024-2029 ($ million)
        • Data Table on Russia - Market size and forecast 2024-2029 ($ million)
        • Chart on Russia - Year-over-year growth 2024-2029 (%)
        • Data Table on Russia - Year-over-year growth 2024-2029 (%)
      • 11.15 Japan - Market size and forecast 2024-2029
        • Chart on Japan - Market size and forecast 2024-2029 ($ million)
        • Data Table on Japan - Market size and forecast 2024-2029 ($ million)
        • Chart on Japan - Year-over-year growth 2024-2029 (%)
        • Data Table on Japan - Year-over-year growth 2024-2029 (%)
      • 11.16 France - Market size and forecast 2024-2029
        • Chart on France - Market size and forecast 2024-2029 ($ million)
        • Data Table on France - Market size and forecast 2024-2029 ($ million)
        • Chart on France - Year-over-year growth 2024-2029 (%)
        • Data Table on France - Year-over-year growth 2024-2029 (%)
      • 11.17 South Korea - Market size and forecast 2024-2029
        • Chart on South Korea - Market size and forecast 2024-2029 ($ million)
        • Data Table on South Korea - Market size and forecast 2024-2029 ($ million)
        • Chart on South Korea - Year-over-year growth 2024-2029 (%)
        • Data Table on South Korea - Year-over-year growth 2024-2029 (%)
      • 11.18 Market opportunity by geography
        • Market opportunity by geography ($ million)
        • Data Tables on Market opportunity by geography ($ million)

      12 Drivers, Challenges, and Opportunity/Restraints

      • 12.1 Market drivers
        • 12.2 Market challenges
          • 12.3 Impact of drivers and challenges
            • Impact of drivers and challenges in 2024 and 2029
          • 12.4 Market opportunities/restraints

            13 Competitive Landscape

            • 13.1 Overview
              • 13.2 Competitive Landscape
                • Overview on criticality of inputs and factors of differentiation
              • 13.3 Landscape disruption
                • Overview on factors of disruption
              • 13.4 Industry risks
                • Impact of key risks on business

              14 Competitive Analysis

              • 14.1 Companies profiled
                • Companies covered
              • 14.2 Company ranking index
                • Company ranking index
              • 14.3 Market positioning of companies
                • Matrix on companies position and classification
              • 14.4 ANGEL CHEMICALS Pvt, Ltd.
                • ANGEL CHEMICALS Pvt, Ltd. - Overview
                • ANGEL CHEMICALS Pvt, Ltd. - Product / Service
                • ANGEL CHEMICALS Pvt, Ltd. - Key offerings
                • SWOT
              • 14.5 Archean Chemical Industries Ltd.
                • Archean Chemical Industries Ltd. - Overview
                • Archean Chemical Industries Ltd. - Product / Service
                • Archean Chemical Industries Ltd. - Key offerings
                • SWOT
              • 14.6 Benzer Multitech India Pvt Ltd.
                • Benzer Multitech India Pvt Ltd. - Overview
                • Benzer Multitech India Pvt Ltd. - Product / Service
                • Benzer Multitech India Pvt Ltd. - Key offerings
                • SWOT
              • 14.7 Cargill Inc.
                • Cargill Inc. - Overview
                • Cargill Inc. - Product / Service
                • Cargill Inc. - Key offerings
                • SWOT
              • 14.8 Dhaval Enterprises
                • Dhaval Enterprises - Overview
                • Dhaval Enterprises - Product / Service
                • Dhaval Enterprises - Key offerings
                • SWOT
              • 14.9 Dominion Salt Ltd.
                • Dominion Salt Ltd. - Overview
                • Dominion Salt Ltd. - Product / Service
                • Dominion Salt Ltd. - Key offerings
                • SWOT
              • 14.10 Donald Brown Group
                • Donald Brown Group - Overview
                • Donald Brown Group - Product / Service
                • Donald Brown Group - Key offerings
                • SWOT
              • 14.11 INEOS Group Holdings S.A.
                • INEOS Group Holdings S.A. - Overview
                • INEOS Group Holdings S.A. - Product / Service
                • INEOS Group Holdings S.A. - Key news
                • INEOS Group Holdings S.A. - Key offerings
                • SWOT
              • 14.12 Krishna Group
                • Krishna Group - Overview
                • Krishna Group - Product / Service
                • Krishna Group - Key offerings
                • SWOT
              • 14.13 KS Aktiengesellschaft
                • KS Aktiengesellschaft - Overview
                • KS Aktiengesellschaft - Product / Service
                • KS Aktiengesellschaft - Key offerings
                • SWOT
              • 14.14 Mitsui and Co. Ltd.
                • Mitsui and Co. Ltd. - Overview
                • Mitsui and Co. Ltd. - Business segments
                • Mitsui and Co. Ltd. - Key news
                • Mitsui and Co. Ltd. - Key offerings
                • Mitsui and Co. Ltd. - Segment focus
                • SWOT
              • 14.15 Nahta Salt AND Chemicals Pvt Ltd.
                • Nahta Salt AND Chemicals Pvt Ltd. - Overview
                • Nahta Salt AND Chemicals Pvt Ltd. - Product / Service
                • Nahta Salt AND Chemicals Pvt Ltd. - Key offerings
                • SWOT
              • 14.16 Rio Tinto Ltd.
                • Rio Tinto Ltd. - Overview
                • Rio Tinto Ltd. - Business segments
                • Rio Tinto Ltd. - Key news
                • Rio Tinto Ltd. - Key offerings
                • Rio Tinto Ltd. - Segment focus
                • SWOT
              • 14.17 Tata Chemicals Ltd.
                • Tata Chemicals Ltd. - Overview
                • Tata Chemicals Ltd. - Business segments
                • Tata Chemicals Ltd. - Key offerings
                • Tata Chemicals Ltd. - Segment focus
                • SWOT
              • 14.18 Usb Chemicals
                • Usb Chemicals - Overview
                • Usb Chemicals - Product / Service
                • Usb Chemicals - Key offerings
                • SWOT

              15 Appendix

              • 15.1 Scope of the report
                • 15.2 Inclusions and exclusions checklist
                  • Inclusions checklist
                  • Exclusions checklist
                • 15.3 Currency conversion rates for US$
                  • Currency conversion rates for US$
                • 15.4 Research methodology
                  • Research methodology
                • 15.5 Data procurement
                  • Information sources
                • 15.6 Data validation
                  • Data validation
                • 15.7 Validation techniques employed for market sizing
                  • Validation techniques employed for market sizing
                • 15.8 Data synthesis
                  • Data synthesis
                • 15.9 360 degree market analysis
                  • 360 degree market analysis
                • 15.10 List of abbreviations
                  • List of abbreviations
                  • o Strong operational management
                  • o Strong market position
                  • o Diversification in products for specific applications
                  • o Strong infrastructure base
                  • o Strong market position
                  • o Strong infrastructure base
                  • o Strong geographic presence
                  • o Strong operational management
                  • o Strong geographic presence
                  • o Economies of scale
                  • o Strong operational management
                  • o Strong market position
                  • o Strong operational management
                  • o Stable customer base
                  • o Strong geographic presence
                  • o Strong market position
                  • o Strong infrastructure base

                Research Methodology

                Technavio presents a detailed picture of the market by way of study, synthesis, and summation of data from multiple sources. The analysts have presented the various facets of the market with a particular focus on identifying the key industry influencers. The data thus presented is comprehensive, reliable, and the result of extensive research, both primary and secondary.

                INFORMATION SOURCES

                Primary sources

                • Manufacturers and suppliers
                • Channel partners
                • Industry experts
                • Strategic decision makers

                Secondary sources

                • Industry journals and periodicals
                • Government data
                • Financial reports of key industry players
                • Historical data
                • Press releases

                DATA ANALYSIS

                Data Synthesis

                • Collation of data
                • Estimation of key figures
                • Analysis of derived insights

                Data Validation

                • Triangulation with data models
                • Reference against proprietary databases
                • Corroboration with industry experts

                REPORT WRITING

                Qualitative

                • Market drivers
                • Market challenges
                • Market trends
                • Five forces analysis

                Quantitative

                • Market size and forecast
                • Market segmentation
                • Geographical insights
                • Competitive landscape

                Interested in this report?

                Get your sample now to see our research methodology and insights!

                Download Now

                Frequently Asked Questions

                Bagged Industrial Salt market growth will increase by $ 328 mn during 2025-2029 .

                The Bagged Industrial Salt market is expected to grow at a CAGR of 1.2% during 2025-2029 .

                Bagged Industrial Salt market is segmented by Product Type( Fine, Coarse) Application( Chemical industry, De-icing, Food processing industry, Water treatment, Others)

                ANGEL CHEMICALS Pvt, Ltd., Archean Chemical Industries Ltd., Benzer Multitech India Pvt Ltd., Cargill Inc., Delmon Group, Dhaval Enterprises, Dominion Salt Ltd., Donald Brown Group, INEOS Group Holdings S.A., Krishna Group, KS Aktiengesellschaft, Mitsui and Co. Ltd., Nahta Salt AND Chemicals Pvt Ltd., Namco Pools, Rio Tinto Ltd., Tata Chemicals Ltd., Usb Chemicals are a few of the key vendors in the Bagged Industrial Salt market.

                APAC will register the highest growth rate of 61% among the other regions. Therefore, the Bagged Industrial Salt market in APAC is expected to garner significant business opportunities for the vendors during the forecast period.

                China, US, India, Canada, Germany

                • Increasing salt explorationThe global bagged industrial salt market is being significantly driven by the increasing exploration of salt deposits. This trend is particularly evident in regions with rich salt reserves is the driving factor this market.
                • where new exploration licenses are being granted to boost production and meet rising global demand.In a notable development is the driving factor this market.
                • In July 2024 is the driving factor this market.
                • Saudi Arabia awarded exploration licenses for salt deposits in the Eastern Province Sabkha Ras Al-Qaryah. This initiative is the driving factor this market.
                • following a competitive tendering process is the driving factor this market.
                • saw four companies includingKhalid Al-Zahid and Sons Co. is the driving factor this market.
                • Ibrahim Al-Issa and Partner Salt Co. is the driving factor this market.
                • Riyadh Salt Industry Co. is the driving factor this market.
                • and Rastan Limited is the driving factor this market.
                • securing the rights to explore these deposits. This move is expected to significantly enhance the  salt production capabilities of country. The granting of new exploration licenses is poised to increase the availability of raw salt is the driving factor this market.
                • which is crucial for various industrial applications. By tapping into previously underutilized salt deposits is the driving factor this market.
                • these companies can boost their production volumes is the driving factor this market.
                • ensuring a more stable and reliable supply chain. This is particularly important for industries that rely heavily on industrial salt is the driving factor this market.
                • such as chemical manufacturing and water treatment. The exploration and subsequent development of new salt deposits bring substantial economic benefits. For the companies involved is the driving factor this market.
                • securing exploration licenses represents a strategic opportunity to expand their market presence and capitalize on the growing demand for industrial salt.As more regions recognize the economic potential of their salt reserves is the driving factor this market.
                • the trend of increasing salt exploration is expected to continue. This will not only drive growth in the global bagged industrial salt market but also support the broader industrial ecosystem by ensuring a steady supply of this essential raw material. The proactive approach of countries like Saudi Arabia in granting exploration licenses sets a precedent for other regions to follow is the driving factor this market.
                • further bolstering the global bagged industrial salt market. is the driving factor this market.

                The Bagged Industrial Salt market vendors should focus on grabbing business opportunities from the Fine segment as it accounted for the largest market share in the base year.