Ballast Water Management Market Analysis APAC, Europe, North America, Middle East and Africa, South America - Singapore, China, US, UK, Norway - Size and Forecast 2024-2028

Ballast Water Management Market Analysis APAC, Europe, North America, Middle East and Africa, South America - Singapore, China, US, UK, Norway - Size and Forecast 2024-2028

Published: Aug 2024 183 Pages SKU: IRTNTR44125

Market Overview at a Glance

$210.78 B
Market Opportunity
41.75%
CAGR
33.49
YoY growth 2023-2024(%)

Ballast Water Management Market Size 2024-2028

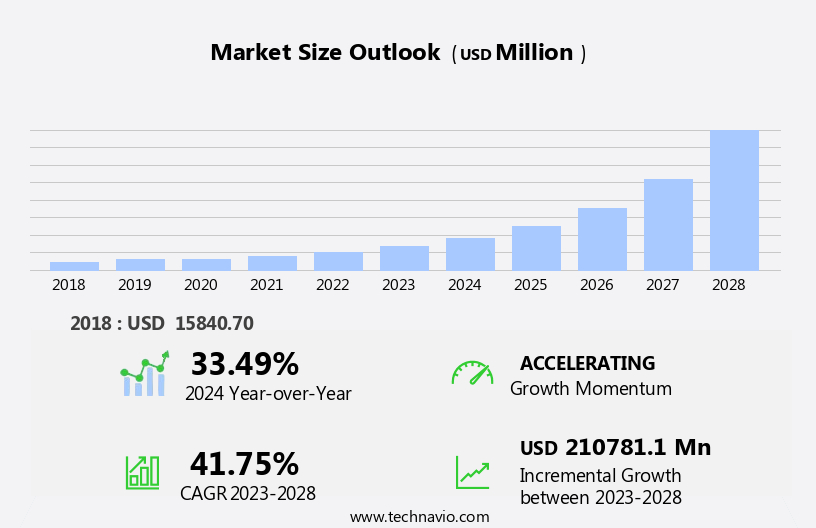
The ballast water management market size is forecast to increase by USD 210.78 billion, at a CAGR of 41.75% between 2023 and 2028.

  • The market is driven by the growing concern for the adverse impact of untreated ballast water on the marine environment. With the increasing number of sea-borne trades, the volume of ballast water being transported globally has surged, leading to the introduction of stringent regulations to mitigate the environmental risks.  Maritime transport is important in cross-border transport networks and the key pillar of globalization that facilitates international trade and supports supply chains. However, the high cost of implementing ballast water management systems poses a significant challenge for market growth. The implementation of these systems requires substantial investment in technology and infrastructure, which can be a barrier for smaller shipping companies and vessels.
  • Despite this, the market presents opportunities for innovation and cost-effective solutions to address the environmental concerns while minimizing financial burdens for stakeholders. Companies that can offer affordable, efficient, and compliant ballast water management systems will be well-positioned to capitalize on the market's potential.

What will be the Size of the Ballast Water Management Market during the forecast period?

Ballast Water Management Market Size

Explore in-depth regional segment analysis with market size data - historical 2018-2022 and forecasts 2024-2028 - in the full report.  
Request Free Sample

The market continues to evolve, driven by the need to mitigate the introduction and spread of marine invasive species through the exchange of ballast water. This market encompasses various applications, from species identification and ballast water sampling to system automation and reliability assessment. Biofouling control methods, such as chlorination residual monitoring and filtration membrane efficiency, play a crucial role in maintaining treatment system capacity and ensuring compliance with discharge permits. Pressure filtration and microbial analysis are essential components of these systems, with maintenance intervals and energy efficiency metrics being key considerations for operators. Industry growth in this sector is expected to remain robust, with a recent study estimating a compound annual growth rate of over 10% through 2026.

For instance, a major shipping line reported a 15% increase in sales due to the implementation of advanced ballast water treatment systems, incorporating technologies like electrochlorination, ultraviolet sterilization, and sedimentation tank design. Moreover, the focus on real-time monitoring, sensor data acquisition, and compliance reporting is leading to the development of innovative solutions, such as remote monitoring systems, chemical dosage control, and organism detection systems. These advancements aim to optimize flow rate, enhance treatment efficacy, and minimize environmental impact. In conclusion, the market remains a dynamic and evolving landscape, with ongoing efforts to improve system performance, reduce operational costs, and ensure regulatory compliance.

This market's continuous unfolding is shaped by the interplay of various factors, including technological advancements, environmental concerns, and regulatory requirements.

How is this Ballast Water Management Industry segmented?

The ballast water management industry research report provides comprehensive data (region-wise segment analysis), with forecasts and estimates in "USD million" for the period 2024-2028, as well as historical data from 2018-2022 for the following segments.

  • End-user
    • Container ships
    • Bulk carriers
    • Oil tankers
    • General cargo
  • Technology
    • Physical disinfection
    • Chemical method
    • Mechanical method
  • Geography
    • North America
      • US
    • Europe
      • Norway
      • UK
    • APAC
      • China
      • Singapore
    • Rest of World (ROW)

By End-user Insights

The container ships segment is estimated to witness significant growth during the forecast period.

Container ships, which utilize containerization for faster cargo loading and discharging, are increasingly adopting ballast water management systems (BWMS) to comply with stringent regulations preventing the spread of invasive species. This market trend is driven not only by regulatory requirements but also by growing environmental consciousness and the importance of preserving marine ecosystems. BWMS incorporate various technologies such as system automation, system reliability assessment, biofouling control methods, chlorination residual monitoring, filtration membrane efficiency, pressure filtration, microbial analysis, and maintenance interval optimization. Energy efficiency metrics are also a crucial consideration, with technologies like electrochlorination and ultraviolet sterilization being employed for their eco-friendliness.

The industry is expected to grow significantly, with a recent study estimating that the market will reach a value of over 5 billion USD by 2025. This growth is attributed to the increasing demand for eco-friendly solutions, advancements in technology, and the implementation of stricter regulations. For instance, a leading container shipping company reported a 25% reduction in operational costs after implementing a BWMS with real-time monitoring capabilities and sensor data acquisition. This not only improved treatment efficacy but also ensured compliance with discharge permits and water quality monitoring requirements. The market dynamics are further influenced by factors such as treatment system capacity, flow rate optimization, and chemical dosage control.

Companies are also focusing on developing advanced UV disinfection systems, organism detection, and data logging systems to enhance system performance and reduce environmental impact. In conclusion, the container shipping industry's shift towards eco-friendly ballast water management systems is a significant trend driven by regulatory requirements and environmental concerns. The market is witnessing rapid growth, with advancements in technology and a focus on energy efficiency and operational cost savings.

Ballast Water Management Market Size

Request Free Sample

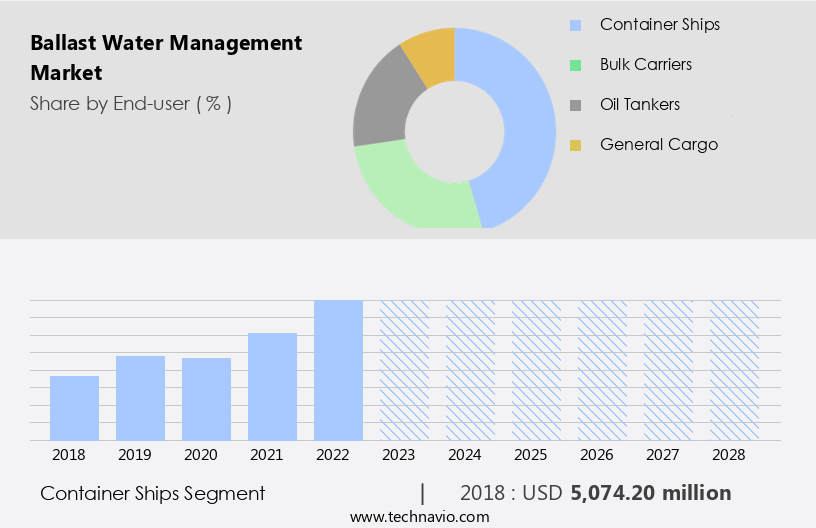
The Container ships segment was valued at USD 5.07 billion in 2018 and showed a gradual increase during the forecast period.

Regional Analysis

APAC is estimated to contribute 45% to the growth of the global market during the forecast period. Technavio's analysts have elaborately explained the regional trends and drivers that shape the market during the forecast period.

Ballast Water Management Market Share by Geography

 Request Free Sample

The shipping industry's expansion in the Asia Pacific (APAC) region, driven by China's central role in global trade, is fueling a significant increase in ballast water generation. With China projected to control over 50% of the shipping industry's financing market by 2025, the demand for ballast water management systems is surging. Compliance with the Ballast Water Management Convention (BWM Convention) regulations, which took effect in September 2017 for new build vessels, is a major factor driving this demand. Ballast water management systems help prevent the transfer of marine invasive species during ship voyages. These systems employ various technologies, including filtration membranes with high efficiency, pressure filtration, ultraviolet sterilization, electrochlorination, and ozonation treatment processes.

System automation and reliability assessment are crucial for ensuring the effective functioning of these systems. Biofouling control methods, such as chlorination residual monitoring, microbial analysis, and sensor data acquisition, play a vital role in maintaining system performance and extending maintenance intervals. Energy efficiency metrics are also essential, as these systems consume substantial energy. Remote monitoring systems and real-time monitoring enable early detection of potential issues and optimize operational costs. An example of the impact of these systems is the reduction of invasive species in the Great Lakes, which experienced a 95% decrease in new invasive species after the implementation of ballast water management regulations.

The market is expected to grow by over 10% annually due to the increasing demand for compliance and the need to mitigate the environmental impact of invasive species.

Market Dynamics

Our researchers analyzed the data with 2023 as the base year, along with the key drivers, trends, and challenges. A holistic analysis of drivers will help companies refine their marketing strategies to gain a competitive advantage.

The market is experiencing significant growth due to increasing regulations aimed at mitigating the environmental impact of ships' ballast water. Effective ballast water treatment systems are essential for ensuring compliance with International Maritime Organization (IMO) guidelines. Designing such systems involves optimizing various processes, including UV disinfection system effectiveness, electrochlorination process optimization, filtration membrane cleaning protocols, and ballast water exchange procedures. The choice of treatment methods, such as ozonation and UV sterilization, depends on factors like water quality, flow rate, and system capacity. For instance, UV sterilization dosage and flow rate optimization strategies are critical for ensuring the system's efficiency. Pressure filtration systems require regular maintenance to maintain system reliability and assess criteria like chlorination residual monitoring techniques. Biofouling control method selection is another crucial aspect of ballast water management. Energy efficiency improvement strategies and operational cost reduction methods are also essential considerations for shipowners and operators. Water quality parameter monitoring, sensor data acquisition protocols, and compliance reporting documentation are integral parts of maintaining regulatory compliance. Remote monitoring system integration is becoming increasingly popular in the market, enabling real-time system performance analysis and proactive maintenance. Effective implementation of these technologies can lead to significant operational cost savings and improved system reliability. Overall, the market is evolving rapidly, driven by regulatory requirements and technological advancements.

What are the key market drivers leading to the rise in the adoption of Ballast Water Management Industry?

  • The significant negative effects of untreated ballast water on the marine environment serve as the primary market catalyst. 
  • Ballast water is an essential component of a ship's stability system, taken onboard during voyages and adjusted as cargo is loaded and unloaded. However, this water may harbor non-native organisms that, upon release into new environments, can outcompete native species, leading to ecological imbalance and potential economic losses. The Nonindigenous Aquatic Nuisance Prevention and Control Act of 1990 defines invasive species as non-native organisms that threaten native species, ecological stability, and commercial and recreational activities. The market is growing significantly due to increasing regulations and awareness of the environmental and economic consequences of invasive species. For instance, a study published in the journal "Science" estimated that invasive species cost the United States USD 137 billion annually.
  • As a result, the market for ballast water treatment technologies is expected to grow by over 10% per year. A leading ballast water treatment technology provider reported a 25% increase in sales in 2020 due to increased demand for compliance with international regulations.

What are the market trends shaping the Ballast Water Management Industry?

  • The increasing trend in seaborne trade represents a significant market development. Seaborne trade is experiencing a notable growth in popularity.
  • The maritime transport sector plays a crucial role in global trade and the manufacturing supply chain, as it accounts for over 70% of the world's merchandise trade by volume. The trade volume has experienced a steady growth of nearly 10% over the last decade, primarily due to the increasing consumer demand in developing countries. The demand for maritime transport has been on a steady rise for the past five years, leading to a significant increase in the number of imports and exports worldwide. This trend is expected to continue, with future growth projected at around 15%. The robust expansion of international trade and the growing reliance on global supply chains are key factors driving the demand for maritime transport services.

What challenges does the Ballast Water Management Industry face during its growth?

  • The high cost of implementing and maintaining ballast water management systems poses a significant challenge to the growth of the maritime industry. This mandatory expense, which ensures compliance with regulations aimed at preventing the spread of invasive species, adds to operational costs and may hinder the industry's progress. 
  • The market is undergoing a significant transformation due to the mandatory shift from ballast water exchange to treatment systems. This transition entails substantial capital expenditures, which vary depending on whether existing pipework can be modified or new air pipework must be installed. The costs associated with this change include delay in shipping, higher capital and running costs, exchange costs, treatment costs, and enforcement costs.
  • For instance, installing a ballast water management system on a very large crude carrier can amount to approximately USD 25 per dwt. According to industry reports, the market is projected to grow at a robust rate, with an estimated 40% of the world's merchant fleet expected to have compliant systems by 2023.

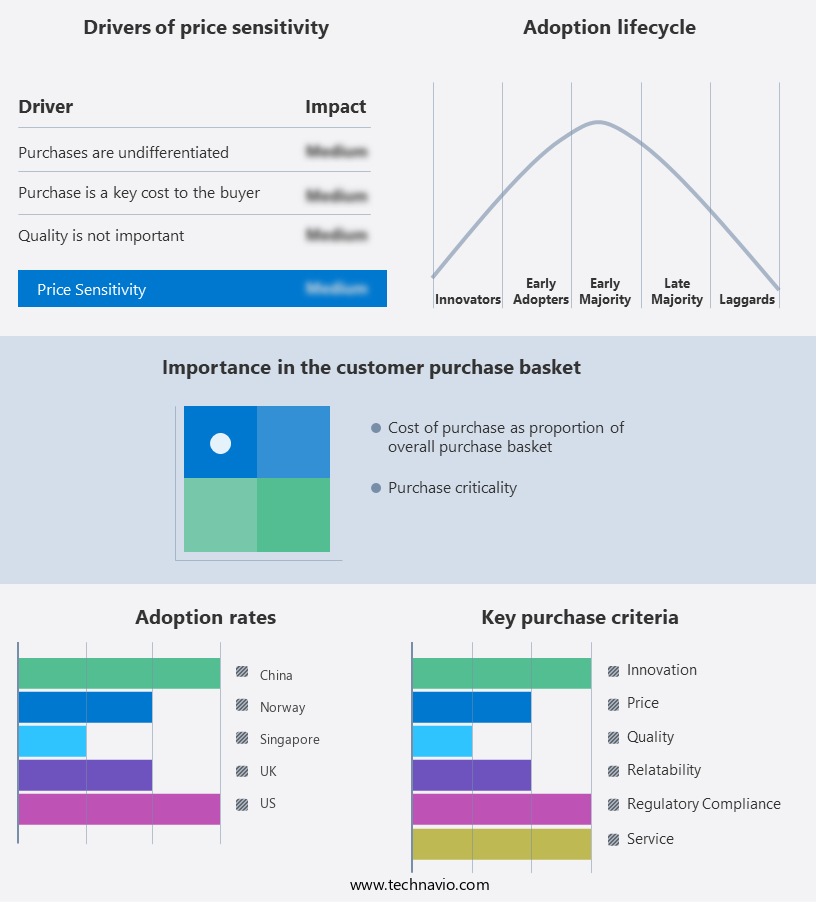
Exclusive Customer Landscape

The ballast water management market forecasting report includes the adoption lifecycle of the market, covering from the innovator's stage to the laggard's stage. It focuses on adoption rates in different regions based on penetration. Furthermore, the ballast water management market report also includes key purchase criteria and drivers of price sensitivity to help companies evaluate and develop their market growth analysis strategies.

Ballast Water Management Market Share by Geography

 Customer Landscape

Key Companies & Market Insights

Companies are implementing various strategies, such as strategic alliances, ballast water management market forecast, partnerships, mergers and acquisitions, geographical expansion, and product/service launches, to enhance their presence in the industry.

AB SKF - This company specializes in the development and distribution of innovative sports products, leveraging advanced technology and research to enhance athlete performance and consumer experience. 

The industry research and growth report includes detailed analyses of the competitive landscape of the market and information about key companies, including:

  • AB SKF
  • ALFA LAVAL
  • BioMicrobics Inc.
  • BIO UV Group
  • Calgon Carbon Corp.
  • Ecochlor Inc.
  • Evoqua Water Technologies LLC
  • GEA Group AG
  • Headway Technology Group Qingdao Co. Ltd.
  • Industrie De Nora Spa
  • JFE Holdings Inc.
  • KURARAY Co. Ltd.
  • Mitsubishi Heavy Industries Ltd.
  • Optimarin AS
  • PANASIA Co. Ltd.
  • Samsung Electronics Co. Ltd.
  • TECHCROSS
  • Veolia Environnement SA
  • Wartsila Corp.
  • Xylem Inc.

Qualitative and quantitative analysis of companies has been conducted to help clients understand the wider business environment as well as the strengths and weaknesses of key industry players. Data is qualitatively analyzed to categorize companies as pure play, category-focused, industry-focused, and diversified; it is quantitatively analyzed to categorize companies as dominant, leading, strong, tentative, and weak.

Recent Development and News in Ballast Water Management Market

  • In January 2024, the International Maritime Organization (IMO) approved the revised Ballast Water Management (BWM) Convention, entering into force on September 8, 2024. This amended convention set a stricter implementation timeline for ballast water management systems (BWMS) on ships (IMO, 2024).
  • In March 2024, General Electric Company (GE) and Hyundai Heavy Industries (HHI) announced a strategic partnership to co-develop advanced BWMS technologies, integrating GE's marine solutions with HHI's shipbuilding expertise (GE, 2024).
  • In May 2024, ClassNK, a leading classification society, received approval from the Japanese Ministry of Land, Infrastructure, Transport and Tourism to type approve the first UV-based BWMS, marking a significant technological advancement in the market (ClassNK, 2024).
  • In April 2025, Wärtsilä, a Finnish technology group, secured a € 20 million (USD 22.5 million) contract from the European Investment Bank to supply BWMS to 25 vessels in Europe, further expanding its market presence (Wärtsilä, 2025).

Research Analyst Overview

  • The market for ballast water management systems continues to evolve, driven by stringent discharge standards compliance and growing environmental concerns. The electrolysis process and chemical consumption remain key components, with inert gas generators and chlorine dioxide generation gaining traction. Advanced technologies, such as flow cytometry analysis, automation level, residual level detection, data analysis, and performance testing, are increasingly adopted for operational efficiency and system validation. For instance, a recent study revealed a 25% increase in sales for a leading ballast water treatment provider due to the integration of automation and data analysis in their systems. The industry anticipates a 10% annual growth rate, driven by the need for effective ballast water treatment across various vessel types and the ongoing development of more sophisticated technologies.
  • Beyond regulatory compliance, environmental impact is a significant factor. Mechanical filtration, UV intensity measurement, power consumption, and system lifecycle cost are essential considerations for vessel operators. Performance testing, system validation, and monitoring frequency ensure treatment effectiveness and species diversity index, ultimately safeguarding marine ecosystems.

Dive into Technavio's robust research methodology, blending expert interviews, extensive data synthesis, and validated models for unparalleled Ballast Water Management Market insights. See full methodology.

Market Scope

Report Coverage

Details

Page number

183

Base year

2023

Historic period

2018-2022

Forecast period

2024-2028

Growth momentum & CAGR

Accelerate at a CAGR of 41.75%

Market growth 2024-2028

USD 210781.1 million

Market structure

Fragmented

YoY growth 2023-2024(%)

33.49

Key countries

Singapore, China, US, UK, and Norway

Competitive landscape

Leading Companies, Market Positioning of Companies, Competitive Strategies, and Industry Risks

Request Free Sample

What are the Key Data Covered in this Ballast Water Management Market Research and Growth Report?

  • CAGR of the Ballast Water Management industry during the forecast period
  • Detailed information on factors that will drive the growth and forecasting between 2024 and 2028
  • Precise estimation of the size of the market and its contribution of the industry in focus to the parent market
  • Accurate predictions about upcoming growth and trends and changes in consumer behaviour
  • Growth of the market across APAC, Europe, North America, Middle East and Africa, and South America
  • Thorough analysis of the market's competitive landscape and detailed information about companies
  • Comprehensive analysis of factors that will challenge the ballast water management market growth of industry companies

We can help! Our analysts can customize this ballast water management market research report to meet your requirements.

Get in touch

1 Executive Summary

  • 1.1 Market overview
    • Executive Summary - Chart on Market Overview
    • Executive Summary - Data Table on Market Overview
    • Executive Summary - Chart on Global Market Characteristics
    • Executive Summary - Chart on Market by Geography
    • Executive Summary - Chart on Market Segmentation by End-user
    • Executive Summary - Chart on Market Segmentation by Technology
    • Executive Summary - Chart on Incremental Growth
    • Executive Summary - Data Table on Incremental Growth
    • Executive Summary - Chart on Company Market Positioning

2 Market Landscape

  • 2.1 Market ecosystem
    • Parent Market
    • Data Table on - Parent Market
  • 2.2 Market characteristics
    • Market characteristics analysis
  • 2.3 Value chain analysis
    • Value Chain Analysis

3 Market Sizing

  • 3.1 Market definition
    • Offerings of companies included in the market definition
  • 3.2 Market segment analysis
    • Market segments
  • 3.3 Market size 2023
    • 3.4 Market outlook: Forecast for 2023-2028
      • Chart on Global - Market size and forecast 2023-2028 ($ million)
      • Data Table on Global - Market size and forecast 2023-2028 ($ million)
      • Chart on Global Market: Year-over-year growth 2023-2028 (%)
      • Data Table on Global Market: Year-over-year growth 2023-2028 (%)

    4 Historic Market Size

    • 4.1 Global Ballast Water Management Market 2018 - 2022
      • Historic Market Size - Data Table on Global Ballast Water Management Market 2018 - 2022 ($ million)
    • 4.2 End-user segment analysis 2018 - 2022
      • Historic Market Size - End-user Segment 2018 - 2022 ($ million)
    • 4.3 Technology segment analysis 2018 - 2022
      • Historic Market Size - Technology Segment 2018 - 2022 ($ million)
    • 4.4 Geography segment analysis 2018 - 2022
      • Historic Market Size - Geography Segment 2018 - 2022 ($ million)
    • 4.5 Country segment analysis 2018 - 2022
      • Historic Market Size - Country Segment 2018 - 2022 ($ million)

    5 Five Forces Analysis

    • 5.1 Five forces summary
      • Five forces analysis - Comparison between 2023 and 2028
    • 5.2 Bargaining power of buyers
      • Bargaining power of buyers - Impact of key factors 2023 and 2028
    • 5.3 Bargaining power of suppliers
      • Bargaining power of suppliers - Impact of key factors in 2023 and 2028
    • 5.4 Threat of new entrants
      • Threat of new entrants - Impact of key factors in 2023 and 2028
    • 5.5 Threat of substitutes
      • Threat of substitutes - Impact of key factors in 2023 and 2028
    • 5.6 Threat of rivalry
      • Threat of rivalry - Impact of key factors in 2023 and 2028
    • 5.7 Market condition
      • Chart on Market condition - Five forces 2023 and 2028

    6 Market Segmentation by End-user

    • 6.1 Market segments
      • Chart on End-user - Market share 2023-2028 (%)
      • Data Table on End-user - Market share 2023-2028 (%)
    • 6.2 Comparison by End-user
      • Chart on Comparison by End-user
      • Data Table on Comparison by End-user
    • 6.3 Container ships - Market size and forecast 2023-2028
      • Chart on Container ships - Market size and forecast 2023-2028 ($ million)
      • Data Table on Container ships - Market size and forecast 2023-2028 ($ million)
      • Chart on Container ships - Year-over-year growth 2023-2028 (%)
      • Data Table on Container ships - Year-over-year growth 2023-2028 (%)
    • 6.4 Bulk carriers - Market size and forecast 2023-2028
      • Chart on Bulk carriers - Market size and forecast 2023-2028 ($ million)
      • Data Table on Bulk carriers - Market size and forecast 2023-2028 ($ million)
      • Chart on Bulk carriers - Year-over-year growth 2023-2028 (%)
      • Data Table on Bulk carriers - Year-over-year growth 2023-2028 (%)
    • 6.5 Oil tankers - Market size and forecast 2023-2028
      • Chart on Oil tankers - Market size and forecast 2023-2028 ($ million)
      • Data Table on Oil tankers - Market size and forecast 2023-2028 ($ million)
      • Chart on Oil tankers - Year-over-year growth 2023-2028 (%)
      • Data Table on Oil tankers - Year-over-year growth 2023-2028 (%)
    • 6.6 General cargo - Market size and forecast 2023-2028
      • Chart on General cargo - Market size and forecast 2023-2028 ($ million)
      • Data Table on General cargo - Market size and forecast 2023-2028 ($ million)
      • Chart on General cargo - Year-over-year growth 2023-2028 (%)
      • Data Table on General cargo - Year-over-year growth 2023-2028 (%)
    • 6.7 Market opportunity by End-user
      • Market opportunity by End-user ($ million)
      • Data Table on Market opportunity by End-user ($ million)

    7 Market Segmentation by Technology

    • 7.1 Market segments
      • Chart on Technology - Market share 2023-2028 (%)
      • Data Table on Technology - Market share 2023-2028 (%)
    • 7.2 Comparison by Technology
      • Chart on Comparison by Technology
      • Data Table on Comparison by Technology
    • 7.3 Physical disinfection - Market size and forecast 2023-2028
      • Chart on Physical disinfection - Market size and forecast 2023-2028 ($ million)
      • Data Table on Physical disinfection - Market size and forecast 2023-2028 ($ million)
      • Chart on Physical disinfection - Year-over-year growth 2023-2028 (%)
      • Data Table on Physical disinfection - Year-over-year growth 2023-2028 (%)
    • 7.4 Chemical method - Market size and forecast 2023-2028
      • Chart on Chemical method - Market size and forecast 2023-2028 ($ million)
      • Data Table on Chemical method - Market size and forecast 2023-2028 ($ million)
      • Chart on Chemical method - Year-over-year growth 2023-2028 (%)
      • Data Table on Chemical method - Year-over-year growth 2023-2028 (%)
    • 7.5 Mechanical method - Market size and forecast 2023-2028
      • Chart on Mechanical method - Market size and forecast 2023-2028 ($ million)
      • Data Table on Mechanical method - Market size and forecast 2023-2028 ($ million)
      • Chart on Mechanical method - Year-over-year growth 2023-2028 (%)
      • Data Table on Mechanical method - Year-over-year growth 2023-2028 (%)
    • 7.6 Market opportunity by Technology
      • Market opportunity by Technology ($ million)
      • Data Table on Market opportunity by Technology ($ million)

    8 Customer Landscape

    • 8.1 Customer landscape overview
      • Analysis of price sensitivity, lifecycle, customer purchase basket, adoption rates, and purchase criteria

    9 Geographic Landscape

    • 9.1 Geographic segmentation
      • Chart on Market share by geography 2023-2028 (%)
      • Data Table on Market share by geography 2023-2028 (%)
    • 9.2 Geographic comparison
      • Chart on Geographic comparison
      • Data Table on Geographic comparison
    • 9.3 APAC - Market size and forecast 2023-2028
      • Chart on APAC - Market size and forecast 2023-2028 ($ million)
      • Data Table on APAC - Market size and forecast 2023-2028 ($ million)
      • Chart on APAC - Year-over-year growth 2023-2028 (%)
      • Data Table on APAC - Year-over-year growth 2023-2028 (%)
    • 9.4 Europe - Market size and forecast 2023-2028
      • Chart on Europe - Market size and forecast 2023-2028 ($ million)
      • Data Table on Europe - Market size and forecast 2023-2028 ($ million)
      • Chart on Europe - Year-over-year growth 2023-2028 (%)
      • Data Table on Europe - Year-over-year growth 2023-2028 (%)
    • 9.5 North America - Market size and forecast 2023-2028
      • Chart on North America - Market size and forecast 2023-2028 ($ million)
      • Data Table on North America - Market size and forecast 2023-2028 ($ million)
      • Chart on North America - Year-over-year growth 2023-2028 (%)
      • Data Table on North America - Year-over-year growth 2023-2028 (%)
    • 9.6 Middle East and Africa - Market size and forecast 2023-2028
      • Chart on Middle East and Africa - Market size and forecast 2023-2028 ($ million)
      • Data Table on Middle East and Africa - Market size and forecast 2023-2028 ($ million)
      • Chart on Middle East and Africa - Year-over-year growth 2023-2028 (%)
      • Data Table on Middle East and Africa - Year-over-year growth 2023-2028 (%)
    • 9.7 South America - Market size and forecast 2023-2028
      • Chart on South America - Market size and forecast 2023-2028 ($ million)
      • Data Table on South America - Market size and forecast 2023-2028 ($ million)
      • Chart on South America - Year-over-year growth 2023-2028 (%)
      • Data Table on South America - Year-over-year growth 2023-2028 (%)
    • 9.8 Singapore - Market size and forecast 2023-2028
      • Chart on Singapore - Market size and forecast 2023-2028 ($ million)
      • Data Table on Singapore - Market size and forecast 2023-2028 ($ million)
      • Chart on Singapore - Year-over-year growth 2023-2028 (%)
      • Data Table on Singapore - Year-over-year growth 2023-2028 (%)
    • 9.9 China - Market size and forecast 2023-2028
      • Chart on China - Market size and forecast 2023-2028 ($ million)
      • Data Table on China - Market size and forecast 2023-2028 ($ million)
      • Chart on China - Year-over-year growth 2023-2028 (%)
      • Data Table on China - Year-over-year growth 2023-2028 (%)
    • 9.10 US - Market size and forecast 2023-2028
      • Chart on US - Market size and forecast 2023-2028 ($ million)
      • Data Table on US - Market size and forecast 2023-2028 ($ million)
      • Chart on US - Year-over-year growth 2023-2028 (%)
      • Data Table on US - Year-over-year growth 2023-2028 (%)
    • 9.11 UK - Market size and forecast 2023-2028
      • Chart on UK - Market size and forecast 2023-2028 ($ million)
      • Data Table on UK - Market size and forecast 2023-2028 ($ million)
      • Chart on UK - Year-over-year growth 2023-2028 (%)
      • Data Table on UK - Year-over-year growth 2023-2028 (%)
    • 9.12 Norway - Market size and forecast 2023-2028
      • Chart on Norway - Market size and forecast 2023-2028 ($ million)
      • Data Table on Norway - Market size and forecast 2023-2028 ($ million)
      • Chart on Norway - Year-over-year growth 2023-2028 (%)
      • Data Table on Norway - Year-over-year growth 2023-2028 (%)
    • 9.13 Market opportunity by geography
      • Market opportunity by geography ($ million)
      • Data Tables on Market opportunity by geography ($ million)

    10 Drivers, Challenges, and Opportunity/Restraints

    • 10.1 Market drivers
      • 10.2 Market challenges
        • 10.3 Impact of drivers and challenges
          • Impact of drivers and challenges in 2023 and 2028
        • 10.4 Market opportunities/restraints

          11 Competitive Landscape

          • 11.1 Overview
            • 11.2 Competitive Landscape
              • Overview on criticality of inputs and factors of differentiation
            • 11.3 Landscape disruption
              • Overview on factors of disruption
            • 11.4 Industry risks
              • Impact of key risks on business

            12 Competitive Analysis

            • 12.1 Companies profiled
              • Companies covered
            • 12.2 Market positioning of companies
              • Matrix on companies position and classification
            • 12.3 AB SKF
              • AB SKF - Overview
              • AB SKF - Business segments
              • AB SKF - Key news
              • AB SKF - Key offerings
              • AB SKF - Segment focus
            • 12.4 Alfa Laval AB
              • Alfa Laval AB - Overview
              • Alfa Laval AB - Business segments
              • Alfa Laval AB - Key news
              • Alfa Laval AB - Key offerings
              • Alfa Laval AB - Segment focus
            • 12.5 Ecochlor Inc.
              • Ecochlor Inc. - Overview
              • Ecochlor Inc. - Product / Service
              • Ecochlor Inc. - Key offerings
            • 12.6 Evoqua Water Technologies LLC
              • Evoqua Water Technologies LLC - Overview
              • Evoqua Water Technologies LLC - Business segments
              • Evoqua Water Technologies LLC - Key news
              • Evoqua Water Technologies LLC - Key offerings
              • Evoqua Water Technologies LLC - Segment focus
            • 12.7 GEA Group AG
              • GEA Group AG - Overview
              • GEA Group AG - Business segments
              • GEA Group AG - Key news
              • GEA Group AG - Key offerings
              • GEA Group AG - Segment focus
            • 12.8 Headway Technology Group Qingdao Co. Ltd.
              • Headway Technology Group Qingdao Co. Ltd. - Overview
              • Headway Technology Group Qingdao Co. Ltd. - Product / Service
              • Headway Technology Group Qingdao Co. Ltd. - Key offerings
            • 12.9 Industrie De Nora Spa
              • Industrie De Nora Spa - Overview
              • Industrie De Nora Spa - Business segments
              • Industrie De Nora Spa - Key news
              • Industrie De Nora Spa - Key offerings
              • Industrie De Nora Spa - Segment focus
            • 12.10 JFE Holdings Inc.
              • JFE Holdings Inc. - Overview
              • JFE Holdings Inc. - Business segments
              • JFE Holdings Inc. - Key news
              • JFE Holdings Inc. - Key offerings
              • JFE Holdings Inc. - Segment focus
            • 12.11 KURARAY Co. Ltd.
              • KURARAY Co. Ltd. - Overview
              • KURARAY Co. Ltd. - Business segments
              • KURARAY Co. Ltd. - Key news
              • KURARAY Co. Ltd. - Key offerings
              • KURARAY Co. Ltd. - Segment focus
            • 12.12 Optimarin AS
              • Optimarin AS - Overview
              • Optimarin AS - Product / Service
              • Optimarin AS - Key offerings
            • 12.13 PANASIA Co. Ltd.
              • PANASIA Co. Ltd. - Overview
              • PANASIA Co. Ltd. - Product / Service
              • PANASIA Co. Ltd. - Key offerings
            • 12.14 Samsung Electronics Co. Ltd.
              • Samsung Electronics Co. Ltd. - Overview
              • Samsung Electronics Co. Ltd. - Business segments
              • Samsung Electronics Co. Ltd. - Key news
              • Samsung Electronics Co. Ltd. - Key offerings
              • Samsung Electronics Co. Ltd. - Segment focus
            • 12.15 Veolia Environnement SA
              • Veolia Environnement SA - Overview
              • Veolia Environnement SA - Business segments
              • Veolia Environnement SA - Key offerings
              • Veolia Environnement SA - Segment focus
            • 12.16 Wartsila Corp.
              • Wartsila Corp. - Overview
              • Wartsila Corp. - Business segments
              • Wartsila Corp. - Key news
              • Wartsila Corp. - Key offerings
              • Wartsila Corp. - Segment focus
            • 12.17 Xylem Inc.
              • Xylem Inc. - Overview
              • Xylem Inc. - Business segments
              • Xylem Inc. - Key news
              • Xylem Inc. - Key offerings
              • Xylem Inc. - Segment focus

            13 Appendix

            • 13.1 Scope of the report
              • 13.2 Inclusions and exclusions checklist
                • Inclusions checklist
                • Exclusions checklist
              • 13.3 Currency conversion rates for US$
                • Currency conversion rates for US$
              • 13.4 Research methodology
                • Research methodology
              • 13.5 Data procurement
                • Information sources
              • 13.6 Data validation
                • Data validation
              • 13.7 Validation techniques employed for market sizing
                • Validation techniques employed for market sizing
              • 13.8 Data synthesis
                • Data synthesis
              • 360 degree market analysis
                • 360 degree market analysis
              • 13.10 List of abbreviations
                • List of abbreviations

              Research Methodology

              Technavio presents a detailed picture of the market by way of study, synthesis, and summation of data from multiple sources. The analysts have presented the various facets of the market with a particular focus on identifying the key industry influencers. The data thus presented is comprehensive, reliable, and the result of extensive research, both primary and secondary.

              INFORMATION SOURCES

              Primary sources

              • Manufacturers and suppliers
              • Channel partners
              • Industry experts
              • Strategic decision makers

              Secondary sources

              • Industry journals and periodicals
              • Government data
              • Financial reports of key industry players
              • Historical data
              • Press releases

              DATA ANALYSIS

              Data Synthesis

              • Collation of data
              • Estimation of key figures
              • Analysis of derived insights

              Data Validation

              • Triangulation with data models
              • Reference against proprietary databases
              • Corroboration with industry experts

              REPORT WRITING

              Qualitative

              • Market drivers
              • Market challenges
              • Market trends
              • Five forces analysis

              Quantitative

              • Market size and forecast
              • Market segmentation
              • Geographical insights
              • Competitive landscape

              Interested in this report?

              Get your sample now to see our research methodology and insights!

              Download Now

              Frequently Asked Questions

              Ballast Water Management market growth will increase by $ 210781.1 mn during 2024-2028.

              The Ballast Water Management market is expected to grow at a CAGR of 41.75% during 2024-2028.

              Ballast Water Management market is segmented by End-user( Container ships, Bulk carriers, Oil tankers, General cargo) Technology( Physical disinfection, Chemical method, Mechanical method, MEA, South America)

              AB SKF, ALFA LAVAL, BioMicrobics Inc., BIO UV Group, Calgon Carbon Corp., Ecochlor Inc., Evoqua Water Technologies LLC, GEA Group AG, Headway Technology Group Qingdao Co. Ltd., Industrie De Nora Spa, JFE Holdings Inc., KURARAY Co. Ltd., Mitsubishi Heavy Industries Ltd., Optimarin AS, PANASIA Co. Ltd., Samsung Electronics Co. Ltd., TECHCROSS, Veolia Environnement SA, Wartsila Corp., Xylem Inc. are a few of the key vendors in the Ballast Water Management market.

              APAC will register the highest growth rate of 45% among the other regions. Therefore, the Ballast Water Management market in APAC is expected to garner significant business opportunities for the vendors during the forecast period.

              Singapore, China, US, UK, Norway

              • Adverse impact of untreated ballast water on marine environmentBallast water is the seawater that ships take onboard and store in the ballast tanks for improving stability and balance during loading and unloading. The ballast water is taken in along the coastal waters when the ship begins the voyage and is adjusted in the journey as the cargo is loaded and unloaded. However is the driving factor this market.
              • the ballast water might contain organisms that are not native to the environment in which they are released. Hence is the driving factor this market.
              • such non-native species begin to out-compete the local species is the driving factor this market.
              • which is supposed to be invasive. According to the Nonindigenous Aquatic Nuisance Prevention and Control Act of 1990 is the driving factor this market.
              • invasive species are defined as non-indigenous species that endanger the abundance or diversity of native species is the driving factor this market.
              • the ecological stability of infested waters is the driving factor this market.
              • and/or any commercial and agricultural facility via aquaculture is the driving factor this market.
              • or recreational activities carried out on such waters. Invasive species can be extremely dangerous is the driving factor this market.
              • particularly in the water systems that can easily spread to other water sources is the driving factor this market.
              • thus adversely affecting the entire marine ecosystem is the driving factor this market.
              • as well as human resources and economy. Some of the popular examples of invasive species include Asian shore crabs and zebra mussels. Asian shore crabs are native of the coastlines of Japan and China. However is the driving factor this market.
              • they have been carried to the US Atlantic coast with the ballast water carried by ships traveling from Japan and China to the US. These crabs prey on the organisms available in the ocean and are highly reproductive in nature is the driving factor this market.
              • thereby allowing them to out-compete several other native crab species along the US Atlantic coast. Similarly is the driving factor this market.
              • zebra mussels are native to the Eastern European region but were carried to the American Great Lakes and the Baltic Sea areas through the ballast water in the ships. Since these mussels are highly invasive and get attached to any hard surface is the driving factor this market.
              • they have resulted in blocking of the irrigation and water intake pumps and displaced the native mollusks. Such invasive species illustrate the adverse impacts of ballast water on the marine environment and coastal or water-based communities. Hence is the driving factor this market.
              • such adverse impact of ballast water on the marine environment as well as the ballast tank coatings creates the need for efficient management of ballast water is the driving factor this market.
              • thereby boosting the growth of the market in focus during the forecast period. is the driving factor this market.

              The Ballast Water Management market vendors should focus on grabbing business opportunities from the Container ships segment as it accounted for the largest market share in the base year.