Cargo Shipping Market Size 2024-2028
The cargo shipping market size is forecast to increase by USD 58.83 billion at a CAGR of 5.05% between 2023 and 2028.
- The market is experiencing significant growth, driven primarily by the increasing global trade volume. The international exchange of goods continues to expand, fueled by the interconnectedness of economies and the rising consumer demand for goods from around the world. This trend is expected to persist, providing ample opportunities for companies in the cargo shipping industry. Dry bulk carriers, gas carriers, and multipurpose vessels are essential to the global shipping industry, each designed to transport specific types of cargo, such as bulk materials, liquefied gases, and various goods. The use of refrigerated containers, flatrack containers, open-top containers, and tank containers ensures efficient transport of perishable goods, oversized items, and liquids across shipping routes.
- Shipping lines alliances are increasingly common to optimize capacity and streamline global logistics. Shipping route optimization plays a critical role in improving efficiency, while container terminal automation and blockchain in shipping enhance transparency and reduce costs. Shipping security and safety remain top priorities, with efforts focusing on cargo theft prevention and regulatory compliance. Green shipping practices are gaining momentum, with fuel efficiency and emissions reduction strategies aimed at reducing the environmental impact of shipping. Shipping risk management, insurance coverage, liability, and claims handling are essential in mitigating operational risks.
- Shipping dispute resolution and legal frameworks, including updates to shipping regulations, provide clear guidelines for resolving conflicts and ensuring compliance. Industry associations contribute to the ongoing development of shipping standards, working to improve sustainability and the overall effectiveness of global shipping. To mitigate these costs, there is a growing emphasis on optimizing logistics networks, implementing fuel-efficient technologies, and exploring alternative energy sources such as liquefied natural gas (LNG) and hydrogen. By staying informed of market trends and proactively addressing challenges, companies can capitalize on the growth opportunities In the market and navigate the complexities of the industry with confidence.
What will be the Size of the Cargo Shipping Market during the forecast period?

Request Free Sample
- The market encompasses the transportation of various goods, including raw materials, manufactured goods, affordable food items, and other commodities, via cargo ships to and from seaports worldwide. This market is characterized by a dynamic interplay between several factors. Global economic growth fuels increased demand for cargo shipping, driving market expansion. Free trade agreements facilitate inter-country trade, further boosting demand. Cargo type and ship type diversity cater to the unique requirements of different industries. Seaports serve as crucial hubs for cargo handling, with cranes and other infrastructure facilitating efficient loading and unloading. Environmental concerns, such as pollution from shipping, are increasingly shaping market regulations.
- Import/export analysis plays a significant role in cargo shipping, with e-commerce and inter-country trade driving significant growth. Low-cost labor and trade liberalization in some regions contribute to competitive pressures. Despite challenges, the market continues to evolve, adapting to changing consumer needs and global economic trends. Waterborne freight transportation remains a vital component of the global supply chain, enabling the seamless movement of goods from production to destination.
How is this Cargo Shipping Industry segmented?
The cargo shipping industry research report provides comprehensive data (region-wise segment analysis), with forecasts and estimates in "USD billion" for the period 2024-2028, as well as historical data from 2018-2022 for the following segments.
- Type
- Dry cargo
- General cargo
- Liquid cargo
- End-user
- Manufacturing
- Food and beverages
- Oil and ores
- Automotive and others
- Geography
- North America
- Europe
- APAC
- South America
- Middle East and Africa
By Type Insights
The dry cargo segment is estimated to witness significant growth during the forecast period. The dry cargo shipping sector represents a substantial portion of the market. Bulk commodities, including coal, iron ore, grain, ores, and minerals, account for a significant share of dry cargo shipments. These commodities are transported in large quantities using specialized bulk carriers. Agricultural commodities, such as wheat, corn, soybeans, rice, and sugar, and other grains, are categorized as agri-bulk and are essential for global food supply chains. Additionally, steel coils, steel plates, scrap metal, and other metal products are frequently transported as dry cargo, contributing to construction, manufacturing, and infrastructure projects worldwide. Free trade agreements, raw materials, and low-cost labor drive the demand for cargo shipping.
The container trade segment, which includes manufactured goods, affordable food items, and other consumer goods, is also a significant contributor to the market's growth. Technological advancements, such as emission regulations, data collection, and optimal cargo routing, enhance vessel deployment and reduce environmental impact. Intermodal transport, including rail wagons and inland barges, and low-cost trade solutions, such as e-commerce and urbanization, further fuel the market's expansion.

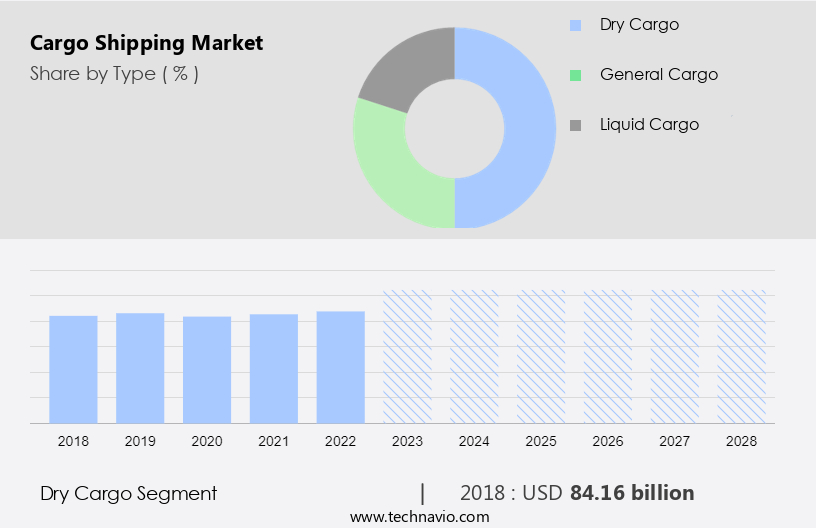
Get a glance at the market report of share of various segments Request Free Sample
The dry cargo segment was valued at USD 84.16 billion in 2018 and showed a gradual increase during the forecast period.
Regional Analysis
North America is estimated to contribute 34% to the growth of the global market during the forecast period. Technavio's analysts have elaborately explained the regional trends and drivers that shape the market during the forecast period.

For more insights on the market size of various regions, Request Free Sample
The North American market is significant due to its role as a major global trading hub, with the US being a key player. Trade relationships with Asia and Europe drive demand for shipping services, given the region's diverse economy manufacturing and industrial sectors. Raw materials, components, and finished goods are transported both domestically and internationally, relying on efficient cargo shipping solutions. Global supply chains are crucial for North American companies, enabling them to source materials, manufacture goods, and distribute products worldwide.
Cargo shipping plays a vital role in facilitating business connections globally, underpinned by free trade agreements, technological advancements, and environmental considerations, including emission regulations and data collection for optimal cargo routing and high-efficiency vessel deployment. The market is influenced by factors such as global economic growth, commodity consumption, import/export analysis, transportation modes (road, rail, air, intermodal), and urbanization, among others. Cargo types include containerized goods, such as manufactured items, food & beverages, oil, gas & ores, and electrical & electronics.
Market Dynamics
Our researchers analyzed the data with 2023 as the base year, along with the key drivers, trends, and challenges. A holistic analysis of drivers will help companies refine their marketing strategies to gain a competitive advantage.
What are the key market drivers leading to the rise In the adoption of Cargo Shipping Industry?
- The increasing global trade volume is the key driver of the market. The market experiences significant growth due to the increasing volume of international trade and economic expansion. This trend is driven by various factors, including the signing of new trade agreements and the need to transport raw materials, components, and finished goods between production facilities, distribution centers, and end markets. The use of IoT and blockchain technologies, along with the growth of e-commerce and inter-country trade, are key factors contributing to the market's growth.
- Cargo shipping plays a vital role in connecting different parts of the global supply chain, enabling the exchange of goods and services between regions, and promoting economic integration. The market encompasses various segments, including container shipping, bulk shipping, and tanker shipping, catering to the diverse needs of industries and economies. As global trade continues to expand, the demand for efficient and reliable cargo shipping services is expected to increase further, fostering growth and innovation within the industry.
What are the market trends shaping the Cargo Shipping Industry?
- Adoption of digitalization and automation in shipping industry is the upcoming market trend. The market is undergoing a digital transformation, integrating technologies such as IoT, blockchain, and AI to optimize operations and cut costs. IoT devices are being installed on ships, containers, and cargo to monitor their real-time location, condition, and status. This enhances supply chain transparency and enables better decision-making for improved cargo handling efficiency.
- Blockchain technology is used to create secure and tamper-proof records of transactions and documentation, ensuring supply chain integrity. By adopting these advanced technologies, the cargo shipping industry aims to streamline processes, reduce operational complexities, and enhance overall competitiveness.
What challenges does the Cargo Shipping Industry face during its growth?
- High operating costs of cargo shipping is a key challenge affecting the industry growth. Cargo shipping is an essential global industry with substantial operating costs, including fuel expenses, vessel maintenance, labor costs, and regulatory compliance. Fuel costs, which account for a significant portion of operating expenses, are subject to volatility due to fluctuations in oil prices.
- Strict environmental regulations, such as those set by the International Maritime Organization (IMO), require the use of more expensive low-sulfur fuels or investments in exhaust gas cleaning systems (scrubbers), adding to the financial burden. Regular maintenance and repair of cargo vessels are necessary to ensure safe and efficient operations, further increasing costs. These factors create challenges for cargo shipping companies, necessitating effective cost management strategies.
Exclusive Customer Landscape
The cargo shipping market forecasting report includes the adoption lifecycle of the market, market growth and forecasting, covering from the innovator's stage to the laggard's stage. It focuses on adoption rates in different regions based on penetration. Furthermore, the cargo shipping market report also includes key purchase criteria and drivers of price sensitivity to help companies evaluate and develop their market growth analysis strategies.

Customer Landscape
Key Companies & Market Insights
Companies are implementing various strategies, such as strategic alliances, cargo shipping market forecast, partnerships, mergers and acquisitions, geographical expansion, and product/service launches, to enhance their presence In the industry.
The industry research and growth report includes detailed analyses of the competitive landscape of the market and information about key companies, including:
- AP Moller Maersk AS
- C H Robinson Worldwide Inc.
- CEVA Logistics S A
- CMA CGM SA Group
- COSCO SHIPPING Holdings Co. Ltd.
- DB Schenker
- Deutsche Post AG
- Evergreen Group
- Freight Forwarders Inc.
- Hapag Lloyd AG
- MSC Mediterranean Shipping Co. SA
- Ocean Network Express Pte. Ltd.
- Pacific International Lines Pte. Ltd.
- PANALPINA CARGO
- PSA International Pte Ltd.
- Yang Ming Marine Transport Corp.
- Hamburg SUD Co.
Qualitative and quantitative analysis of companies has been conducted to help clients understand the wider business environment as well as the strengths and weaknesses of key industry players. Data is qualitatively analyzed to categorize companies as pure play, category-focused, industry-focused, and diversified; it is quantitatively analyzed to categorize companies as dominant, leading, strong, tentative, and weak.
Research Analyst Overview
Cargo shipping is a critical component of the global economy, facilitating the movement of goods between countries and continents. This sector plays a pivotal role in inter-country trade, enabling the exchange of raw materials, manufactured goods, and consumer items. The market is influenced by several market dynamics, including global economic growth, trade liberalization, and technological advancement. The demand for cargo shipping services is driven by the increasing consumption of commodities and manufactured goods, fueled by urbanization, changes in lifestyle, and industrialization. The growth in e-commerce and online retail sales has also led to a rise in the demand for efficient and affordable shipping solutions. The cargo shipping industry is characterized by the use of various types of vessels, including cargo ships and container vessels. Ports serve as crucial hubs for cargo movements, with the efficient handling of cargo being a key factor in minimizing transportation costs and ensuring timely delivery. The use of cranes and other handling equipment at ports is essential for the efficient loading and unloading of cargo.
The size and type of cargo, as well as the ship type, determine the type of cranes and handling equipment required. Free trade agreements and liberalizing trade policies have played a significant role in increasing cargo shipping volumes. The transportation of raw materials, such as oil, gas, and ores, continues to be a major contributor to the market. The container trade segment, which includes food and beverages, electrical and electronics, and other manufactured goods, has seen significant growth due to the increasing globalization of trade and the rise of e-commerce. The cargo shipping industry is also subject to various environmental regulations aimed at reducing the environmental footprint of shipping activities. The use of low-sulfur fuel and the implementation of emission regulations are some of the measures being taken to reduce exhaust gas emissions and minimize environmental pollution. Breakbulk shipping, reefer shipping, and RoRo (Roll-on/Roll-off) shipping are critical methods for transporting various types of cargo, while LCL (Less than Container Load) and FCL (Full Container Load) shipping cater to different shipment sizes. Freight forwarding plays a key role in cargo consolidation, coordinating shipments between shipping lines, shipping agents, and logistics providers. Sea freight, air freight, and land freight are essential components of global shipping networks, while ocean freight remains the backbone for large-scale shipments.
Shipping rates, freight capacity, and shipping schedules are vital in ensuring timely delivery. Cargo insurance and shipping documentation are crucial for risk management and compliance with customs clearance regulations. Supply chain management and cargo tracking systems improve supply chain visibility, allowing companies to stay on top of shipping efficiency, costs, and potential delays. Shipping software and freight management systems, along with automation and digital freight platforms, are transforming shipping operations, driving optimization and reducing inefficiencies. With advances in shipping technology and innovations such as shipping analytics, cross-border shipping has become more seamless, helping businesses streamline e-commerce shipping. Container types, container handling, crane operations, and port infrastructure remain foundational to the logistics ecosystem, while shipping trends continue to evolve, incorporating smarter, more efficient solutions to meet the growing demands of global trade.
Market Scope
|
Report Coverage
|
Details
|
Page number
|
166
|
Base year
|
2023
|
Historic period
|
2018-2022 |
Forecast period
|
2024-2028
|
Growth momentum & CAGR
|
Accelerate at a CAGR of 5.05%
|
Market growth 2024-2028
|
USD 58.83 billion
|
Market structure
|
Fragmented
|
YoY growth 2023-2024(%)
|
4.02
|
Key countries
|
US, China, India, Germany, and UK
|
Competitive landscape
|
Leading Companies, Market Positioning of Companies, Competitive Strategies, and Industry Risks
|
Request Free Sample
What are the Key Data Covered in this Cargo Shipping Market Research and Growth Report?
- CAGR of the Cargo Shipping industry during the forecast period
- Detailed information on factors that will drive the growth and forecasting between 2024 and 2028
- Precise estimation of the size of the market and its contribution of the industry in focus to the parent market
- Accurate predictions about upcoming growth and trends and changes in consumer behaviour
- Growth of the market across North America, Europe, APAC, South America, and Middle East and Africa
- Thorough analysis of the market's competitive landscape and detailed information about companies
- Comprehensive analysis of factors that will challenge the cargo shipping market growth of industry companies
We can help! Our analysts can customize this cargo shipping market research report to meet your requirements.
Get in touch
1 Executive Summary
- 1.1 Market overview
- Executive Summary - Chart on Market Overview
- Executive Summary - Data Table on Market Overview
- Executive Summary - Chart on Global Market Characteristics
- Executive Summary - Chart on Market by Geography
- Executive Summary - Chart on Market Segmentation by Type
- Executive Summary - Chart on Market Segmentation by End-user
- Executive Summary - Chart on Market Segmentation by Product Type
- Executive Summary - Chart on Market Segmentation by Product
- Executive Summary - Chart on Incremental Growth
- Executive Summary - Data Table on Incremental Growth
- Executive Summary - Chart on Company Market Positioning
2 Technavio Analysis
- 2.1 Analysis of price sensitivity, lifecycle, customer purchase basket, adoption rates, and purchase criteria
- Analysis of price sensitivity, lifecycle, customer purchase basket, adoption rates, and purchase criteria
- 2.2 Criticality of inputs and Factors of differentiation
- Overview on criticality of inputs and factors of differentiation
- 2.3 Factors of disruption
- Overview on factors of disruption
- 2.4 Impact of drivers and challenges
- Impact of drivers and challenges in 2024 and 2029
3 Market Landscape
- 3.1 Market ecosystem
- Parent Market
- Data Table on - Parent Market
- 3.2 Market characteristics
- Market characteristics analysis
4 Market Sizing
- 4.1 Market definition
- Offerings of companies included in the market definition
- 4.2 Market segment analysis
- 4.4 Market outlook: Forecast for 2024-2029
- Chart on Global - Market size and forecast 2024-2029 ($ billion)
- Data Table on Global - Market size and forecast 2024-2029 ($ billion)
- Chart on Global Market: Year-over-year growth 2024-2029 (%)
- Data Table on Global Market: Year-over-year growth 2024-2029 (%)
5 Historic Market Size
- 5.1 Global Cargo Shipping Market 2019 - 2023
- Historic Market Size - Data Table on Global Cargo Shipping Market 2019 - 2023 ($ billion)
- 5.2 Type segment analysis 2019 - 2023
- Historic Market Size - Type Segment 2019 - 2023 ($ billion)
- 5.3 End-user segment analysis 2019 - 2023
- Historic Market Size - End-user Segment 2019 - 2023 ($ billion)
- 5.4 Product Type segment analysis 2019 - 2023
- Historic Market Size - Product Type Segment 2019 - 2023 ($ billion)
- 5.5 Product segment analysis 2019 - 2023
- Historic Market Size - Product Segment 2019 - 2023 ($ billion)
- 5.6 Geography segment analysis 2019 - 2023
- Historic Market Size - Geography Segment 2019 - 2023 ($ billion)
- 5.7 Country segment analysis 2019 - 2023
- Historic Market Size - Country Segment 2019 - 2023 ($ billion)
6 Qualitative Analysis
- 6.1 AI Impact on Global Cargo Shipping Market
7 Five Forces Analysis
- 7.1 Five forces summary
- Five forces analysis - Comparison between 2024 and 2029
- 7.2 Bargaining power of buyers
- Bargaining power of buyers - Impact of key factors 2024 and 2029
- 7.3 Bargaining power of suppliers
- Bargaining power of suppliers - Impact of key factors in 2024 and 2029
- 7.4 Threat of new entrants
- Threat of new entrants - Impact of key factors in 2024 and 2029
- 7.5 Threat of substitutes
- Threat of substitutes - Impact of key factors in 2024 and 2029
- 7.6 Threat of rivalry
- Threat of rivalry - Impact of key factors in 2024 and 2029
- 7.7 Market condition
- Chart on Market condition - Five forces 2024 and 2029
8 Market Segmentation by Type
- 8.1 Market segments
- Chart on Type - Market share 2024-2029 (%)
- Data Table on Type - Market share 2024-2029 (%)
- 8.2 Comparison by Type
- Chart on Comparison by Type
- Data Table on Comparison by Type
- 8.3 Dry cargo - Market size and forecast 2024-2029
- Chart on Dry cargo - Market size and forecast 2024-2029 ($ billion)
- Data Table on Dry cargo - Market size and forecast 2024-2029 ($ billion)
- Chart on Dry cargo - Year-over-year growth 2024-2029 (%)
- Data Table on Dry cargo - Year-over-year growth 2024-2029 (%)
- 8.4 General cargo - Market size and forecast 2024-2029
- Chart on General cargo - Market size and forecast 2024-2029 ($ billion)
- Data Table on General cargo - Market size and forecast 2024-2029 ($ billion)
- Chart on General cargo - Year-over-year growth 2024-2029 (%)
- Data Table on General cargo - Year-over-year growth 2024-2029 (%)
- 8.5 Liquid cargo - Market size and forecast 2024-2029
- Chart on Liquid cargo - Market size and forecast 2024-2029 ($ billion)
- Data Table on Liquid cargo - Market size and forecast 2024-2029 ($ billion)
- Chart on Liquid cargo - Year-over-year growth 2024-2029 (%)
- Data Table on Liquid cargo - Year-over-year growth 2024-2029 (%)
- 8.6 Market opportunity by Type
- Market opportunity by Type ($ billion)
- Data Table on Market opportunity by Type ($ billion)
9 Market Segmentation by End-user
- 9.1 Market segments
- Chart on End-user - Market share 2024-2029 (%)
- Data Table on End-user - Market share 2024-2029 (%)
- 9.2 Comparison by End-user
- Chart on Comparison by End-user
- Data Table on Comparison by End-user
- 9.3 Manufacturing - Market size and forecast 2024-2029
- Chart on Manufacturing - Market size and forecast 2024-2029 ($ billion)
- Data Table on Manufacturing - Market size and forecast 2024-2029 ($ billion)
- Chart on Manufacturing - Year-over-year growth 2024-2029 (%)
- Data Table on Manufacturing - Year-over-year growth 2024-2029 (%)
- 9.4 Food and beverages - Market size and forecast 2024-2029
- Chart on Food and beverages - Market size and forecast 2024-2029 ($ billion)
- Data Table on Food and beverages - Market size and forecast 2024-2029 ($ billion)
- Chart on Food and beverages - Year-over-year growth 2024-2029 (%)
- Data Table on Food and beverages - Year-over-year growth 2024-2029 (%)
- 9.5 Oil and ores - Market size and forecast 2024-2029
- Chart on Oil and ores - Market size and forecast 2024-2029 ($ billion)
- Data Table on Oil and ores - Market size and forecast 2024-2029 ($ billion)
- Chart on Oil and ores - Year-over-year growth 2024-2029 (%)
- Data Table on Oil and ores - Year-over-year growth 2024-2029 (%)
- 9.6 Others - Market size and forecast 2024-2029
- Chart on Others - Market size and forecast 2024-2029 ($ billion)
- Data Table on Others - Market size and forecast 2024-2029 ($ billion)
- Chart on Others - Year-over-year growth 2024-2029 (%)
- Data Table on Others - Year-over-year growth 2024-2029 (%)
- 9.7 Market opportunity by End-user
- Market opportunity by End-user ($ billion)
- Data Table on Market opportunity by End-user ($ billion)
10 Market Segmentation by Product Type
- 10.1 Market segments
- Chart on Product Type - Market share 2024-2029 (%)
- Data Table on Product Type - Market share 2024-2029 (%)
- 10.2 Comparison by Product Type
- Chart on Comparison by Product Type
- Data Table on Comparison by Product Type
- 10.3 International shipping - Market size and forecast 2024-2029
- Chart on International shipping - Market size and forecast 2024-2029 ($ billion)
- Data Table on International shipping - Market size and forecast 2024-2029 ($ billion)
- Chart on International shipping - Year-over-year growth 2024-2029 (%)
- Data Table on International shipping - Year-over-year growth 2024-2029 (%)
- 10.4 Domestic shipping - Market size and forecast 2024-2029
- Chart on Domestic shipping - Market size and forecast 2024-2029 ($ billion)
- Data Table on Domestic shipping - Market size and forecast 2024-2029 ($ billion)
- Chart on Domestic shipping - Year-over-year growth 2024-2029 (%)
- Data Table on Domestic shipping - Year-over-year growth 2024-2029 (%)
- 10.5 Market opportunity by Product Type
- Market opportunity by Product Type ($ billion)
- Data Table on Market opportunity by Product Type ($ billion)
11 Market Segmentation by Product
- 11.1 Market segments
- Chart on Product - Market share 2024-2029 (%)
- Data Table on Product - Market share 2024-2029 (%)
- 11.2 Comparison by Product
- Chart on Comparison by Product
- Data Table on Comparison by Product
- 11.3 Bulk shipments - Market size and forecast 2024-2029
- Chart on Bulk shipments - Market size and forecast 2024-2029 ($ billion)
- Data Table on Bulk shipments - Market size and forecast 2024-2029 ($ billion)
- Chart on Bulk shipments - Year-over-year growth 2024-2029 (%)
- Data Table on Bulk shipments - Year-over-year growth 2024-2029 (%)
- 11.4 Large shipments - Market size and forecast 2024-2029
- Chart on Large shipments - Market size and forecast 2024-2029 ($ billion)
- Data Table on Large shipments - Market size and forecast 2024-2029 ($ billion)
- Chart on Large shipments - Year-over-year growth 2024-2029 (%)
- Data Table on Large shipments - Year-over-year growth 2024-2029 (%)
- 11.5 Small shipments - Market size and forecast 2024-2029
- Chart on Small shipments - Market size and forecast 2024-2029 ($ billion)
- Data Table on Small shipments - Market size and forecast 2024-2029 ($ billion)
- Chart on Small shipments - Year-over-year growth 2024-2029 (%)
- Data Table on Small shipments - Year-over-year growth 2024-2029 (%)
- 11.6 Market opportunity by Product
- Market opportunity by Product ($ billion)
- Data Table on Market opportunity by Product ($ billion)
12 Customer Landscape
- 12.1 Customer landscape overview
- Analysis of price sensitivity, lifecycle, customer purchase basket, adoption rates, and purchase criteria
13 Geographic Landscape
- 13.1 Geographic segmentation
- Chart on Market share by geography 2024-2029 (%)
- Data Table on Market share by geography 2024-2029 (%)
- 13.2 Geographic comparison
- Chart on Geographic comparison
- Data Table on Geographic comparison
- 13.3 North America - Market size and forecast 2024-2029
- Chart on North America - Market size and forecast 2024-2029 ($ billion)
- Data Table on North America - Market size and forecast 2024-2029 ($ billion)
- Chart on North America - Year-over-year growth 2024-2029 (%)
- Data Table on North America - Year-over-year growth 2024-2029 (%)
- 13.4 Europe - Market size and forecast 2024-2029
- Chart on Europe - Market size and forecast 2024-2029 ($ billion)
- Data Table on Europe - Market size and forecast 2024-2029 ($ billion)
- Chart on Europe - Year-over-year growth 2024-2029 (%)
- Data Table on Europe - Year-over-year growth 2024-2029 (%)
- 13.5 APAC - Market size and forecast 2024-2029
- Chart on APAC - Market size and forecast 2024-2029 ($ billion)
- Data Table on APAC - Market size and forecast 2024-2029 ($ billion)
- Chart on APAC - Year-over-year growth 2024-2029 (%)
- Data Table on APAC - Year-over-year growth 2024-2029 (%)
- 13.6 South America - Market size and forecast 2024-2029
- Chart on South America - Market size and forecast 2024-2029 ($ billion)
- Data Table on South America - Market size and forecast 2024-2029 ($ billion)
- Chart on South America - Year-over-year growth 2024-2029 (%)
- Data Table on South America - Year-over-year growth 2024-2029 (%)
- 13.7 Middle East and Africa - Market size and forecast 2024-2029
- Chart on Middle East and Africa - Market size and forecast 2024-2029 ($ billion)
- Data Table on Middle East and Africa - Market size and forecast 2024-2029 ($ billion)
- Chart on Middle East and Africa - Year-over-year growth 2024-2029 (%)
- Data Table on Middle East and Africa - Year-over-year growth 2024-2029 (%)
- 13.8 US - Market size and forecast 2024-2029
- Chart on US - Market size and forecast 2024-2029 ($ billion)
- Data Table on US - Market size and forecast 2024-2029 ($ billion)
- Chart on US - Year-over-year growth 2024-2029 (%)
- Data Table on US - Year-over-year growth 2024-2029 (%)
- 13.9 China - Market size and forecast 2024-2029
- Chart on China - Market size and forecast 2024-2029 ($ billion)
- Data Table on China - Market size and forecast 2024-2029 ($ billion)
- Chart on China - Year-over-year growth 2024-2029 (%)
- Data Table on China - Year-over-year growth 2024-2029 (%)
- 13.10 UK - Market size and forecast 2024-2029
- Chart on UK - Market size and forecast 2024-2029 ($ billion)
- Data Table on UK - Market size and forecast 2024-2029 ($ billion)
- Chart on UK - Year-over-year growth 2024-2029 (%)
- Data Table on UK - Year-over-year growth 2024-2029 (%)
- 13.11 Canada - Market size and forecast 2024-2029
- Chart on Canada - Market size and forecast 2024-2029 ($ billion)
- Data Table on Canada - Market size and forecast 2024-2029 ($ billion)
- Chart on Canada - Year-over-year growth 2024-2029 (%)
- Data Table on Canada - Year-over-year growth 2024-2029 (%)
- 13.12 Germany - Market size and forecast 2024-2029
- Chart on Germany - Market size and forecast 2024-2029 ($ billion)
- Data Table on Germany - Market size and forecast 2024-2029 ($ billion)
- Chart on Germany - Year-over-year growth 2024-2029 (%)
- Data Table on Germany - Year-over-year growth 2024-2029 (%)
- 13.13 Japan - Market size and forecast 2024-2029
- Chart on Japan - Market size and forecast 2024-2029 ($ billion)
- Data Table on Japan - Market size and forecast 2024-2029 ($ billion)
- Chart on Japan - Year-over-year growth 2024-2029 (%)
- Data Table on Japan - Year-over-year growth 2024-2029 (%)
- 13.14 India - Market size and forecast 2024-2029
- Chart on India - Market size and forecast 2024-2029 ($ billion)
- Data Table on India - Market size and forecast 2024-2029 ($ billion)
- Chart on India - Year-over-year growth 2024-2029 (%)
- Data Table on India - Year-over-year growth 2024-2029 (%)
- 13.15 France - Market size and forecast 2024-2029
- Chart on France - Market size and forecast 2024-2029 ($ billion)
- Data Table on France - Market size and forecast 2024-2029 ($ billion)
- Chart on France - Year-over-year growth 2024-2029 (%)
- Data Table on France - Year-over-year growth 2024-2029 (%)
- 13.16 Italy - Market size and forecast 2024-2029
- Chart on Italy - Market size and forecast 2024-2029 ($ billion)
- Data Table on Italy - Market size and forecast 2024-2029 ($ billion)
- Chart on Italy - Year-over-year growth 2024-2029 (%)
- Data Table on Italy - Year-over-year growth 2024-2029 (%)
- 13.17 The Netherlands - Market size and forecast 2024-2029
- Chart on The Netherlands - Market size and forecast 2024-2029 ($ billion)
- Data Table on The Netherlands - Market size and forecast 2024-2029 ($ billion)
- Chart on The Netherlands - Year-over-year growth 2024-2029 (%)
- Data Table on The Netherlands - Year-over-year growth 2024-2029 (%)
- 13.18 Market opportunity by geography
- Market opportunity by geography ($ billion)
- Data Tables on Market opportunity by geography ($ billion)
14 Drivers, Challenges, and Opportunity/Restraints
- 14.3 Impact of drivers and challenges
- Impact of drivers and challenges in 2024 and 2029
- 14.4 Market opportunities/restraints
15 Competitive Landscape
- 15.2 Competitive Landscape
- Overview on criticality of inputs and factors of differentiation
- 15.3 Landscape disruption
- Overview on factors of disruption
- 15.4 Industry risks
- Impact of key risks on business
16 Competitive Analysis
- 16.2 Company ranking index
- 16.3 Market positioning of companies
- Matrix on companies position and classification
- 16.4 AP Moller Maersk AS
- AP Moller Maersk AS - Overview
- AP Moller Maersk AS - Business segments
- AP Moller Maersk AS - Key news
- AP Moller Maersk AS - Key offerings
- AP Moller Maersk AS - Segment focus
- SWOT
- 16.5 C H Robinson Worldwide Inc.
- C H Robinson Worldwide Inc. - Overview
- C H Robinson Worldwide Inc. - Product / Service
- C H Robinson Worldwide Inc. - Key news
- C H Robinson Worldwide Inc. - Key offerings
- SWOT
- 16.6 CMA CGM Group
- CMA CGM Group - Overview
- CMA CGM Group - Product / Service
- CMA CGM Group - Key news
- CMA CGM Group - Key offerings
- SWOT
- 16.7 COSCO Shipping Ports Ltd.
- COSCO Shipping Ports Ltd. - Overview
- COSCO Shipping Ports Ltd. - Product / Service
- COSCO Shipping Ports Ltd. - Key offerings
- SWOT
- 16.8 DB Schenker
- DB Schenker - Overview
- DB Schenker - Product / Service
- DB Schenker - Key offerings
- SWOT
- 16.9 DHL International GmbH
- DHL International GmbH - Overview
- DHL International GmbH - Business segments
- DHL International GmbH - Key news
- DHL International GmbH - Key offerings
- DHL International GmbH - Segment focus
- SWOT
- 16.10 Evergreen Group
- Evergreen Group - Overview
- Evergreen Group - Product / Service
- Evergreen Group - Key offerings
- SWOT
- 16.11 Freight Forwarders Inc
- Freight Forwarders Inc - Overview
- Freight Forwarders Inc - Product / Service
- Freight Forwarders Inc - Key offerings
- SWOT
- 16.12 Hapag Lloyd AG
- Hapag Lloyd AG - Overview
- Hapag Lloyd AG - Product / Service
- Hapag Lloyd AG - Key offerings
- SWOT
- 16.13 MSC Mediterranean Shipping Co. SA
- MSC Mediterranean Shipping Co. SA - Overview
- MSC Mediterranean Shipping Co. SA - Product / Service
- MSC Mediterranean Shipping Co. SA - Key offerings
- SWOT
- 16.14 Ocean Network Express Pte. Ltd.
- Ocean Network Express Pte. Ltd. - Overview
- Ocean Network Express Pte. Ltd. - Product / Service
- Ocean Network Express Pte. Ltd. - Key offerings
- SWOT
- 16.15 Panalpina Cargo
- Panalpina Cargo - Overview
- Panalpina Cargo - Product / Service
- Panalpina Cargo - Key offerings
- SWOT
- 16.16 PSA International
- PSA International - Overview
- PSA International - Product / Service
- PSA International - Key offerings
- SWOT
- 16.17 Yang Ming Marine Transport Corp.
- Yang Ming Marine Transport Corp. - Overview
- Yang Ming Marine Transport Corp. - Product / Service
- Yang Ming Marine Transport Corp. - Key offerings
- SWOT
- 16.18 ZIM Integrated Shipping Services Ltd.
- ZIM Integrated Shipping Services Ltd. - Overview
- ZIM Integrated Shipping Services Ltd. - Product / Service
- ZIM Integrated Shipping Services Ltd. - Key offerings
- SWOT
17 Appendix
- 17.2 Inclusions and exclusions checklist
- Inclusions checklist
- Exclusions checklist
- 17.3 Currency conversion rates for US$
- Currency conversion rates for US$
- 17.4 Research methodology
- 17.7 Validation techniques employed for market sizing
- Validation techniques employed for market sizing
- 17.9 360 degree market analysis
- 360 degree market analysis
- 17.10 List of abbreviations