Bilirubin Blood Test Market Analysis North America, Europe, Asia, Rest of World (ROW) - US, Germany, UK, France, China - Size and Forecast 2024-2028

Bilirubin Blood Test Market Analysis North America, Europe, Asia, Rest of World (ROW) - US, Germany, UK, France, China - Size and Forecast 2024-2028

Published: Dec 2023 160 Pages SKU: IRTNTR40873

Market Overview at a Glance

$552.66 Mn
Market Opportunity
6.24%
CAGR
5.75
YoY growth 2023-2024(%)

Bilirubin Blood Test Market Size 2024-2028

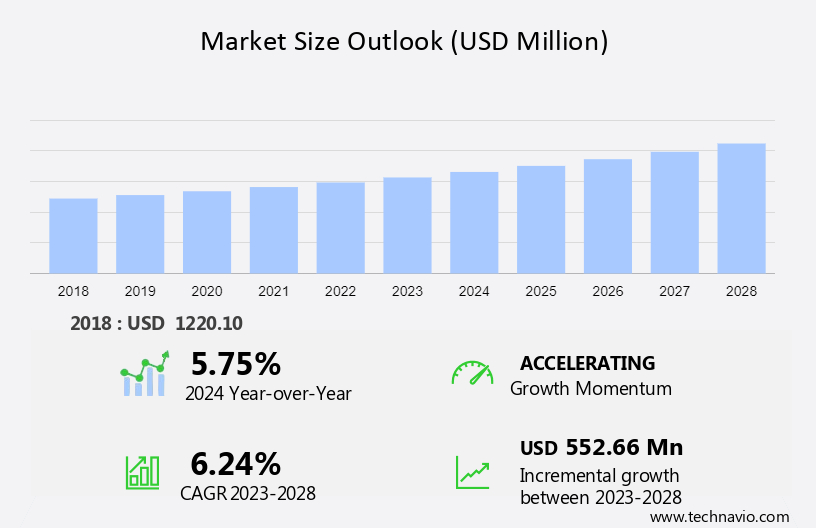
The bilirubin blood test market size is forecast to increase by USD 552.66 million at a CAGR of 6.24% between 2023 and 2028.

  • The market is witnessing significant growth due to several key factors. The increasing prevalence of jaundice and liver diseases worldwide is driving market demand. Additionally, the trend towards non-invasive blood bilirubin procedures is gaining traction, as these methods offer advantages such as reduced pain and fewer complications compared to traditional invasive tests. Bilirubin can also be found in bile and dark urine, and its elevated levels can indicate various liver conditions such as hepatitis, liver diseases, and gallbladder issues. However, the high costs associated with these tests remain a challenge, limiting accessibility to some patients. Overall, the market is expected to experience steady growth In the coming years, as advancements in technology and increasing awareness of the importance of early diagnosis and treatment drive demand.

What will be the Size of the Bilirubin Blood Test Market During the Forecast Period?

Bilirubin Blood Test Market Size

 Request Free Sample

  • The market encompasses diagnostic techniques used to measure bilirubin levels in a patient's blood. Bilirubin is a yellow pigment produced during the breakdown of old red blood cells, and its accumulation can lead to jaundice, characterized by yellowing of the skin and eyes. The market includes both transcutaneous and bench-top bilirubin tests, catering to diverse healthcare settings, including hospitals and diagnostic laboratories.
  • Furthermore, factors driving market growth include the increasing prevalence of liver diseases, heme disorders like anemia, and the growing health awareness among populations. The COVID-19 pandemic has also led to a growth in demand for diagnostic tests, including bilirubin blood tests, as healthcare workers prioritize early detection and treatment of various conditions. The market comprises total bilirubin and indirect bilirubin tests, used to diagnose a range of liver illnesses, including Gilbert's syndrome, hemolytic anemia, and other bilirubin-related disorders.

How is this Bilirubin Blood Test Industry segmented and which is the largest segment?

The bilirubin blood test industry research report provides comprehensive data (region-wise segment analysis), with forecasts and estimates in "USD million" for the period 2024-2028, as well as historical data from 2018-2022 for the following segments.

  • End-user
    • Infants
    • Adults
  • Product Type
    • Instruments
    • Consumables
  • Geography
    • North America
      • US
    • Europe
      • Germany
      • UK
      • France
    • Asia
      • China
    • Rest of World (ROW)

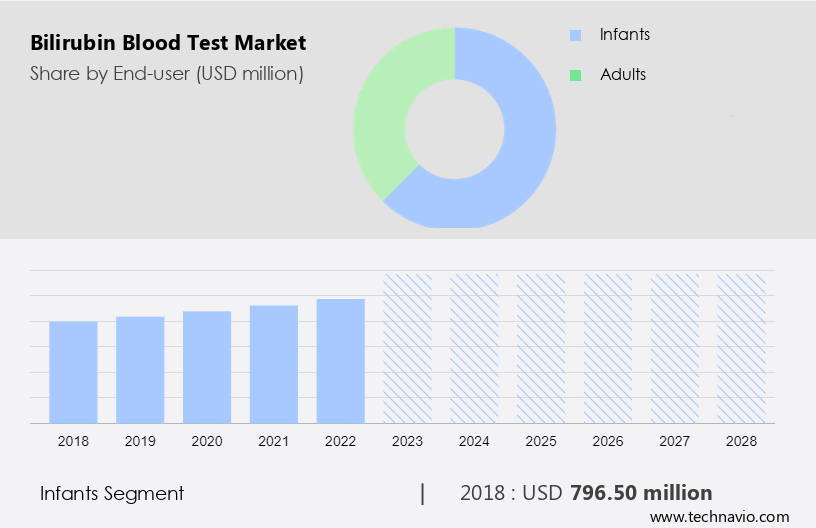
By End-user Insights

  • The infants segment is estimated to witness significant growth during the forecast period.

The infant segment dominates The market due to the high incidence of neonatal jaundice. Factors driving market growth include increasing new product launches, government initiatives to raise awareness about neonatal jaundice, and the presence of prominent players with extensive product offerings. Notably, neonatal jaundice affects approximately 80% of premature infants according to the Centers for Disease Control and Prevention (CDC). Bilirubin blood tests are essential for diagnosing and monitoring jaundice, which can lead to complications such as kernicterus if left untreated. These tests measure the levels of unconjugated and total bilirubin In the blood. Various diagnostic techniques are available, including transcutaneous, bench-top, and hospital-based tests.

Bilirubin testing instruments include analyzers, meters, and portable testing kits. The market includes key players providing consumables, instruments, and analyzers, such as medical agencies, diagnostics centers, research laboratories, academic institutions, pediatric clinics, and child specialist hospitals. Bilirubin tests are also used for diagnosing conditions like hepatitis, liver diseases, anemia, and Gilbert's syndrome. Healthcare workers and patients rely on these tests to monitor liver conditions and diagnose complications related to dark urine, yellowing of the skin and eyes, and gallbladder issues. Bilirubin testing is crucial for early detection and treatment, contributing significantly to the overall healthcare sector.

Bilirubin Blood Test Market Size

Get a glance at the  Bilirubin Blood Test Industry report of share of various segments Request Free Sample

The infants segment was valued at USD 796.50 million in 2018 and showed a gradual increase during the forecast period.
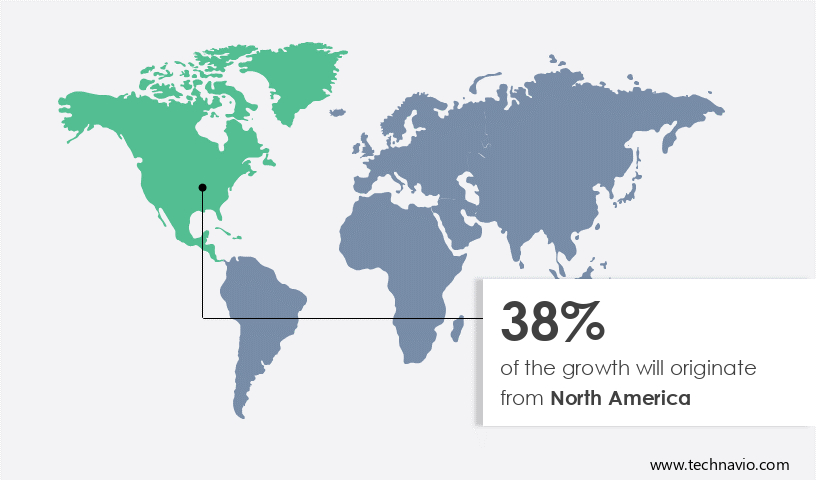
Regional Analysis

  • North America is estimated to contribute 38% to the growth of the global market during the forecast period.

Technavio's analysts have elaborately explained the regional trends and drivers that shape the market during the forecast period.

Bilirubin Blood Test Market Share by Geography

For more insights on the market share of various regions, Request Free Sample

The North American market is projected to expand due to technological advancements in testing products, rising prevalence of chronic liver diseases and jaundice, and extensive insurance coverage In the region. Neonatal jaundice and liver diseases, which impair the ability to metabolize and excrete bilirubin, are significant drivers for market growth. Bilirubin tests are essential for diagnosing various liver conditions, including hepatitis and jaundice, as well as hemolytic anemia and Gilbert's syndrome. This diagnostic technique is utilized in pediatric clinics, child specialist hospitals, research laboratories, and diagnostic centers.

Moreover, bilirubin testing instruments, consumables, and analyzers, including transcutaneous, bench-top, and portable testing kits, are employed by medical agencies and healthcare workers for accurate and timely diagnosis. Key applications include unconjugated bilirubin tests, total bilirubin tests, direct bilirubin tests, and indirect bilirubin tests. The market expansion is fueled by the growing health awareness and the need for early detection and treatment of liver conditions.

Market Dynamics

Our researchers analyzed the data with 2023 as the base year, along with the key drivers, trends, and challenges. A holistic analysis of drivers will help companies refine their marketing strategies to gain a competitive advantage.

What are the key market drivers leading to the rise In the adoption of Bilirubin Blood Test Industry?

Increasing prevalence of jaundice and liver diseases is the key driver of the market.

  • Bilirubin blood tests play a crucial role in diagnosing various liver conditions, including jaundice, hepatitis, and liver diseases. Bilirubin is a yellow pigment produced when hemoglobin in red blood cells is broken down. Elevated levels of bilirubin can lead to jaundice, which is characterized by yellowing of the skin and eyes, as well as dark urine. Neonatal jaundice, a common condition in newborns, is a significant driver of the market. This condition affects up to 60% of term and 80% of preterm infants and can lead to serious complications if left untreated. Bilirubin tests are essential in diagnosing liver conditions, including those caused by coronavirus and respiratory problems.
  • The market for bilirubin blood tests is expected to grow due to the increasing awareness of health issues and the availability of advanced diagnostic technologies. Medical agencies, pediatric clinics, child specialist hospitals, and research laboratories are significant consumers of bilirubin testing kits, consumables, instruments, analyzers, and bilirubin meters. Portable testing kits have gained popularity due to their convenience and ease of use, making bilirubin testing accessible to healthcare workers in remote areas. The market for bilirubin blood tests includes various diagnostic techniques, such as Unconjugated Bilirubin Test, Total Bilirubin Test, Direct Bilirubin Test, and Indirect Bilirubin Test. Bilirubin testing is also used In the diagnosis of conditions like Gilbert's syndrome, hemolytic anemia, and heme disorders.
  • In summary, the market is expected to grow significantly due to the increasing prevalence of liver conditions, the high incidence of neonatal jaundice, and the availability of advanced diagnostic technologies. The market caters to various end-users, including pediatric clinics, diagnostic centers, research laboratories, and academic institutions. The use of portable testing kits and the development of new diagnostic technologies are expected to further drive market growth.

What are the market trends shaping the Bilirubin Blood Test Industry?

Increasing demand for non-invasive blood bilirubin procedures is the upcoming market trend.

  • The market encompasses various diagnostic techniques and technologies used to measure bilirubin levels in patients, particularly those suffering from liver conditions such as jaundice, hepatitis, and anemia. Bilirubin is a yellow pigment produced during the breakdown of old red blood cells, and its levels can indicate liver function and hemolytic anemia. The demand for non-invasive testing methods is on the rise due to their convenience, minimal discomfort, and reduced risk of infections. Non-invasive bilirubin testing includes methods like transcutaneous, bench-top, and portable testing kits, which are increasingly preferred over traditional blood tests. Transcutaneous testing involves measuring bilirubin levels through the skin, while bench-top and portable testing kits offer the convenience of on-site testing in clinics and diagnostic centers.
  • Bilirubin testing is crucial for pediatric patients, as jaundice in infants can lead to complications like kernicterus, which can cause hearing loss, developmental delays, and other neurological issues. The market for bilirubin testing consumables, instruments, analyzers, and bilirubin meters is expected to grow significantly due to the increasing awareness of health issues and the need for accurate and timely diagnosis. Bilirubin testing is also essential for patients with liver diseases, coronavirus, and respiratory problems, as these conditions can lead to elevated bilirubin levels. Pathological labs, research laboratories, academic institutions, pediatric clinics, and child specialist hospitals are significant end-users of bilirubin testing technologies.
  • In summary, the market is expected to grow significantly due to the increasing demand for non-invasive testing methods, the growing number of patients with liver conditions, and the need for accurate and timely diagnosis. The market comprises various diagnostic techniques, technologies, and end-users, including pediatric patients, liver disease patients, and healthcare workers in clinics, diagnostic centers, and research laboratories.

What challenges does the Bilirubin Blood Test Industry face during its growth?

High costs and complications associated with blood bilirubin testing is a key challenge affecting the industry growth.

  • The market encompasses various diagnostic techniques and technologies used for measuring the levels of bilirubin In the blood, primarily for detecting liver conditions such as jaundice in patients, particularly infants. Bilirubin is a yellow pigment produced during the breakdown of hemoglobin In the liver, and its accumulation In the blood can lead to symptoms like dark urine, yellowing of the skin and eyes, and other health issues. Bilirubin tests include Unconjugated Bilirubin Test, Total Bilirubin Test, Direct Bilirubin Test, and Indirect Bilirubin Test. These tests are essential for diagnosing various liver diseases, including hepatitis, anemia, and liver illnesses like Gilbert's syndrome and hemolytic anemia.
  • The market comprises various stakeholders, including medical agencies, diagnostic centers, research laboratories, academic institutions, pediatric clinics, and child specialist hospitals. The diagnostic techniques and technologies used In the market include instruments, analyzers, bilirubin meters, and portable testing kits. The cost of transcutaneous bilirubinometers, a non-invasive testing method, is comparatively higher than the conventional blood testing method. This can increase the cost burden on end-users and patients. The cost of these meters ranges between USD3,100 and USD7,000, depending on the technology and brand preference. The high cost of transcutaneous bilirubinometers may impact their adoption and coverage, particularly in developing countries.
  • However, the increasing awareness of health issues and the growing demand for non-invasive diagnostic methods may drive the market growth. The market dynamics include the increasing prevalence of liver diseases, the growing demand for non-invasive diagnostic methods, and the technological advancements in diagnostic techniques and instruments. Healthcare workers and clinics are key consumers of these diagnostic technologies, and the market is expected to grow significantly In the coming years.

Exclusive Customer Landscape

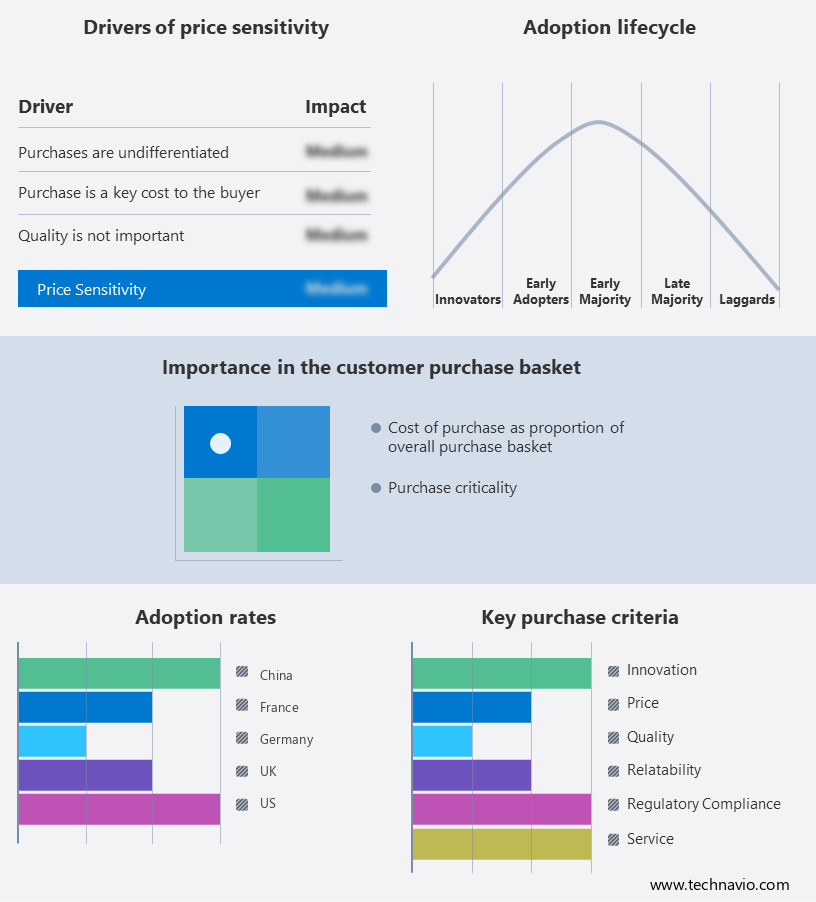
The bilirubin blood test market forecasting report includes the adoption lifecycle of the market, market growth and forecasting, covering from the innovator's stage to the laggard's stage. It focuses on adoption rates in different regions based on penetration. Furthermore, the bilirubin blood test market report also includes key purchase criteria and drivers of price sensitivity to help companies evaluate and develop their market growth analysis strategies.

Bilirubin Blood Test Market Share by Geography

 Customer Landscape

Key Companies & Market Insights

Companies are implementing various strategies, such as strategic alliances, bilirubin blood test market forecast, partnerships, mergers and acquisitions, geographical expansion, and product/service launches, to enhance their presence In the industry.

The industry research and growth report includes detailed analyses of the competitive landscape of the market and information about key companies, including:

  • Abbott Laboratories
  • Advanced Instruments LLC
  • ALLMEDTECH
  • AMETEK Inc.
  • Anamol Laboratories Pvt. Ltd.
  • BIOGENIX Inc. Pvt. Ltd.
  • DiaSys Diagnostic Systems GmbH
  • Dragerwerk AG and Co. KGaA
  • ELITechGroup SAS
  • F. Hoffmann La Roche Ltd.
  • GINEVRI Srl
  • Jaiprakash Associates Ltd.
  • Koninklijke Philips N.V.
  • Mega Lab SA
  • Merck KGaA
  • Micro Lab Instruments
  • Randox Laboratories Ltd.
  • Siemens AG
  • Teco Diagnostics
  • Thermo Fisher Scientific Inc.

Qualitative and quantitative analysis of companies has been conducted to help clients understand the wider business environment as well as the strengths and weaknesses of key industry players. Data is qualitatively analyzed to categorize companies as pure play, category-focused, industry-focused, and diversified; it is quantitatively analyzed to categorize companies as dominant, leading, strong, tentative, and weak.

Research Analyst Overview

The market encompasses a diagnostic technique utilized for assessing liver health and detecting various liver conditions. This test measures the levels of bilirubin, a yellow pigment produced during the normal breakdown of old red blood cells, in an individual's bloodstream. Bilirubin is a crucial component In the production of bile, which plays a significant role In the digestive process. Bilirubin exists in two forms: unconjugated and conjugated. Unconjugated bilirubin is the form found In the blood when it is not bound to proteins, while conjugated bilirubin is the form that has been bound to proteins and is ready to be excreted in bile.

Moreover, imbalances In these forms can indicate specific liver conditions. The bilirubin blood test is essential in various medical settings, including pediatrics, diagnostics centers, research laboratories, academic institutions, and child specialist hospitals. In pediatrics, the test is commonly used to diagnose and monitor jaundice in infants, a condition characterized by the yellowing of the skin and eyes due to high levels of bilirubin. In adults, the test is used to diagnose and monitor liver diseases, such as hepatitis, heme disorders, and hemolytic anemia. The bilirubin blood test is performed using various diagnostic technologies, including bench-top analyzers, bilirubin meters, and transcutaneous devices. These tests provide valuable information to healthcare workers, enabling them to make informed decisions regarding patient care and treatment. The market is driven by several factors, including the increasing prevalence of liver diseases, the growing awareness of health issues, and the advancements in diagnostic technologies. The availability of portable testing kits and the convenience they offer have also contributed to the growth of the market. Moreover, the market is expected to continue its growth trajectory due to the increasing demand for early and accurate diagnosis of liver conditions.

Furthermore, the market is also expected to benefit from the rising number of pathological labs and diagnostic centers and the increasing focus on research and development In the field of diagnostics. In summary, the market represents a vital component of the diagnostic industry, providing essential information for the diagnosis and monitoring of various liver conditions. The market is driven by several factors, including the increasing prevalence of liver diseases, the growing awareness of health issues, and the advancements in diagnostic technologies. The market is expected to continue its growth trajectory, driven by the increasing demand for early and accurate diagnosis of liver conditions and the availability of advanced diagnostic technologies.

Market Scope

Report Coverage

Details

Page number

160

Base year

2023

Historic period

2018-2022

Forecast period

2024-2028

Growth momentum & CAGR

Accelerate at a CAGR of 6.24%

Market growth 2024-2028

USD 552.66 million

Market structure

Fragmented

YoY growth 2023-2024(%)

5.75

Key countries

US, Germany, UK, France, and China

Competitive landscape

Leading Companies, Market Positioning of Companies, Competitive Strategies, and Industry Risks

Request Free Sample

What are the Key Data Covered in this Bilirubin Blood Test Market Research and Growth Report?

  • CAGR of the Bilirubin Blood Test industry during the forecast period
  • Detailed information on factors that will drive the growth and forecasting between 2024 and 2028
  • Precise estimation of the size of the market and its contribution of the industry in focus to the parent market
  • Accurate predictions about upcoming growth and trends and changes in consumer behaviour
  • Growth of the market across North America, Europe, Asia, and Rest of World (ROW)
  • Thorough analysis of the market's competitive landscape and detailed information about companies
  • Comprehensive analysis of factors that will challenge the bilirubin blood test market growth of industry companies

We can help! Our analysts can customize this bilirubin blood test market research report to meet your requirements.

Get in touch

1 Executive Summary

  • 1.1 Market overview
    • Exhibit 01: Executive Summary – Chart on Market Overview
    • Exhibit 02: Executive Summary – Data Table on Market Overview
    • Exhibit 03: Executive Summary – Chart on Global Market Characteristics
    • Exhibit 04: Executive Summary – Chart on Market by Geography
    • Exhibit 05: Executive Summary – Chart on Market Segmentation by End-user
    • Exhibit 06: Executive Summary – Chart on Market Segmentation by Product Type
    • Exhibit 07: Executive Summary – Chart on Incremental Growth
    • Exhibit 08: Executive Summary – Data Table on Incremental Growth
    • Exhibit 09: Executive Summary – Chart on Vendor Market Positioning

2 Market Landscape

  • 2.1 Market ecosystem
    • Exhibit 10: Parent market
    • Exhibit 11: Market Characteristics

3 Market Sizing

  • 3.1 Market definition
    • Exhibit 12: Offerings of vendors included in the market definition
  • 3.2 Market segment analysis
    • Exhibit 13: Market segments
  • 3.3 Market size 2023
    • 3.4 Market outlook: Forecast for 2023-2028
      • Exhibit 14: Chart on Global - Market size and forecast 2023-2028 ($ million)
      • Exhibit 15: Data Table on Global - Market size and forecast 2023-2028 ($ million)
      • Exhibit 16: Chart on Global Market: Year-over-year growth 2023-2028 (%)
      • Exhibit 17: Data Table on Global Market: Year-over-year growth 2023-2028 (%)

    4 Historic Market Size

    • 4.1 Global bilirubin blood test market 2018 - 2022
      • Exhibit 18: Historic Market Size – Data Table on global bilirubin blood test market 2018 - 2022 ($ million)
    • 4.2 End-user Segment Analysis 2018 - 2022
      • Exhibit 19: Historic Market Size – End-user Segment 2018 - 2022 ($ million)
    • 4.3 Product Type Segment Analysis 2018 - 2022
      • Exhibit 20: Historic Market Size – Product Type Segment 2018 - 2022 ($ million)
    • 4.4 Geography Segment Analysis 2018 - 2022
      • Exhibit 21: Historic Market Size – Geography Segment 2018 - 2022 ($ million)
    • 4.5 Country Segment Analysis 2018 - 2022
      • Exhibit 22: Historic Market Size – Country Segment 2018 - 2022 ($ million)

    5 Five Forces Analysis

    • 5.1 Five forces summary
      • Exhibit 23: Five forces analysis - Comparison between 2023 and 2028
    • 5.2 Bargaining power of buyers
      • Exhibit 24: Chart on Bargaining power of buyers – Impact of key factors 2023 and 2028
    • 5.3 Bargaining power of suppliers
      • Exhibit 25: Bargaining power of suppliers – Impact of key factors in 2023 and 2028
    • 5.4 Threat of new entrants
      • Exhibit 26: Threat of new entrants – Impact of key factors in 2023 and 2028
    • 5.5 Threat of substitutes
      • Exhibit 27: Threat of substitutes – Impact of key factors in 2023 and 2028
    • 5.6 Threat of rivalry
      • Exhibit 28: Threat of rivalry – Impact of key factors in 2023 and 2028
    • 5.7 Market condition
      • Exhibit 29: Chart on Market condition - Five forces 2023 and 2028

    6 Market Segmentation by End-user

    • 6.1 Market segments
      • Exhibit 30: Chart on End-user - Market share 2023-2028 (%)
      • Exhibit 31: Data Table on End-user - Market share 2023-2028 (%)
    • 6.2 Comparison by End-user
      • Exhibit 32: Chart on Comparison by End-user
      • Exhibit 33: Data Table on Comparison by End-user
    • 6.3 Infants - Market size and forecast 2023-2028
      • Exhibit 34: Chart on Infants - Market size and forecast 2023-2028 ($ million)
      • Exhibit 35: Data Table on Infants - Market size and forecast 2023-2028 ($ million)
      • Exhibit 36: Chart on Infants - Year-over-year growth 2023-2028 (%)
      • Exhibit 37: Data Table on Infants - Year-over-year growth 2023-2028 (%)
    • 6.4 Adults - Market size and forecast 2023-2028
      • Exhibit 38: Chart on Adults - Market size and forecast 2023-2028 ($ million)
      • Exhibit 39: Data Table on Adults - Market size and forecast 2023-2028 ($ million)
      • Exhibit 40: Chart on Adults - Year-over-year growth 2023-2028 (%)
      • Exhibit 41: Data Table on Adults - Year-over-year growth 2023-2028 (%)
    • 6.5 Market opportunity by End-user
      • Exhibit 42: Market opportunity by End-user ($ million)
      • Exhibit 43: Data Table on Market opportunity by End-user ($ million)

    7 Market Segmentation by Product Type

    • 7.1 Market segments
      • Exhibit 44: Chart on Product Type - Market share 2023-2028 (%)
      • Exhibit 45: Data Table on Product Type - Market share 2023-2028 (%)
    • 7.2 Comparison by Product Type
      • Exhibit 46: Chart on Comparison by Product Type
      • Exhibit 47: Data Table on Comparison by Product Type
    • 7.3 Instruments - Market size and forecast 2023-2028
      • Exhibit 48: Chart on Instruments - Market size and forecast 2023-2028 ($ million)
      • Exhibit 49: Data Table on Instruments - Market size and forecast 2023-2028 ($ million)
      • Exhibit 50: Chart on Instruments - Year-over-year growth 2023-2028 (%)
      • Exhibit 51: Data Table on Instruments - Year-over-year growth 2023-2028 (%)
    • 7.4 Consumables - Market size and forecast 2023-2028
      • Exhibit 52: Chart on Consumables - Market size and forecast 2023-2028 ($ million)
      • Exhibit 53: Data Table on Consumables - Market size and forecast 2023-2028 ($ million)
      • Exhibit 54: Chart on Consumables - Year-over-year growth 2023-2028 (%)
      • Exhibit 55: Data Table on Consumables - Year-over-year growth 2023-2028 (%)
    • 7.5 Market opportunity by Product Type
      • Exhibit 56: Market opportunity by Product Type ($ million)
      • Exhibit 57: Data Table on Market opportunity by Product Type ($ million)

    8 Customer Landscape

    • 8.1 Customer landscape overview
      • Exhibit 58: Analysis of price sensitivity, lifecycle, customer purchase basket, adoption rates, and purchase criteria

    9 Geographic Landscape

    • 9.1 Geographic segmentation
      • Exhibit 59: Chart on Market share by geography 2023-2028 (%)
      • Exhibit 60: Data Table on Market share by geography 2023-2028 (%)
    • 9.2 Geographic comparison
      • Exhibit 61: Chart on Geographic comparison
      • Exhibit 62: Data Table on Geographic comparison
    • 9.3 North America - Market size and forecast 2023-2028
      • Exhibit 63: Chart on North America - Market size and forecast 2023-2028 ($ million)
      • Exhibit 64: Data Table on North America - Market size and forecast 2023-2028 ($ million)
      • Exhibit 65: Chart on North America - Year-over-year growth 2023-2028 (%)
      • Exhibit 66: Data Table on North America - Year-over-year growth 2023-2028 (%)
    • 9.4 Europe - Market size and forecast 2023-2028
      • Exhibit 67: Chart on Europe - Market size and forecast 2023-2028 ($ million)
      • Exhibit 68: Data Table on Europe - Market size and forecast 2023-2028 ($ million)
      • Exhibit 69: Chart on Europe - Year-over-year growth 2023-2028 (%)
      • Exhibit 70: Data Table on Europe - Year-over-year growth 2023-2028 (%)
    • 9.5 Asia - Market size and forecast 2023-2028
      • Exhibit 71: Chart on Asia - Market size and forecast 2023-2028 ($ million)
      • Exhibit 72: Data Table on Asia - Market size and forecast 2023-2028 ($ million)
      • Exhibit 73: Chart on Asia - Year-over-year growth 2023-2028 (%)
      • Exhibit 74: Data Table on Asia - Year-over-year growth 2023-2028 (%)
    • 9.6 Rest of World (ROW) - Market size and forecast 2023-2028
      • Exhibit 75: Chart on Rest of World (ROW) - Market size and forecast 2023-2028 ($ million)
      • Exhibit 76: Data Table on Rest of World (ROW) - Market size and forecast 2023-2028 ($ million)
      • Exhibit 77: Chart on Rest of World (ROW) - Year-over-year growth 2023-2028 (%)
      • Exhibit 78: Data Table on Rest of World (ROW) - Year-over-year growth 2023-2028 (%)
    • 9.7 US - Market size and forecast 2023-2028
      • Exhibit 79: Chart on US - Market size and forecast 2023-2028 ($ million)
      • Exhibit 80: Data Table on US - Market size and forecast 2023-2028 ($ million)
      • Exhibit 81: Chart on US - Year-over-year growth 2023-2028 (%)
      • Exhibit 82: Data Table on US - Year-over-year growth 2023-2028 (%)
    • 9.8 Germany - Market size and forecast 2023-2028
      • Exhibit 83: Chart on Germany - Market size and forecast 2023-2028 ($ million)
      • Exhibit 84: Data Table on Germany - Market size and forecast 2023-2028 ($ million)
      • Exhibit 85: Chart on Germany - Year-over-year growth 2023-2028 (%)
      • Exhibit 86: Data Table on Germany - Year-over-year growth 2023-2028 (%)
    • 9.9 UK - Market size and forecast 2023-2028
      • Exhibit 87: Chart on UK - Market size and forecast 2023-2028 ($ million)
      • Exhibit 88: Data Table on UK - Market size and forecast 2023-2028 ($ million)
      • Exhibit 89: Chart on UK - Year-over-year growth 2023-2028 (%)
      • Exhibit 90: Data Table on UK - Year-over-year growth 2023-2028 (%)
    • 9.10 France - Market size and forecast 2023-2028
      • Exhibit 91: Chart on France - Market size and forecast 2023-2028 ($ million)
      • Exhibit 92: Data Table on France - Market size and forecast 2023-2028 ($ million)
      • Exhibit 93: Chart on France - Year-over-year growth 2023-2028 (%)
      • Exhibit 94: Data Table on France - Year-over-year growth 2023-2028 (%)
    • 9.11 China - Market size and forecast 2023-2028
      • Exhibit 95: Chart on China - Market size and forecast 2023-2028 ($ million)
      • Exhibit 96: Data Table on China - Market size and forecast 2023-2028 ($ million)
      • Exhibit 97: Chart on China - Year-over-year growth 2023-2028 (%)
      • Exhibit 98: Data Table on China - Year-over-year growth 2023-2028 (%)
    • 9.12 Market opportunity by geography
      • Exhibit 99: Market opportunity by geography ($ million)
      • Exhibit 100: Data Tables on Market opportunity by geography ($ million)

    10 Drivers, Challenges, and Trends

    • 10.1 Market drivers
      • 10.2 Market challenges
        • 10.3 Impact of drivers and challenges
          • Exhibit 101: Impact of drivers and challenges in 2023 and 2028
        • 10.4 Market trends

          11 Vendor Landscape

          • 11.1 Overview
            • 11.2 Vendor landscape
              • Exhibit 102: Overview on Criticality of inputs and Factors of differentiation
            • 11.3 Landscape disruption
              • Exhibit 103: Overview on factors of disruption
            • 11.4 Industry risks
              • Exhibit 104: Impact of key risks on business

            12 Vendor Analysis

            • 12.1 Vendors covered
              • Exhibit 105: Vendors covered
            • 12.2 Market positioning of vendors
              • Exhibit 106: Matrix on vendor position and classification
            • 12.3 Abbott Laboratories
              • Exhibit 107: Abbott Laboratories - Overview
              • Exhibit 108: Abbott Laboratories - Business segments
              • Exhibit 109: Abbott Laboratories - Key offerings
              • Exhibit 110: Abbott Laboratories - Segment focus
            • 12.4 Advanced Instruments LLC
              • Exhibit 111: Advanced Instruments LLC - Overview
              • Exhibit 112: Advanced Instruments LLC - Product / Service
              • Exhibit 113: Advanced Instruments LLC - Key offerings
            • 12.5 AMETEK Inc.
              • Exhibit 114: AMETEK Inc. - Overview
              • Exhibit 115: AMETEK Inc. - Business segments
              • Exhibit 116: AMETEK Inc. - Key offerings
              • Exhibit 117: AMETEK Inc. - Segment focus
            • 12.6 DiaSys Diagnostic Systems GmbH
              • Exhibit 118: DiaSys Diagnostic Systems GmbH - Overview
              • Exhibit 119: DiaSys Diagnostic Systems GmbH - Product / Service
              • Exhibit 120: DiaSys Diagnostic Systems GmbH - Key offerings
            • 12.7 Dragerwerk AG and Co. KGaA
              • Exhibit 121: Dragerwerk AG and Co. KGaA - Overview
              • Exhibit 122: Dragerwerk AG and Co. KGaA - Business segments
              • Exhibit 123: Dragerwerk AG and Co. KGaA - Key offerings
              • Exhibit 124: Dragerwerk AG and Co. KGaA - Segment focus
            • 12.8 ELITechGroup SAS
              • Exhibit 125: ELITechGroup SAS - Overview
              • Exhibit 126: ELITechGroup SAS - Product / Service
              • Exhibit 127: ELITechGroup SAS - Key offerings
            • 12.9 F. Hoffmann La Roche Ltd.
              • Exhibit 128: F. Hoffmann La Roche Ltd. - Overview
              • Exhibit 129: F. Hoffmann La Roche Ltd. - Business segments
              • Exhibit 130: F. Hoffmann La Roche Ltd. - Key news
              • Exhibit 131: F. Hoffmann La Roche Ltd. - Key offerings
              • Exhibit 132: F. Hoffmann La Roche Ltd. - Segment focus
            • 12.10 GINEVRI Srl
              • Exhibit 133: GINEVRI Srl - Overview
              • Exhibit 134: GINEVRI Srl - Product / Service
              • Exhibit 135: GINEVRI Srl - Key offerings
            • 12.11 Koninklijke Philips N.V.
              • Exhibit 136: Koninklijke Philips N.V. - Overview
              • Exhibit 137: Koninklijke Philips N.V. - Business segments
              • Exhibit 138: Koninklijke Philips N.V. - Key news
              • Exhibit 139: Koninklijke Philips N.V. - Key offerings
              • Exhibit 140: Koninklijke Philips N.V. - Segment focus
            • 12.12 Mega Lab SA
              • Exhibit 141: Mega Lab SA - Overview
              • Exhibit 142: Mega Lab SA - Product / Service
              • Exhibit 143: Mega Lab SA - Key offerings
            • 12.13 Merck KGaA
              • Exhibit 144: Merck KGaA - Overview
              • Exhibit 145: Merck KGaA - Business segments
              • Exhibit 146: Merck KGaA - Key news
              • Exhibit 147: Merck KGaA - Key offerings
              • Exhibit 148: Merck KGaA - Segment focus
            • 12.14 Micro Lab Instruments
              • Exhibit 149: Micro Lab Instruments - Overview
              • Exhibit 150: Micro Lab Instruments - Product / Service
              • Exhibit 151: Micro Lab Instruments - Key offerings
            • 12.15 Randox Laboratories Ltd.
              • Exhibit 152: Randox Laboratories Ltd. - Overview
              • Exhibit 153: Randox Laboratories Ltd. - Product / Service
              • Exhibit 154: Randox Laboratories Ltd. - Key offerings
            • 12.16 Siemens AG
              • Exhibit 155: Siemens AG - Overview
              • Exhibit 156: Siemens AG - Business segments
              • Exhibit 157: Siemens AG - Key news
              • Exhibit 158: Siemens AG - Key offerings
              • Exhibit 159: Siemens AG - Segment focus
            • 12.17 Thermo Fisher Scientific Inc.
              • Exhibit 160: Thermo Fisher Scientific Inc. - Overview
              • Exhibit 161: Thermo Fisher Scientific Inc. - Business segments
              • Exhibit 162: Thermo Fisher Scientific Inc. - Key news
              • Exhibit 163: Thermo Fisher Scientific Inc. - Key offerings
              • Exhibit 164: Thermo Fisher Scientific Inc. - Segment focus

            13 Appendix

            • 13.1 Scope of the report
              • 13.2 Inclusions and exclusions checklist
                • Exhibit 165: Inclusions checklist
                • Exhibit 166: Exclusions checklist
              • 13.3 Currency conversion rates for US$
                • Exhibit 167: Currency conversion rates for US$
              • 13.4 Research methodology
                • Exhibit 168: Research methodology
                • Exhibit 169: Validation techniques employed for market sizing
                • Exhibit 170: Information sources
              • 13.5 List of abbreviations
                • Exhibit 171: List of abbreviations

              Research Methodology

              Technavio presents a detailed picture of the market by way of study, synthesis, and summation of data from multiple sources. The analysts have presented the various facets of the market with a particular focus on identifying the key industry influencers. The data thus presented is comprehensive, reliable, and the result of extensive research, both primary and secondary.

              INFORMATION SOURCES

              Primary sources

              • Manufacturers and suppliers
              • Channel partners
              • Industry experts
              • Strategic decision makers

              Secondary sources

              • Industry journals and periodicals
              • Government data
              • Financial reports of key industry players
              • Historical data
              • Press releases

              DATA ANALYSIS

              Data Synthesis

              • Collation of data
              • Estimation of key figures
              • Analysis of derived insights

              Data Validation

              • Triangulation with data models
              • Reference against proprietary databases
              • Corroboration with industry experts

              REPORT WRITING

              Qualitative

              • Market drivers
              • Market challenges
              • Market trends
              • Five forces analysis

              Quantitative

              • Market size and forecast
              • Market segmentation
              • Geographical insights
              • Competitive landscape

              Interested in this report?

              Get your sample now to see our research methodology and insights!

              Download Now

              Frequently Asked Questions

              Bilirubin Blood Test market growth will increase by $ 552.66 mn during 2024-2028.

              The Bilirubin Blood Test market is expected to grow at a CAGR of 6.24% during 2024-2028.

              Bilirubin Blood Test market is segmented by End-user( Infants, Adults) Product Type( Instruments, Consumables, Asia, Rest of World (ROW))

              Abbott Laboratories, Advanced Instruments LLC, ALLMEDTECH, AMETEK Inc., Anamol Laboratories Pvt. Ltd., BIOGENIX Inc. Pvt. Ltd., DiaSys Diagnostic Systems GmbH, Dragerwerk AG and Co. KGaA, ELITechGroup SAS, F. Hoffmann La Roche Ltd., GINEVRI Srl, Jaiprakash Associates Ltd., Koninklijke Philips N.V., Mega Lab SA, Merck KGaA, Micro Lab Instruments, Randox Laboratories Ltd., Siemens AG, Teco Diagnostics, Thermo Fisher Scientific Inc. are a few of the key vendors in the Bilirubin Blood Test market.

              North America will register the highest growth rate of 38% among the other regions. Therefore, the Bilirubin Blood Test market in North America is expected to garner significant business opportunities for the vendors during the forecast period.

              US, Germany, UK, France, China

              • Increasing prevalence of jaundice and liver diseasesBilirubin blood tests are performed to measure the amount of bilirubin in the blood. Bilirubin is produced when red blood cells break down in the body. Bilirubin is a yellowish substance that occurs in the bloodstream due to the breakdown of hemoglobin is the driving factor this market.
              • a major component of red blood cells. As elevated levels of bilirubin can lead to jaundice is the driving factor this market.
              • the high prevalence of jaundice will increase the demand for bilirubin tests is the driving factor this market.
              • thereby driving the growth of the global bilirubin blood test market during the forecast period. Neonatal jaundice is a common cause of mortality and morbidity in newborn babies and accounts for up to 60% of cases in term and 80% in preterm babies. High bilirubin levels are common in newborns. Neonatal jaundice occurs due to an imbalance between bilirubin production and conjugation is the driving factor this market.
              • which results in increased bilirubin levels. This imbalance is mainly because of the immature liver in neonates and the rapid breakdown of red blood cells. The CDC recommends that newborns must be checked for jaundice in the hospital and again within 48 hours after leaving the hospital. Thus is the driving factor this market.
              • the rise in the prevalence of jaundice will drive the demand for bilirubin testing products as well as the growth of the global market during the forecast period. Bilirubin tests are also performed to diagnose conditions such as jaundice is the driving factor this market.
              • anemia is the driving factor this market.
              • and liver diseases. These tests help diagnose and monitor liver and bile duct diseases such as cirrhosis is the driving factor this market.
              • hepatitis is the driving factor this market.
              • and gallstones. For instance is the driving factor this market.
              • the total bilirubin levels may be elevated in infectious hepatitis. The levels of bilirubin in the blood change frequently in patients with hepatitis C. According to the data stated by WHO is the driving factor this market.
              • globally is the driving factor this market.
              • an estimated 58 million people have chronic hepatitis C virus infection is the driving factor this market.
              • with about 1.5 million new infections occurring per year. Such a high incidence of hepatitis C has generated the need for monitoring bilirubin levels in patients is the driving factor this market.
              • which will drive the growth of the global market. Also is the driving factor this market.
              • the rising incidence of liver disease across the globe is expected to propel the demand for bilirubin blood test kits. Overall is the driving factor this market.
              • about one in ten Americans have some type of liver disease. About 5.5 million people in the US have chronic liver disease or cirrhosis. Some types of liver diseases are becoming more common in the US because they are related to rising rates of obesity. Therefore is the driving factor this market.
              • the increasing prevalence of liver diseases is also expected to drive the growth of the global bilirubin blood test market during the forecast period. is the driving factor this market.

              The Bilirubin Blood Test market vendors should focus on grabbing business opportunities from the Infants segment as it accounted for the largest market share in the base year.