Non-Invasive Glucose Monitoring Devices Market Size 2025-2029
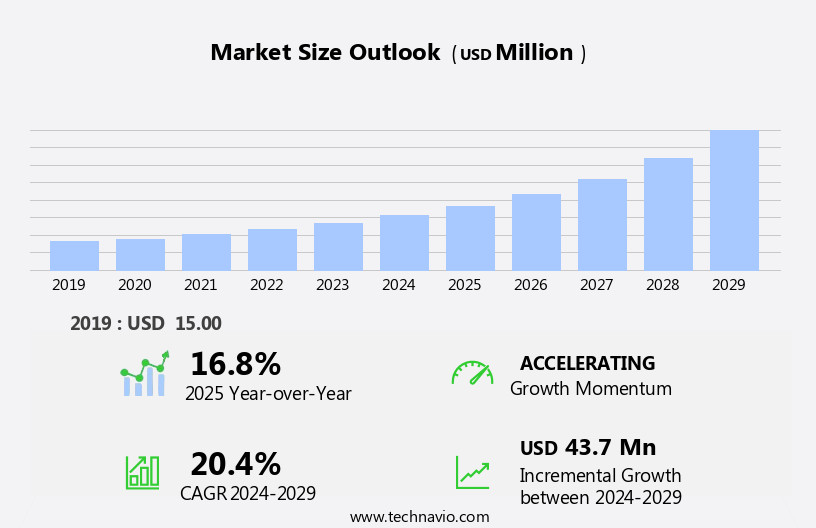
The non-invasive glucose monitoring devices market size is forecast to increase by USD 43.7 million, at a CAGR of 20.4% between 2024 and 2029.
- The market is experiencing significant growth, driven by the increasing prevalence of diabetes and initiatives by governments to promote diabetes management through advanced technologies. This trend is expected to continue as the global diabetes population continues to rise, necessitating the need for more effective and convenient glucose monitoring solutions. However, the market faces challenges, including the occasional recalls of non-invasive glucose monitoring devices due to quality concerns. These incidents can negatively impact market trust and consumer confidence, necessitating stricter regulatory oversight and quality control measures. Non-invasive glucose monitoring devices utilize transdermal sensors and near-infrared (NI) light to measure glucose levels through the skin, eliminating the need for invasive procedures.
- To capitalize on the market's potential, companies must prioritize product innovation, regulatory compliance, and robust quality control systems to differentiate themselves and build consumer trust. Additionally, strategic collaborations and partnerships can facilitate business expansion and market penetration, enabling companies to leverage each other's expertise and resources to address the evolving needs of the diabetes population. With the increasing focus on precision agriculture, the market for non-invasive glucose monitoring devices is expected to continue its growth trajectory.
What will be the Size of the Non-Invasive Glucose Monitoring Devices Market during the forecast period?
Explore in-depth regional segment analysis with market size data - historical 2019-2023 and forecasts 2025-2029 - in the full report.
Request Free Sample
- The market is experiencing significant growth due to the value proposition these offer to medical device companies and biotechnology firms. Electrochemical sensors and optical sensors are leading the technology landscape, driving research and development in this sector. Patients seek non-invasive methods for monitoring their glucose levels to facilitate lifestyle modifications, exercise regimens, and dietary changes. Customer retention is crucial for market players, leading to innovation in areas like smartphone integration, data storage, Bluetooth connectivity, ,data sharing and digital monitoring. Product differentiation is essential, as companies strive to offer unique features and pricing strategies to boost brand awareness.
- The market is witnessing an increase in interstitial fluid monitoring devices, providing real-time, continuous glucose readings without the need for frequent finger-prick tests. Wireless communication and patient education are also key trends, enabling better disease management and improved patient outcomes. The distribution channels for these devices are expanding, making non-invasive glucose monitoring more accessible to a wider population. These devices offer farmers the ability to monitor plant health status, make informed agronomic decisions, and manage inputs such as fertilizers and water usage effectively.
How is this Non-Invasive Glucose Monitoring Devices Industry segmented?
The non-invasive glucose monitoring devices industry research report provides comprehensive data (region-wise segment analysis), with forecasts and estimates in "USD million" for the period 2025-2029, as well as historical data from 2019-2023 for the following segments.
- Product
- Wearable
- Non-wearable
- End-user
- Home care settings
- Hospitals
- Clinics
- Component
- Measuring device
- Transmitter
- Software or app
- Geography
- North America
- US
- Canada
- Europe
- France
- Germany
- Italy
- Spain
- UK
- APAC
- China
- India
- South America
- Brazil
- Rest of World (ROW)
- North America
By Product Insights
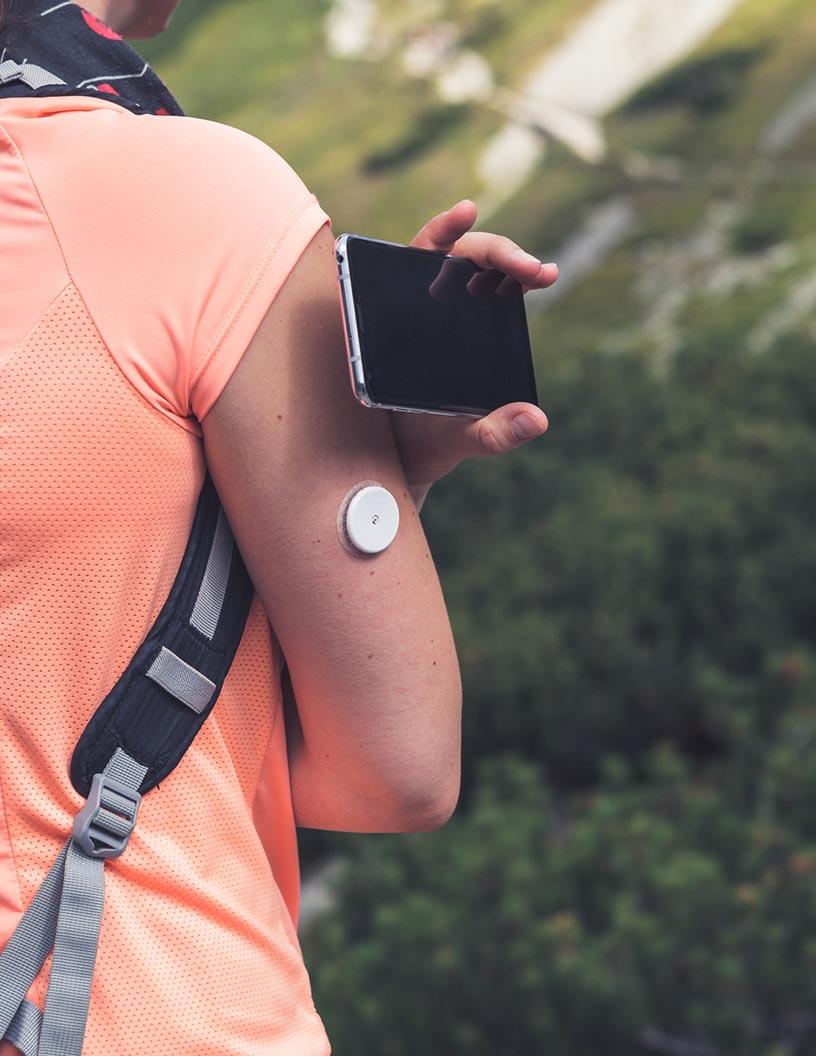
The wearable segment is estimated to witness significant growth during the forecast period. Wearable non-invasive glucose monitoring devices, utilizing transdermal sensors and near-infrared (NI) light technology, dominate the global market. These devices, which do not require needles or invasive procedures, have gained significant traction among diabetic patients, particularly those with diabetes who endure the inconvenience of frequent finger pricks for blood sugar level checks. The continuous glucose monitoring offered by non-invasive wearables is more comfortable and convenient, contributing to better diabetes management. Cloud computing integration enables real-time data access and analysis, while remote monitoring empowers healthcare providers to closely monitor their patients' glucose levels. Data visualization and predictive analytics help patients and healthcare professionals interpret complex data, providing valuable insights for personalized treatment plans.
Alert systems notify users of potential hypoglycemia or hyperglycemia, ensuring timely intervention. Sensor placement and calibration frequency are crucial considerations for ensuring accurate glucose readings. Emerging technologies, such as artificial intelligence (AI) and machine learning (ML), enhance data analytics, enabling more effective hypoglycemia and hyperglycemia detection. Sensor life and data security are essential concerns, with regulatory approvals, such as CE marking and FDA approval, ensuring safety and ethical considerations. Consumer adoption of non-invasive glucose monitoring devices is driven by their convenience, comfort, and potential for improved diabetes management. Wearable technology integration and mobile app compatibility further enhance user experience (UX) and user interface (UI).
Both type 1 and type 2 diabetic patients benefit from these devices, leading to increased market penetration. Calibration procedures and transmitter devices ensure data accuracy, while data analytics provide valuable insights for healthcare providers and endocrine specialists. Cloud data storage and accessibility enable farmers to access reports, alerts, and reminders from anywhere, while integration with mobile apps and websites streamlines task management, event management, and production data tracking.
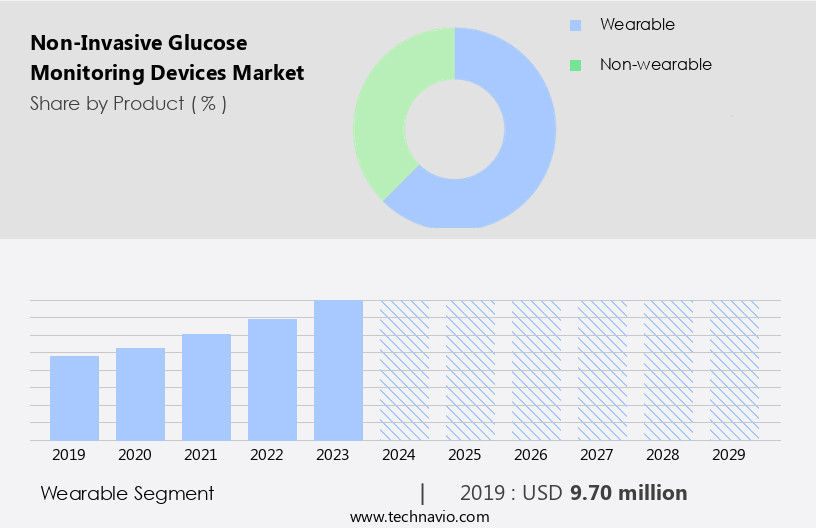
The Wearable segment was valued at USD 9.70 million in 2019 and showed a gradual increase during the forecast period.
The Non-Invasive Glucose Monitoring Devices Market is revolutionizing diabetes management with advanced subcutaneous glucose monitoring technology, eliminating the need for frequent finger pricks. Integration with personalized exercise regimen tracking enhances health outcomes, allowing users to monitor glucose fluctuations during physical activity. Leading biotechnology companies continue to invest in next-generation solutions, driving market expansion. Robust research and development efforts fuel innovation, refining sensor accuracy and reliability. A strong innovation pipeline supports the emergence of cutting-edge devices, improving convenience and adherence for users. Non-invasive glucose monitoring devices can integrate with mobile apps, websites, and other digital platforms, providing farmers with seamless access to real-time data and streamlined communication.
Regional Analysis
North America is estimated to contribute 50% to the growth of the global market during the forecast period. Technavio's analysts have elaborately explained the regional trends and drivers that shape the market during the forecast period.

The market in North America is experiencing steady growth, driven by the increasing prevalence of diabetes among the population. Diabetes, including gestational and types 1 and 2, affects millions of individuals, necessitating regular glucose level monitoring. This demand is further fueled by the launch of innovative products and the expanding presence of both regional and global market players. Cloud computing technology enables remote monitoring and data sharing between patients and healthcare providers, enhancing the effectiveness of diabetes management. Continuous glucose monitoring systems, featuring real-time alerts for hypo- and hyperglycemia, are gaining popularity. Data interpretation, predictive analytics, and data visualization tools facilitate personalized treatment plans, improving patient outcomes.
Sensor placement and calibration frequency are critical factors influencing user experience (UX) and patient compliance. Emerging technologies, such as artificial intelligence (AI) and machine learning (ML), are being integrated into these devices for improved accuracy and efficiency. However, privacy concerns and data security remain significant challenges that need to be addressed. Sensor life and cost-effectiveness are essential considerations for both patients and healthcare providers. Endocrine specialists and primary care physicians collaborate to optimize insulin management and ensure effective glucose control. Wearable technology and mobile app integration are making non-invasive glucose monitoring more accessible and convenient for patients.
Clinical trials and regulatory approvals are crucial steps in bringing new non-invasive glucose monitoring devices to market. As the market evolves, calibration procedures and transmitter devices continue to improve, ensuring reliable and accurate glucose readings. Despite these advancements, ethical considerations and consumer adoption remain essential factors shaping the market's future trajectory. Compliance with regulatory bodies like the FDA is crucial to ensure product safety and certification, maintaining the highest standards for public health, hygiene, and nutrition.
Market Dynamics
Our researchers analyzed the data with 2024 as the base year, along with the key drivers, trends, and challenges. A holistic analysis of drivers will help companies refine their marketing strategies to gain a competitive advantage.
What are the Non-Invasive Glucose Monitoring Devices market drivers leading to the rise in the adoption of Industry?
- The escalating incidence of diabetes and subsequent government initiatives serve as the primary catalyst for market growth in this sector. Diabetes, a chronic condition marked by elevated blood glucose levels, affects two primary categories: type 1 and type 2. Type 1 diabetes results from autoimmune disorders, while type 2 diabetes arises from genetic and lifestyle factors, including sedentary lifestyles and obesity. Given the significant role genetics plays in diabetes onset, the disease's prevalence continues to rise.
- Cloud computing integration facilitates seamless data access and real-time analysis, enhancing the overall user experience. The market is poised for growth due to the increasing diabetes prevalence and the need for pain-free, advanced monitoring solutions. This increasing prevalence fuels the demand for non-invasive glucose monitoring devices, which offer pain-free monitoring, enabling effective diabetes management. These devices employ advanced technologies such as continuous glucose monitoring, remote monitoring, insulin management, data interpretation, alert systems, predictive analytics, and data visualization.
What are the Non-Invasive Glucose Monitoring Devices market trends shaping the Industry?
- The increasing importance of collaborations is a notable market trend for business expansion. It is essential for professionals to prioritize strategic partnerships to maximize growth opportunities. Non-invasive glucose monitoring devices have gained significant attention in the healthcare industry due to their convenience and accuracy. With privacy concerns and data security being top priorities for diabetic patients, these devices offer a solution with real-time monitoring and user-friendly interfaces (UI/UX). Companies are expanding their commercial operations and forming partnerships to increase market penetration and meet the growing demand.
- Healthcare providers support the adoption of non-invasive glucose monitoring devices due to their potential to improve patient outcomes and reduce the burden of frequent fingerstick tests. The market's growth is further fueled by companies' efforts to expand their geographic reach and enhance manufacturing capabilities, allowing for wider accessibility to these innovative devices. The use of continuous glucose monitoring sensors (CGMs) eliminates the need for frequent calibration, making these devices more appealing to patients. However, interference factors such as sweat, motion, and temperature can affect glucose readings, necessitating advanced technology to mitigate these issues.
How does Non-Invasive Glucose Monitoring Devices market face challenges during its growth?
- The recall of non-invasive glucose monitoring devices poses a significant challenge to the industry's growth. This issue, which involves the removal of these products from the market due to safety concerns or other reasons, can negatively impact manufacturers' reputations and financial performance, potentially hindering the advancement and expansion of the industry. The market is subject to stringent regulations, with certifications from regulatory bodies such as the FDA being essential for market entry in the US. These certifications ensure product safety and effectiveness.
- Ce marking, a mandatory conformity mark for certain products within the European Economic Area, is also a consideration for manufacturers. Ensuring patient compliance with non-invasive glucose monitoring devices is another challenge, as accurate readings rely on consistent usage. Overall, the market dynamics are shaped by regulatory requirements, technological advancements, and consumer needs. However, recalls of non-compliant devices can negatively impact market growth and damage brand reputation. Emerging technologies, such as artificial intelligence (AI) and machine learning (ML), are enhancing non-invasive glucose monitoring by enabling real-time hypoglycemia detection and personalized treatment plans. Sensor placement and sensor life are critical factors influencing market growth.
Exclusive Customer Landscape
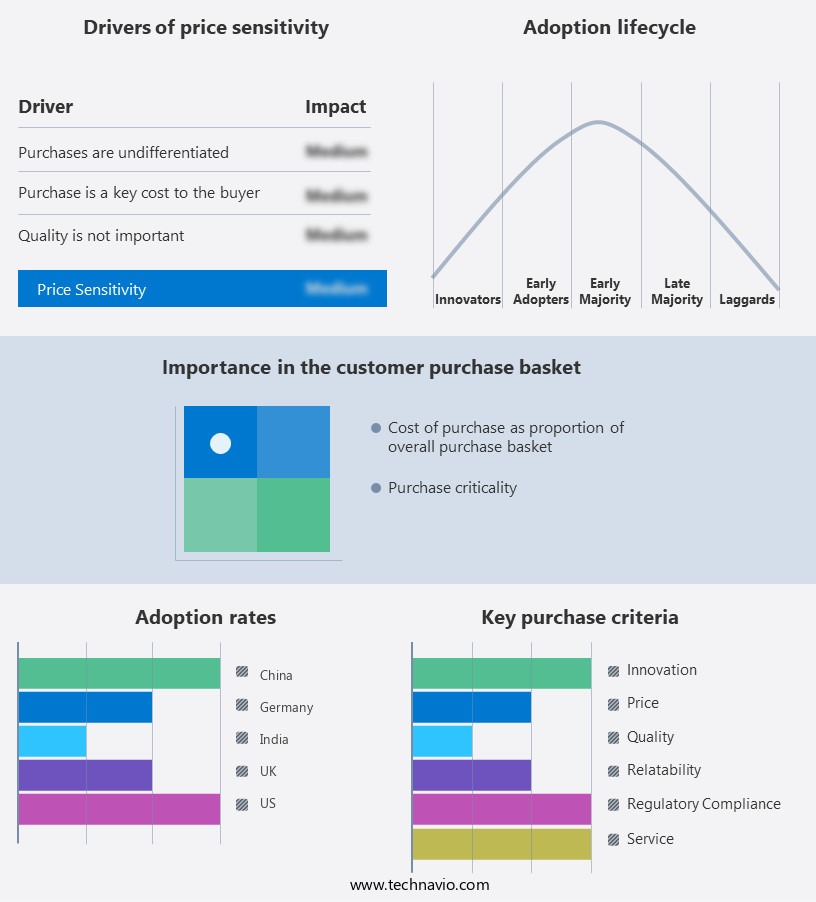
The non-invasive glucose monitoring devices market forecasting report includes the adoption lifecycle of the market, covering from the innovator's stage to the laggard's stage. It focuses on adoption rates in different regions based on penetration. Furthermore, the non-invasive glucose monitoring devices market report also includes key purchase criteria and drivers of price sensitivity to help companies evaluate and develop their market growth analysis strategies.
Customer Landscape
Key Companies & Market Insights
Companies are implementing various strategies, such as strategic alliances, non-invasive glucose monitoring devices market forecast, partnerships, mergers and acquisitions, geographical expansion, and product/service launches, to enhance their presence in the industry.
Abbott Laboratories - The company specializes in providing advanced non-invasive glucose monitoring solutions, including the FreeStyle Libre 2 and FreeStyle Libre 3 systems.
The industry research and growth report includes detailed analyses of the competitive landscape of the market and information about key companies, including:
- Abbott Laboratories
- Ascensia Diabetes Care Holdings AG
- BlueSemi
- BoydSense SAS
- Cnoga
- Dexcom Inc.
- DiaMonTech AG
- ESER Co.
- F. Hoffmann La Roche Ltd.
- Gluco Rx Ltd.
- HAGAR
- LifeScan IP Holdings LLC
- Medtronic Plc
- Nemaura Medical Inc.
- NOVIOSENSE BV
- Persperion Diagnostics
- Senseonics Holdings Inc.
- Taiwan Biophotonic Co.
Qualitative and quantitative analysis of companies has been conducted to help clients understand the wider business environment as well as the strengths and weaknesses of key industry players. Data is qualitatively analyzed to categorize companies as pure play, category-focused, industry-focused, and diversified; it is quantitatively analyzed to categorize companies as dominant, leading, strong, tentative, and weak.
Recent Development and News in Non-Invasive Glucose Monitoring Devices Market
- In February 2023, Abbott Laboratories announced the U.S. Food and Drug Administration (FDA) approval of their FreeStyle Libre Pro Glucose Sensing System for use in professional clinical settings (Abbott, 2023). This system, an expansion of their FreeStyle Libre line, enables healthcare professionals to remotely view and trend glucose data for their patients, enhancing diabetes management.
- In March 2024, Dexcom and Apple partnered to integrate Dexcom's G6 Continuous Glucose Monitoring (CGM) system with Apple Watch Series 6 and later models (Apple, 2024). This collaboration allows users to view their glucose data directly on their wrist, providing real-time monitoring and convenience.
- In May 2024, Senseonics received FDA approval for their Eversense Continuous Glucose Monitoring System, which includes a fully implantable sensor for up to 90 days of continuous monitoring (Senseonics, 2024). This approval marks a significant advancement in non-invasive glucose monitoring, offering users greater freedom and flexibility.
Research Analyst Overview
The non-invasive glucose monitoring market continues to evolve, driven by advancements in technology and the growing demand for more effective diabetes management solutions. Continuous glucose monitoring (CGM) devices, which provide real-time insights into blood sugar levels, are gaining popularity among diabetic patients, particularly those with Type 1 and Type 2 diabetes, as well as those with gestational diabetes. These devices employ CGM sensors that measure glucose levels interstitially, providing data that can inform personalized treatment plans. The integration of cloud computing, remote monitoring, and data analytics enables healthcare providers to access and interpret patient data in real-time, enhancing the overall diabetes management process.
This approach also facilitates predictive analytics and data visualization, allowing for early detection of hypoglycemia or hyperglycemia and the implementation of timely interventions. User interface (UI) and user experience (UX) design play crucial roles in ensuring patient compliance and ease of use, as frequent calibration and sensor placement can be challenging for some users. Market penetration is further bolstered by regulatory approvals, including CE marking and FDA approval, as well as the integration of these devices with mobile apps and insulin management systems. Emerging technologies, such as artificial intelligence (AI) and machine learning (ML), are poised to revolutionize the market by providing advanced data analysis capabilities and enabling more accurate glucose readings.
However, privacy concerns and data security remain critical considerations, necessitating robust security protocols and ethical considerations. Sensor life and interference factors, such as sensor placement and potential interference from external factors, continue to be areas of focus for manufacturers and researchers. As the market evolves, it is essential to maintain a balance between technological innovation and addressing the unique needs of diabetic patients.
Dive into Technavio's strong research methodology, blending expert interviews, extensive data synthesis, and validated models for unparalleled Non-Invasive Glucose Monitoring Devices Market insights. See full methodology.
|
Market Scope |
|
|
Report Coverage |
Details |
|
Page number |
217 |
|
Base year |
2024 |
|
Historic period |
2019-2023 |
|
Forecast period |
2025-2029 |
|
Growth momentum & CAGR |
Accelerate at a CAGR of 20.4% |
|
Market growth 2025-2029 |
USD 43.7 million |
|
Market structure |
Fragmented |
|
YoY growth 2024-2025(%) |
16.8 |
|
Key countries |
US, UK, Germany, Canada, China, France, India, Brazil, Italy, and Spain |
|
Competitive landscape |
Leading Companies, Market Positioning of Companies, Competitive Strategies, and Industry Risks |
What are the Key Data Covered in this Non-Invasive Glucose Monitoring Devices Market Research and Growth Report?
- CAGR of the Non-Invasive Glucose Monitoring Devices industry during the forecast period
- Detailed information on factors that will drive the growth and forecasting between 2025 and 2029
- Precise estimation of the size of the market and its contribution of the industry in focus to the parent market
- Accurate predictions about upcoming growth and trends and changes in consumer behaviour
- Growth of the market across North America, Europe, Asia, and Rest of World (ROW)
- Thorough analysis of the market's competitive landscape and detailed information about companies
- Comprehensive analysis of factors that will challenge the non-invasive glucose monitoring devices market growth of industry companies
We can help! Our analysts can customize this non-invasive glucose monitoring devices market research report to meet your requirements.
 RIA -
RIA - 
