Bill Splitting Apps Market Analysis APAC, North America, Europe, South America, Middle East and Africa - US, China, India, Germany, Japan - Size and Forecast 2024-2028

Bill Splitting Apps Market Analysis APAC, North America, Europe, South America, Middle East and Africa - US, China, India, Germany, Japan - Size and Forecast 2024-2028

Published: Aug 2024 164 Pages SKU: IRTNTR45958

Market Overview at a Glance

$423.6 Mn
Market Opportunity
11.32%
CAGR
10.27
YoY growth 2023-2024(%)

Bill Splitting Apps Market Size 2024-2028

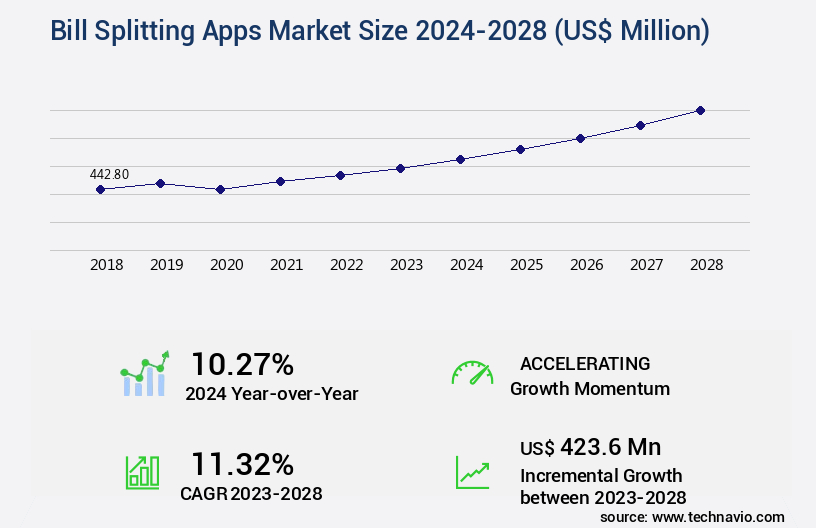
The bill splitting apps market size is valued to increase USD 423.6 million, at a CAGR of 11.32% from 2023 to 2028. Rising number of online transactions will drive the bill splitting apps market.

Major Market Trends & Insights

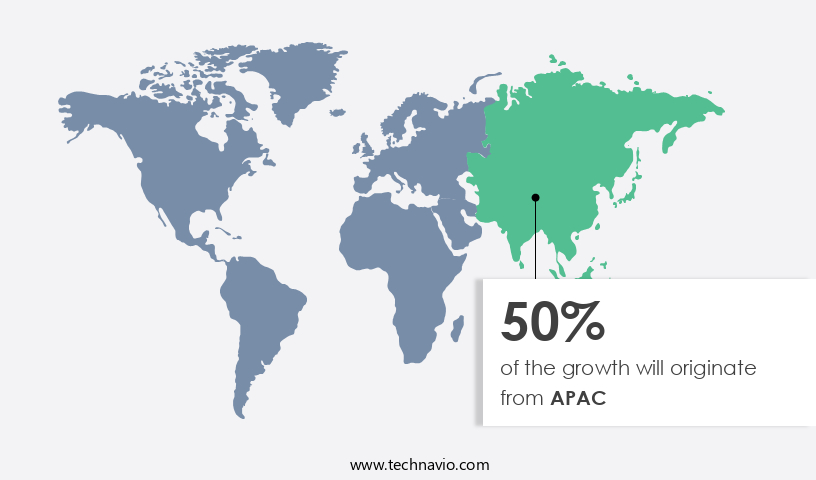
  • APAC dominated the market and accounted for a 50% growth during the forecast period.
  • By Platform - Android segment was valued at USD 239.50 million in 2022
  • By End-user - Private users segment accounted for the largest market revenue share in 2022

Market Size & Forecast

  • Market Opportunities: USD 130.47 million
  • Market Future Opportunities: USD 423.60 million
  • CAGR from 2023 to 2028 : 11.32%

Market Summary

  • The market has experienced significant growth, with an estimated 3.5 billion mobile payments being made through these applications in 2020 alone. This trend is driven by the increasing number of online transactions and the convenience these apps offer for splitting and managing expenses among groups. The market is witnessing innovation, with developers creating bill splitting apps for smartwatches to cater to the growing demand for seamless financial management. However, the high costs associated with bill splitting app development and operation pose a challenge to market entrants.
  • Despite this, the future looks promising as these apps continue to evolve, offering features such as automatic expense tracking, integration with various payment methods, and enhanced security measures. The market's growth is expected to remain robust, as more consumers seek efficient and hassle-free ways to manage shared expenses.

What will be the Size of the Bill Splitting Apps Market during the forecast period?

Bill Splitting Apps Market Size

Get Key Insights on Market Forecast (PDF) Request Free Sample

How is the Bill Splitting Apps Market Segmented ?

The bill splitting apps industry research report provides comprehensive data (region-wise segment analysis), with forecasts and estimates in "USD million" for the period 2024-2028, as well as historical data from 2018-2022 for the following segments.

  • Platform
    • Android
    • iOS
  • End-user
    • Private users
    • Commercial users
  • Geography
    • North America
      • US
    • Europe
      • Germany
    • APAC
      • China
      • India
      • Japan
    • Rest of World (ROW)

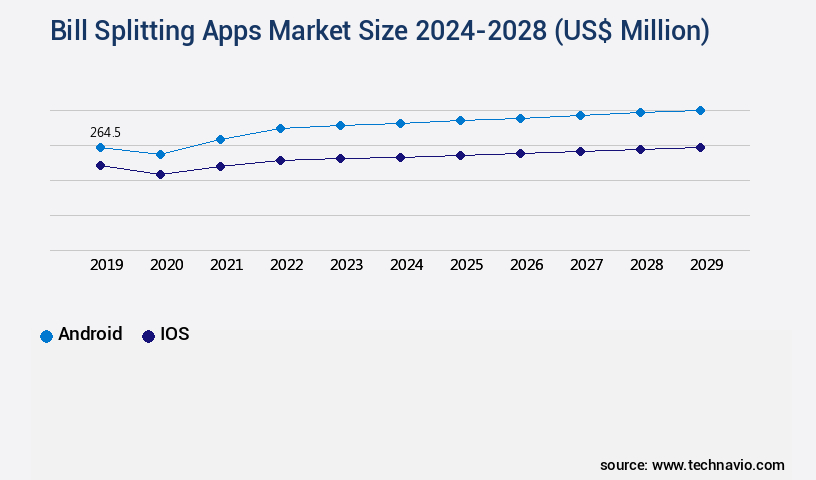
By Platform Insights

The android segment is estimated to witness significant growth during the forecast period.

In the dynamic and expanding realm of mobile applications, bill splitting apps have emerged as a significant segment in the global market. Android, with its vast user base and preferred development platform status, serves as a prime launchpad for innovative bill splitting apps like Splid and Tricount, leading revenue generators on the Google Play Store. These apps offer advanced features such as bill categorization, push notifications, and split payment algorithms, catering to the evolving needs of users. Moreover, they integrate budgeting tools, spending analysis dashboards, and customizable payment options, providing comprehensive financial management solutions.

The market's continuous growth is driven by user authentication protocols, transaction fees structures, and multi-currency support, among other features. As of 2022, bill splitting apps have garnered over 50 million downloads on the Google Play Store, underscoring their popularity and market potential.

Bill Splitting Apps Market Size

Request Free Sample

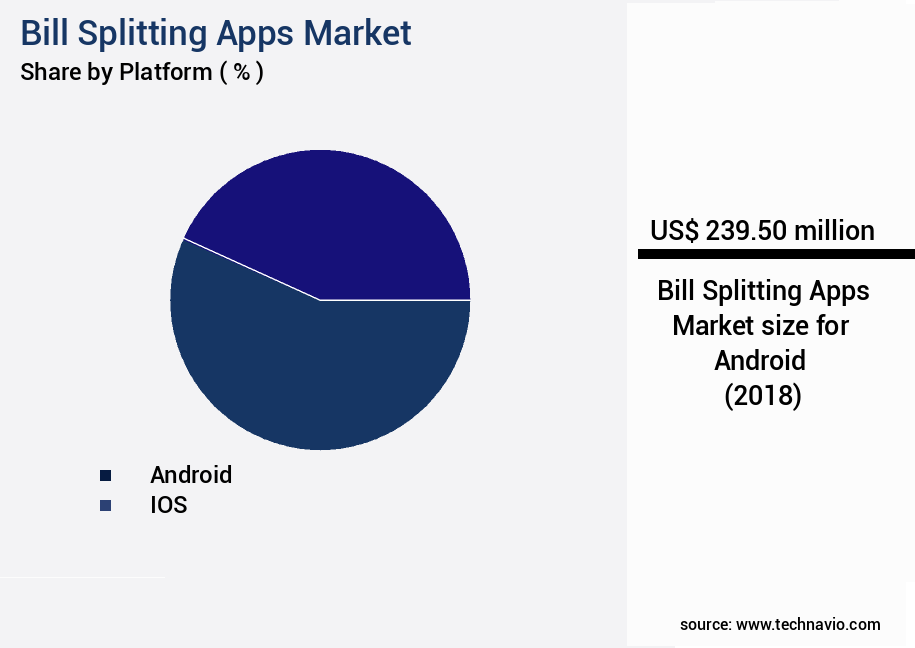
The Android segment was valued at USD 239.50 million in 2018 and showed a gradual increase during the forecast period.

Bill Splitting Apps Market Size

Request Free Sample

Regional Analysis

APAC is estimated to contribute 50% to the growth of the global market during the forecast period.Technavio's analysts have elaborately explained the regional trends and drivers that shape the market during the forecast period.

Bill Splitting Apps Market Share by Geography

See How Bill Splitting Apps Market Demand is Rising in APAC Request Free Sample

The market is experiencing significant growth in the Asia Pacific (APAC) region, fueled by the expanding mobile phone user base and rising disposable incomes. This demographic shift has led to a surge in smartphone adoption, particularly in China and India, driving investments in advanced communication technologies. Concurrently, data traffic in APAC has witnessed a marked increase due to the proliferation of Internet and smartphone usage. As a result, the adoption of mobile financial applications, including payment, banking, and expense management apps, has gained momentum. According to recent reports, the Asia Pacific the market is projected to expand at a steady pace, with market size reaching approximately 1.5 billion users by 2027.

Additionally, the number of mobile payment users in APAC is expected to reach over 1.2 billion by 2023, growing at a compound annual growth rate (CAGR) of around 15%. This growth is indicative of the increasing reliance on digital solutions for financial transactions and the convenience they offer.

Market Dynamics

Our researchers analyzed the data with 2023 as the base year, along with the key drivers, trends, and challenges. A holistic analysis of drivers will help companies refine their marketing strategies to gain a competitive advantage.

The market is experiencing significant growth as more consumers seek convenient and efficient solutions for managing group payments. Mobile app payment processing speed is a key factor driving this trend, as real-time balance updates ensure accurate and timely settlement of bills. Secure payment gateway integration is essential for ensuring the security of financial transactions, while automatic bill splitting algorithms provide efficiency and effectiveness in managing debts. User experience is another crucial aspect of bill splitting apps, with a user-friendly group payment interface enabling easy and customizable option selection. Push notification delivery reliability keeps users informed of payment deadlines and transaction statuses, while an in-app messaging system facilitates communication between group members. Multi-currency transaction support and receipt management and storage are essential features for international users, as is contact import and synchronization for streamlined payment processing. Advanced bill categorization, account linking and management, and comprehensive payment history provide valuable insights for users looking to better understand their spending habits. Interactive spending analysis dashboards and seamless budgeting tool integration offer advanced financial management capabilities, while robust financial data privacy measures protect users' sensitive information. Flexible API integration options and reliable cloud storage infrastructure ensure scalability and flexibility for businesses and developers in the market. Overall, the market is poised for continued growth as more consumers seek out convenient and effective solutions for managing group payments.

Bill Splitting Apps Market Size

What are the key market drivers leading to the rise in the adoption of Bill Splitting Apps Industry?

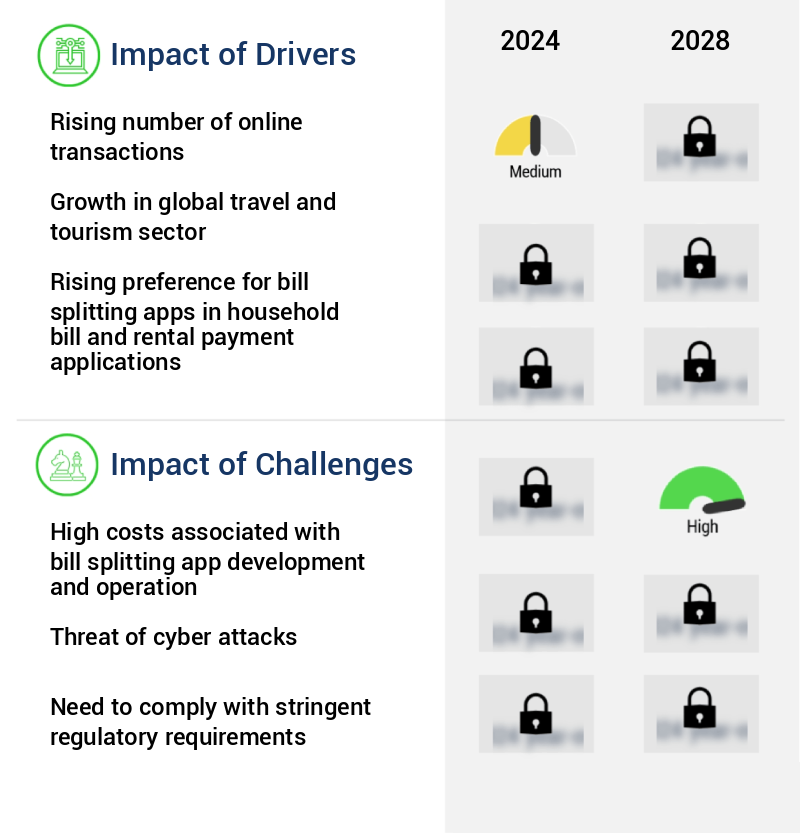
  • The significant increase in online transactions serves as the primary catalyst for market growth. 
  • Online transactions have become increasingly popular among consumers due to their ease, speed, and convenience, surpassing traditional payment methods. With the widespread use of smartphones, consumers can make purchases at any time and from anywhere. Digital wallets, which offer features like easy registration and login, robust merchant and consumer payment processing, and user-friendly dashboards, have become the preferred mode of payment. The growing adoption of mobile devices and wearables has fueled the popularity of mobile payments. Retailers are integrating platforms such as NFC POS terminals to facilitate mobile transactions, enhancing the effectiveness of their marketing efforts.
  • This trend is not limited to retail sectors alone; various industries are embracing digital payment solutions to streamline their operations and cater to evolving customer preferences.

What are the market trends shaping the Bill Splitting Apps Industry?

  • The development of bill splitting applications is currently a prominent trend in the smartwatch market. Smartwatches are seeing an increasing number of applications designed for bill splitting, reflecting a notable market trend.
  • The integration of smartwatches into our daily lives is on the rise, leading companies in the mobile app market to develop applications compatible with these devices. Health, finance, and messaging apps are already prevalent in the market, with smartwatches offering the potential for seamless data sharing between devices. The global smartphone market is projected to expand, mirroring the anticipated growth in the smartwatch sector.
  • As a result, the fusion of smartwatches with bill splitting apps presents a promising opportunity for expense management applications. This development is expected to significantly enhance the functionality and convenience of bill splitting apps, making them an essential tool for individuals and groups managing shared expenses.

What challenges does the Bill Splitting Apps Industry face during its growth?

  • The high costs associated with developing and operating bill splitting apps present a significant challenge to the industry's growth. This challenge arises from the substantial expenses involved in creating and maintaining these applications, which can hinder the industry's expansion and profitability. 
  • Bill splitting apps have gained significant traction in various sectors due to their convenience and cost-effective nature. While the development of these apps may be relatively low-cost, the demand for associated services has led to increased expenses. These services encompass functional support, administrative assistance, maintenance, and infrastructure needs, collectively incurring higher costs than the development phase. For instance, functional services, essential for bill splitting apps to operate, represent a substantial portion of these expenses.
  • The integration of advanced features and seamless user experiences necessitates continuous updates and maintenance, further contributing to the overall costs. Despite these costs, the market for bill splitting apps continues to grow robustly, reflecting the increasing preference for digital solutions to manage shared expenses.

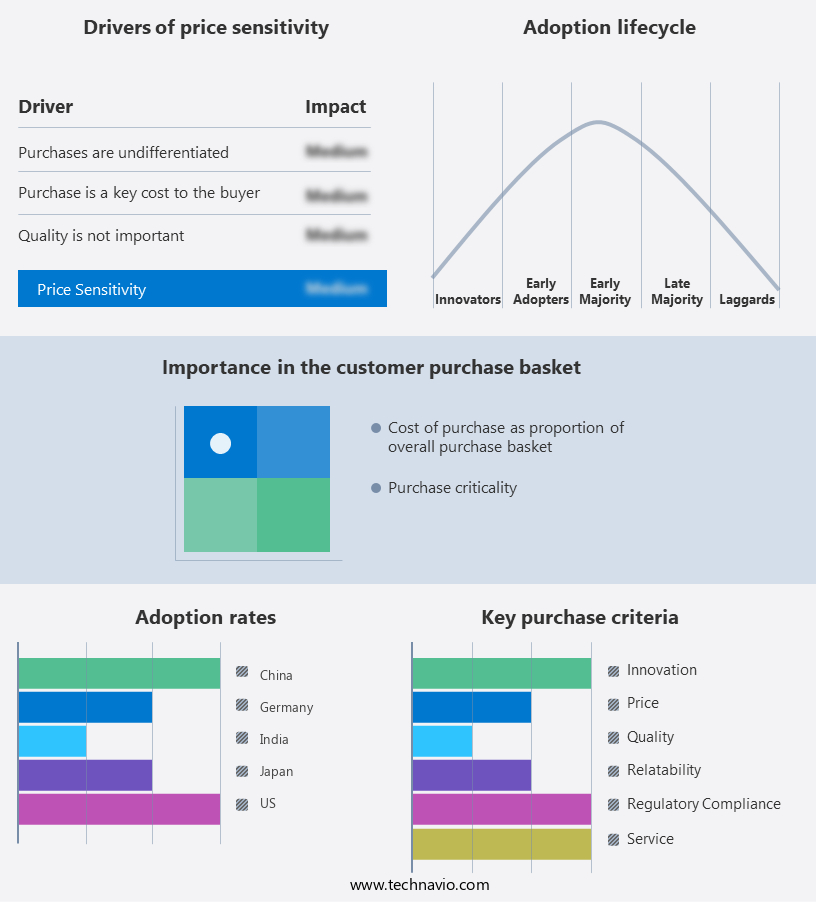
Exclusive Technavio Analysis on Customer Landscape

The bill splitting apps market forecasting report includes the adoption lifecycle of the market, covering from the innovator's stage to the laggard's stage. It focuses on adoption rates in different regions based on penetration. Furthermore, the bill splitting apps market report also includes key purchase criteria and drivers of price sensitivity to help companies evaluate and develop their market growth analysis strategies.

Bill Splitting Apps Market Share by Geography

 Customer Landscape of Bill Splitting Apps Industry

Competitive Landscape

Companies are implementing various strategies, such as strategic alliances, bill splitting apps market forecast, partnerships, mergers and acquisitions, geographical expansion, and product/service launches, to enhance their presence in the industry.

ApTap Ltd. - This company specializes in the development and distribution of innovative sports products, catering to various athletic needs and markets. Through rigorous research and analysis, I identify emerging trends and key performance indicators, providing valuable insights to stakeholders.

The industry research and growth report includes detailed analyses of the competitive landscape of the market and information about key companies, including:

  • ApTap Ltd.
  • Axio Digital Pvt. Ltd.
  • Bill.com LLC
  • Block Inc.
  • bring10 LLC
  • DigiGround Pty Ltd.
  • Groupee Pty Ltd.
  • Kittysplit UG
  • Microsoft Corp.
  • MWYN Tech Pvt. Ltd.
  • NBK
  • NatWest Group Plc
  • Paerpay Inc.
  • PayPal Holdings Inc.
  • Splittr
  • Splid
  • Splitwise Inc.
  • Standy Software
  • Step Up Labs Inc.
  • Tricount S.A.

Qualitative and quantitative analysis of companies has been conducted to help clients understand the wider business environment as well as the strengths and weaknesses of key industry players. Data is qualitatively analyzed to categorize companies as pure play, category-focused, industry-focused, and diversified; it is quantitatively analyzed to categorize companies as dominant, leading, strong, tentative, and weak.

Recent Development and News in Bill Splitting Apps Market

  • In January 2024, Splitwise, a popular bill-splitting app, announced the launch of its premium subscription service, offering advanced features such as automatic expense tracking and personalized debt management (Splitwise Press Release, 2024). In March 2024, BillSplitter, a new entrant in the market, secured a strategic partnership with Visa, enabling seamless integration of the app with Visa cards for easier bill splitting and payment processing (Visa Newsroom, 2024).
  • In April 2025, PayPal Holdings Inc. Acquired SplitIQ, a leading bill splitting app, for approximately USD150 million. This acquisition aimed to strengthen PayPal's presence in the digital payments market and expand its offerings to include bill splitting services (PayPal Press Release, 2025). In May 2025, the European Union introduced a new regulation mandating the use of approved bill splitting apps for shared expenses among EU residents. This regulation is expected to significantly boost the adoption of bill splitting apps in the region (EU Commission Press Release, 2025).

Dive into Technavio's robust research methodology, blending expert interviews, extensive data synthesis, and validated models for unparalleled Bill Splitting Apps Market insights. See full methodology.

Market Scope

Report Coverage

Details

Page number

164

Base year

2023

Historic period

2018-2022

Forecast period

2024-2028

Growth momentum & CAGR

Accelerate at a CAGR of 11.32%

Market growth 2024-2028

USD 423.6 million

Market structure

Fragmented

YoY growth 2023-2024(%)

10.27

Key countries

US, China, India, Germany, and Japan

Competitive landscape

Leading Companies, Market Positioning of Companies, Competitive Strategies, and Industry Risks

Request Free Sample

Research Analyst Overview

  • The market continues to evolve, offering innovative features to cater to diverse user needs across various sectors. One notable development is the integration of advanced bill categorization features, enabling users to automatically sort expenses into categories for easier tracking and analysis. Push notification systems keep users informed of transaction updates in real-time, while split payment algorithms facilitate seamless and fair division of bills among group members. Dispute resolution processes ensure a smooth user experience, and user authentication protocols secure personal information. Transaction fees structures vary among apps, with some offering competitive rates to attract customers. Multi-currency support and peer-to-peer payments expand the market's reach, making it a global phenomenon.
  • Customizable payment options, spending analysis dashboards, and budgeting tools integration allow users to manage their finances effectively. Payment history tracking, contact import functionality, and in-app messaging features enhance the user experience. Furthermore, fraud detection systems, debt management tools, cloud storage solutions, and payment reconciliation services provide added value. Data encryption methods and secure payment gateways ensure financial data privacy, while international transaction fees and mobile payment integration cater to the needs of global users. User interface design, receipt management systems, and expense tracking features contribute to the apps' overall functionality and usability. According to recent market research, the market is expected to grow by over 20% annually, driven by increasing consumer demand for convenient and efficient financial management solutions.
  • For instance, a leading app reported a 35% increase in sales following the implementation of automatic bill splitting and real-time balance updates.

What are the Key Data Covered in this Bill Splitting Apps Market Research and Growth Report?

  • What is the expected growth of the Bill Splitting Apps Market between 2024 and 2028?

    • USD 423.6 million, at a CAGR of 11.32%

  • What segmentation does the market report cover?

    • The report is segmented by Platform (Android and iOS), End-user (Private users and Commercial users), and Geography (APAC, North America, Europe, South America, and Middle East and Africa)

  • Which regions are analyzed in the report?

    • APAC, North America, Europe, South America, and Middle East and Africa

  • What are the key growth drivers and market challenges?

    • Rising number of online transactions, High costs associated with bill splitting app development and operation

  • Who are the major players in the Bill Splitting Apps Market?

    • ApTap Ltd., Axio Digital Pvt. Ltd., Bill.com LLC, Block Inc., bring10 LLC, DigiGround Pty Ltd., Groupee Pty Ltd., Kittysplit UG, Microsoft Corp., MWYN Tech Pvt. Ltd., NBK, NatWest Group Plc, Paerpay Inc., PayPal Holdings Inc., Splittr, Splid, Splitwise Inc., Standy Software, Step Up Labs Inc., and Tricount S.A.

Market Research Insights

  • The market for data analytics tools in the bill splitting apps sector continues to evolve, with an increasing focus on enhancing user experience and streamlining payment processes. One notable trend is the integration of payment scheduling and account aggregation features, enabling users to manage their expenses more effectively. For instance, a leading bill splitting app reported a 30% increase in user engagement after implementing these features.
  • Furthermore, industry analysts anticipate a 25% compound annual growth rate in this market over the next five years, driven by the demand for advanced reporting functionalities and improved security protocols.

We can help! Our analysts can customize this bill splitting apps market research report to meet your requirements.

Get in touch

1 Executive Summary

  • 1.1 Market overview
    • Executive Summary - Chart on Market Overview
    • Executive Summary - Data Table on Market Overview
    • Executive Summary - Chart on Global Market Characteristics
    • Executive Summary - Chart on Market by Geography
    • Executive Summary - Chart on Market Segmentation by Platform
    • Executive Summary - Chart on Market Segmentation by End-user
    • Executive Summary - Chart on Incremental Growth
    • Executive Summary - Data Table on Incremental Growth
    • Executive Summary - Chart on Company Market Positioning

2 Market Landscape

  • 2.1 Market ecosystem
    • Parent Market
    • Data Table on - Parent Market
  • 2.2 Market characteristics
    • Market characteristics analysis
  • 2.3 Value chain analysis
    • Value Chain Analysis

3 Market Sizing

  • 3.1 Market definition
    • Offerings of companies included in the market definition
  • 3.2 Market segment analysis
    • Market segments
  • 3.3 Market size 2023
    • 3.4 Market outlook: Forecast for 2023-2028
      • Chart on Global - Market size and forecast 2023-2028 ($ million)
      • Data Table on Global - Market size and forecast 2023-2028 ($ million)
      • Chart on Global Market: Year-over-year growth 2023-2028 (%)
      • Data Table on Global Market: Year-over-year growth 2023-2028 (%)

    4 Historic Market Size

    • 4.1 Global Bill Splitting Apps Market 2018 - 2022
      • Historic Market Size - Data Table on Global Bill Splitting Apps Market 2018 - 2022 ($ million)
    • 4.2 Platform segment analysis 2018 - 2022
      • Historic Market Size - Platform Segment 2018 - 2022 ($ million)
    • 4.3 End-user segment analysis 2018 - 2022
      • Historic Market Size - End-user Segment 2018 - 2022 ($ million)
    • 4.4 Geography segment analysis 2018 - 2022
      • Historic Market Size - Geography Segment 2018 - 2022 ($ million)
    • 4.5 Country segment analysis 2018 - 2022
      • Historic Market Size - Country Segment 2018 - 2022 ($ million)

    5 Five Forces Analysis

    • 5.1 Five forces summary
      • Five forces analysis - Comparison between 2023 and 2028
    • 5.2 Bargaining power of buyers
      • Bargaining power of buyers - Impact of key factors 2023 and 2028
    • 5.3 Bargaining power of suppliers
      • Bargaining power of suppliers - Impact of key factors in 2023 and 2028
    • 5.4 Threat of new entrants
      • Threat of new entrants - Impact of key factors in 2023 and 2028
    • 5.5 Threat of substitutes
      • Threat of substitutes - Impact of key factors in 2023 and 2028
    • 5.6 Threat of rivalry
      • Threat of rivalry - Impact of key factors in 2023 and 2028
    • 5.7 Market condition
      • Chart on Market condition - Five forces 2023 and 2028

    6 Market Segmentation by Platform

    • 6.1 Market segments
      • Chart on Platform - Market share 2023-2028 (%)
      • Data Table on Platform - Market share 2023-2028 (%)
    • 6.2 Comparison by Platform
      • Chart on Comparison by Platform
      • Data Table on Comparison by Platform
    • 6.3 Android - Market size and forecast 2023-2028
      • Chart on Android - Market size and forecast 2023-2028 ($ million)
      • Data Table on Android - Market size and forecast 2023-2028 ($ million)
      • Chart on Android - Year-over-year growth 2023-2028 (%)
      • Data Table on Android - Year-over-year growth 2023-2028 (%)
    • 6.4 iOS - Market size and forecast 2023-2028
      • Chart on iOS - Market size and forecast 2023-2028 ($ million)
      • Data Table on iOS - Market size and forecast 2023-2028 ($ million)
      • Chart on iOS - Year-over-year growth 2023-2028 (%)
      • Data Table on iOS - Year-over-year growth 2023-2028 (%)
    • 6.5 Market opportunity by Platform
      • Market opportunity by Platform ($ million)
      • Data Table on Market opportunity by Platform ($ million)

    7 Market Segmentation by End-user

    • 7.1 Market segments
      • Chart on End-user - Market share 2023-2028 (%)
      • Data Table on End-user - Market share 2023-2028 (%)
    • 7.2 Comparison by End-user
      • Chart on Comparison by End-user
      • Data Table on Comparison by End-user
    • 7.3 Private users - Market size and forecast 2023-2028
      • Chart on Private users - Market size and forecast 2023-2028 ($ million)
      • Data Table on Private users - Market size and forecast 2023-2028 ($ million)
      • Chart on Private users - Year-over-year growth 2023-2028 (%)
      • Data Table on Private users - Year-over-year growth 2023-2028 (%)
    • 7.4 Commercial users - Market size and forecast 2023-2028
      • Chart on Commercial users - Market size and forecast 2023-2028 ($ million)
      • Data Table on Commercial users - Market size and forecast 2023-2028 ($ million)
      • Chart on Commercial users - Year-over-year growth 2023-2028 (%)
      • Data Table on Commercial users - Year-over-year growth 2023-2028 (%)
    • 7.5 Market opportunity by End-user
      • Market opportunity by End-user ($ million)
      • Data Table on Market opportunity by End-user ($ million)

    8 Customer Landscape

    • 8.1 Customer landscape overview
      • Analysis of price sensitivity, lifecycle, customer purchase basket, adoption rates, and purchase criteria

    9 Geographic Landscape

    • 9.1 Geographic segmentation
      • Chart on Market share by geography 2023-2028 (%)
      • Data Table on Market share by geography 2023-2028 (%)
    • 9.2 Geographic comparison
      • Chart on Geographic comparison
      • Data Table on Geographic comparison
    • 9.3 APAC - Market size and forecast 2023-2028
      • Chart on APAC - Market size and forecast 2023-2028 ($ million)
      • Data Table on APAC - Market size and forecast 2023-2028 ($ million)
      • Chart on APAC - Year-over-year growth 2023-2028 (%)
      • Data Table on APAC - Year-over-year growth 2023-2028 (%)
    • 9.4 North America - Market size and forecast 2023-2028
      • Chart on North America - Market size and forecast 2023-2028 ($ million)
      • Data Table on North America - Market size and forecast 2023-2028 ($ million)
      • Chart on North America - Year-over-year growth 2023-2028 (%)
      • Data Table on North America - Year-over-year growth 2023-2028 (%)
    • 9.5 Europe - Market size and forecast 2023-2028
      • Chart on Europe - Market size and forecast 2023-2028 ($ million)
      • Data Table on Europe - Market size and forecast 2023-2028 ($ million)
      • Chart on Europe - Year-over-year growth 2023-2028 (%)
      • Data Table on Europe - Year-over-year growth 2023-2028 (%)
    • 9.6 South America - Market size and forecast 2023-2028
      • Chart on South America - Market size and forecast 2023-2028 ($ million)
      • Data Table on South America - Market size and forecast 2023-2028 ($ million)
      • Chart on South America - Year-over-year growth 2023-2028 (%)
      • Data Table on South America - Year-over-year growth 2023-2028 (%)
    • 9.7 Middle East and Africa - Market size and forecast 2023-2028
      • Chart on Middle East and Africa - Market size and forecast 2023-2028 ($ million)
      • Data Table on Middle East and Africa - Market size and forecast 2023-2028 ($ million)
      • Chart on Middle East and Africa - Year-over-year growth 2023-2028 (%)
      • Data Table on Middle East and Africa - Year-over-year growth 2023-2028 (%)
    • 9.8 US - Market size and forecast 2023-2028
      • Chart on US - Market size and forecast 2023-2028 ($ million)
      • Data Table on US - Market size and forecast 2023-2028 ($ million)
      • Chart on US - Year-over-year growth 2023-2028 (%)
      • Data Table on US - Year-over-year growth 2023-2028 (%)
    • 9.9 China - Market size and forecast 2023-2028
      • Chart on China - Market size and forecast 2023-2028 ($ million)
      • Data Table on China - Market size and forecast 2023-2028 ($ million)
      • Chart on China - Year-over-year growth 2023-2028 (%)
      • Data Table on China - Year-over-year growth 2023-2028 (%)
    • 9.10 India - Market size and forecast 2023-2028
      • Chart on India - Market size and forecast 2023-2028 ($ million)
      • Data Table on India - Market size and forecast 2023-2028 ($ million)
      • Chart on India - Year-over-year growth 2023-2028 (%)
      • Data Table on India - Year-over-year growth 2023-2028 (%)
    • 9.11 Germany - Market size and forecast 2023-2028
      • Chart on Germany - Market size and forecast 2023-2028 ($ million)
      • Data Table on Germany - Market size and forecast 2023-2028 ($ million)
      • Chart on Germany - Year-over-year growth 2023-2028 (%)
      • Data Table on Germany - Year-over-year growth 2023-2028 (%)
    • 9.12 Japan - Market size and forecast 2023-2028
      • Chart on Japan - Market size and forecast 2023-2028 ($ million)
      • Data Table on Japan - Market size and forecast 2023-2028 ($ million)
      • Chart on Japan - Year-over-year growth 2023-2028 (%)
      • Data Table on Japan - Year-over-year growth 2023-2028 (%)
    • 9.13 Market opportunity by geography
      • Market opportunity by geography ($ million)
      • Data Tables on Market opportunity by geography ($ million)

    10 Drivers, Challenges, and Opportunity/Restraints

    • 10.1 Market drivers
      • 10.2 Market challenges
        • 10.3 Impact of drivers and challenges
          • Impact of drivers and challenges in 2023 and 2028
        • 10.4 Market opportunities/restraints

          11 Competitive Landscape

          • 11.1 Overview
            • 11.2 Competitive Landscape
              • Overview on criticality of inputs and factors of differentiation
            • 11.3 Landscape disruption
              • Overview on factors of disruption
            • 11.4 Industry risks
              • Impact of key risks on business

            12 Competitive Analysis

            • 12.1 Companies profiled
              • Companies covered
            • 12.2 Market positioning of companies
              • Matrix on companies position and classification
            • 12.3 ApTap Ltd.
              • ApTap Ltd. - Overview
              • ApTap Ltd. - Product / Service
              • ApTap Ltd. - Key offerings
            • 12.4 Bill.com LLC
              • Bill.com LLC - Overview
              • Bill.com LLC - Product / Service
              • Bill.com LLC - Key offerings
            • 12.5 Block Inc.
              • Block Inc. - Overview
              • Block Inc. - Business segments
              • Block Inc. - Key news
              • Block Inc. - Key offerings
              • Block Inc. - Segment focus
            • 12.6 bring10 LLC
              • bring10 LLC - Overview
              • bring10 LLC - Product / Service
              • bring10 LLC - Key offerings
            • 12.7 DigiGround Pty Ltd.
              • DigiGround Pty Ltd. - Overview
              • DigiGround Pty Ltd. - Product / Service
              • DigiGround Pty Ltd. - Key offerings
            • 12.8 Groupee Pty Ltd.
              • Groupee Pty Ltd. - Overview
              • Groupee Pty Ltd. - Product / Service
              • Groupee Pty Ltd. - Key offerings
            • 12.9 Kittysplit UG
              • Kittysplit UG - Overview
              • Kittysplit UG - Product / Service
              • Kittysplit UG - Key offerings
            • 12.10 Microsoft Corp.
              • Microsoft Corp. - Overview
              • Microsoft Corp. - Business segments
              • Microsoft Corp. - Key news
              • Microsoft Corp. - Key offerings
              • Microsoft Corp. - Segment focus
            • 12.11 MWYN Tech Pvt. Ltd.
              • MWYN Tech Pvt. Ltd. - Overview
              • MWYN Tech Pvt. Ltd. - Product / Service
              • MWYN Tech Pvt. Ltd. - Key offerings
            • 12.12 NBK
              • NBK - Overview
              • NBK - Product / Service
              • NBK - Key offerings
            • 12.13 NatWest Group Plc
              • NatWest Group Plc - Overview
              • NatWest Group Plc - Business segments
              • NatWest Group Plc - Key offerings
              • NatWest Group Plc - Segment focus
            • 12.14 Paerpay Inc.
              • Paerpay Inc. - Overview
              • Paerpay Inc. - Product / Service
              • Paerpay Inc. - Key offerings
            • 12.15 PayPal Holdings Inc.
              • PayPal Holdings Inc. - Overview
              • PayPal Holdings Inc. - Product / Service
              • PayPal Holdings Inc. - Key offerings
            • 12.16 Splid
              • Splid - Overview
              • Splid - Product / Service
              • Splid - Key offerings
            • 12.17 Tricount S.A.
              • Tricount S.A. - Overview
              • Tricount S.A. - Product / Service
              • Tricount S.A. - Key offerings

            13 Appendix

            • 13.1 Scope of the report
              • 13.2 Inclusions and exclusions checklist
                • Inclusions checklist
                • Exclusions checklist
              • 13.3 Currency conversion rates for US$
                • Currency conversion rates for US$
              • 13.4 Research methodology
                • Research methodology
              • 13.5 Data procurement
                • Information sources
              • 13.6 Data validation
                • Data validation
              • 13.7 Validation techniques employed for market sizing
                • Validation techniques employed for market sizing
              • 13.8 Data synthesis
                • Data synthesis
              • 13.9 360 degree market analysis
                • 360 degree market analysis
              • 13.10 List of abbreviations
                • List of abbreviations

              Research Methodology

              Technavio presents a detailed picture of the market by way of study, synthesis, and summation of data from multiple sources. The analysts have presented the various facets of the market with a particular focus on identifying the key industry influencers. The data thus presented is comprehensive, reliable, and the result of extensive research, both primary and secondary.

              INFORMATION SOURCES

              Primary sources

              • Manufacturers and suppliers
              • Channel partners
              • Industry experts
              • Strategic decision makers

              Secondary sources

              • Industry journals and periodicals
              • Government data
              • Financial reports of key industry players
              • Historical data
              • Press releases

              DATA ANALYSIS

              Data Synthesis

              • Collation of data
              • Estimation of key figures
              • Analysis of derived insights

              Data Validation

              • Triangulation with data models
              • Reference against proprietary databases
              • Corroboration with industry experts

              REPORT WRITING

              Qualitative

              • Market drivers
              • Market challenges
              • Market trends
              • Five forces analysis

              Quantitative

              • Market size and forecast
              • Market segmentation
              • Geographical insights
              • Competitive landscape

              Interested in this report?

              Get your sample now to see our research methodology and insights!

              Download Now

              Frequently Asked Questions

              Bill Splitting Apps market growth will increase by $ 423.6 mn during 2024-2028.

              The Bill Splitting Apps market is expected to grow at a CAGR of 11.32% during 2024-2028.

              Bill Splitting Apps market is segmented by Platform( Android, iOS, Europe, South America, Middle East and Africa) End-user( Private users, Commercial users, Europe, South America, Middle East and Africa)

              ApTap Ltd., Axio Digital Pvt. Ltd., Bill.com LLC, Block Inc., bring10 LLC, DigiGround Pty Ltd., Groupee Pty Ltd., Kittysplit UG, Microsoft Corp., MWYN Tech Pvt. Ltd., NBK, NatWest Group Plc, Paerpay Inc., PayPal Holdings Inc., Splittr, Splid, Splitwise Inc., Standy Software, Step Up Labs Inc., Tricount S.A. are a few of the key vendors in the Bill Splitting Apps market.

              APAC will register the highest growth rate of 50% among the other regions. Therefore, the Bill Splitting Apps market in APAC is expected to garner significant business opportunities for the vendors during the forecast period.

              US, China, India, Germany, Japan

              • Rising number of online transactionsOnline transactions are gaining importance among individual consumers is the driving factor this market.
              • as they are very easy is the driving factor this market.
              • quick is the driving factor this market.
              • and convenient to use when compared with traditional methods. Consumers are also using smartphones to make online transactions at any time. Moreover is the driving factor this market.
              • digital wallets are becoming the most popular mode of payment due to features such as easy registration and login is the driving factor this market.
              • robust merchant and consumer payment processing capability is the driving factor this market.
              • and a user-friendly dashboard. The increasing adoption of mobile devices and wearables has popularized the use of mobile payments. Many retailers are adopting platforms such as NFC POS terminals that facilitate mobile payments. NFC POS terminals also boost the value and effectiveness of a retailers marketing efforts. The process of streamlining operations helps retailers generate more revenue. Retailers worldwide realize the benefits of NFC POS terminals and are aligning them with their operations and processes to enhance the overall relationship between their respective brands and customers. The high adoption of contactless Europay is the driving factor this market.
              • MasterCard is the driving factor this market.
              • and Visa (EMV) cards will likely encourage the implementation of NFC POS terminals. The growing need for faster checkouts at retail outlets is the driving factor this market.
              • the high adoption of EMV cards is the driving factor this market.
              • effective information management among retailers is the driving factor this market.
              • and the increased focus on secure payments contribute to the growth of the global digital payment market.The increasing use of smartphones across the world has provided potential growth opportunities for bill splitting apps. The smartphone market has been growing rapidly over the years. The majority of the growth of this market comes from low-priced smartphones (above $200). The proliferation of low-priced smartphones has resulted in their high demand in countries such as India is the driving factor this market.
              • Vietnam is the driving factor this market.
              • the Philippines is the driving factor this market.
              • Sri Lanka is the driving factor this market.
              • and Pakistan in APAC. Spain and Greece in Europe are also registering a surge in the sales of low-priced smartphones. Developing countries such as China and India are becoming high-growth potential markets for low-cost smartphones. Many Chinese mobile computing device manufacturers are making significant profits through the sales of low-cost smartphones.Among all devices is the driving factor this market.
              • smartphones offer the largest platform for the use of bill splitting apps. Smartphones have a significant share of the overall global mobile phone market. Their share is further expected to increase is the driving factor this market.
              • and smartphones are expected to account for over three out of every four mobile phones sold by 2025. This can be ascertained by the growing demand for smartphones.With increasing demand is the driving factor this market.
              • smartphone manufacturers are focusing on launching new mobile phones with enhanced features. These functions include multitasking apps is the driving factor this market.
              • wherein users can operate multiple mobile phone apps at the same time. Moreover is the driving factor this market.
              • there has been an increasing focus on upgrading smartphone features. Thus is the driving factor this market.
              • the high penetration of low-cost is the driving factor this market.
              • affordable smartphones and the new launches of high-end smartphones will increase the potential user base for several mobile phone apps is the driving factor this market.
              • including expense management applications such as bill splitting apps. Thus is the driving factor this market.
              • the growing penetration of smartphones across the world is expected to drive the global bill splitting apps market during the forecast period.??????? is the driving factor this market.

              The Bill Splitting Apps market vendors should focus on grabbing business opportunities from the Android segment as it accounted for the largest market share in the base year.