Biobanking Market Analysis, Size, and Forecast 2024-2028: North America (US and Canada), Europe (France, Germany, Italy, and UK), Middle East and Africa (Egypt, KSA, Oman, and UAE), APAC (China, India, and Japan), South America (Argentina and Brazil), and Rest of World (ROW)

Biobanking Market Analysis, Size, and Forecast 2024-2028:
North America (US and Canada), Europe (France, Germany, Italy, and UK), Middle East and Africa (Egypt, KSA, Oman, and UAE), APAC (China, India, and Japan), South America (Argentina and Brazil), and Rest of World (ROW)

Published: May 2024 159 Pages SKU: IRTNTR70756

Market Overview at a Glance

$1.67 B
Market Opportunity
9.04%
CAGR
8.36
YoY growth 2023-2024(%)

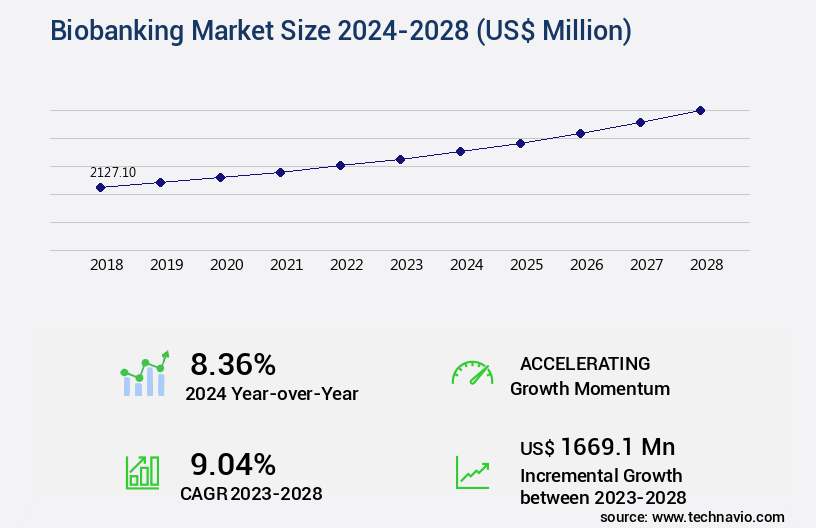
Biobanking Market Size 2024-2028

The biobanking market size is valued to increase USD 1.67 billion, at a CAGR of 9.04% from 2023 to 2028. Growing demand for personalized medicine will drive the biobanking market.

Major Market Trends & Insights

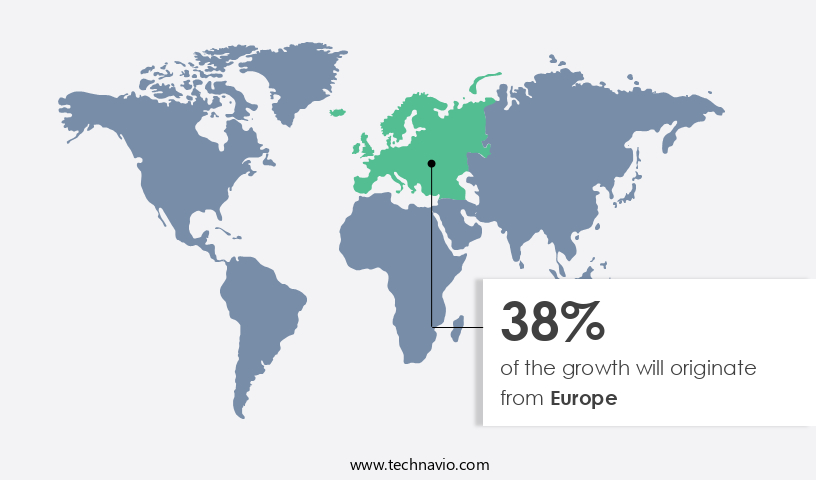
  • Europe dominated the market and accounted for a 38% growth during the forecast period.
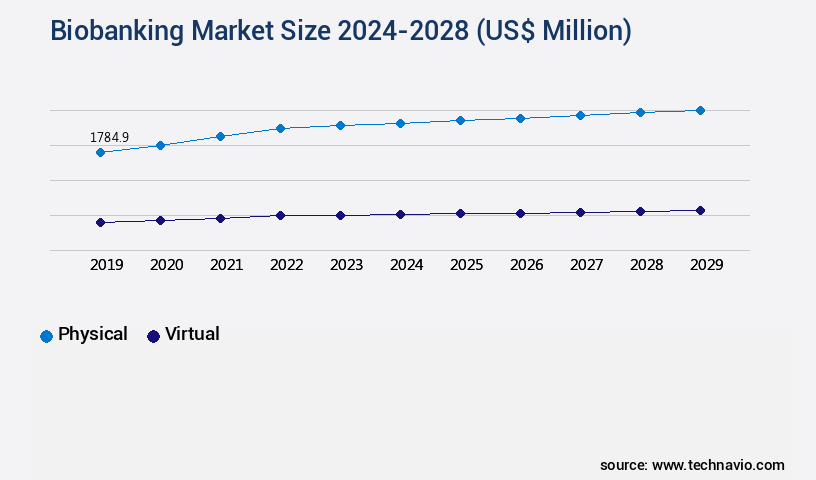
  • By Type - Physical segment was valued at USD 1.66 billion in 2022
  • By Product - Equipment segment accounted for the largest market revenue share in 2022

Market Size & Forecast

  • Market Opportunities: USD 123.36 million
  • Market Future Opportunities: USD 1669.10 million
  • CAGR from 2023 to 2028 : 9.04%

Market Summary

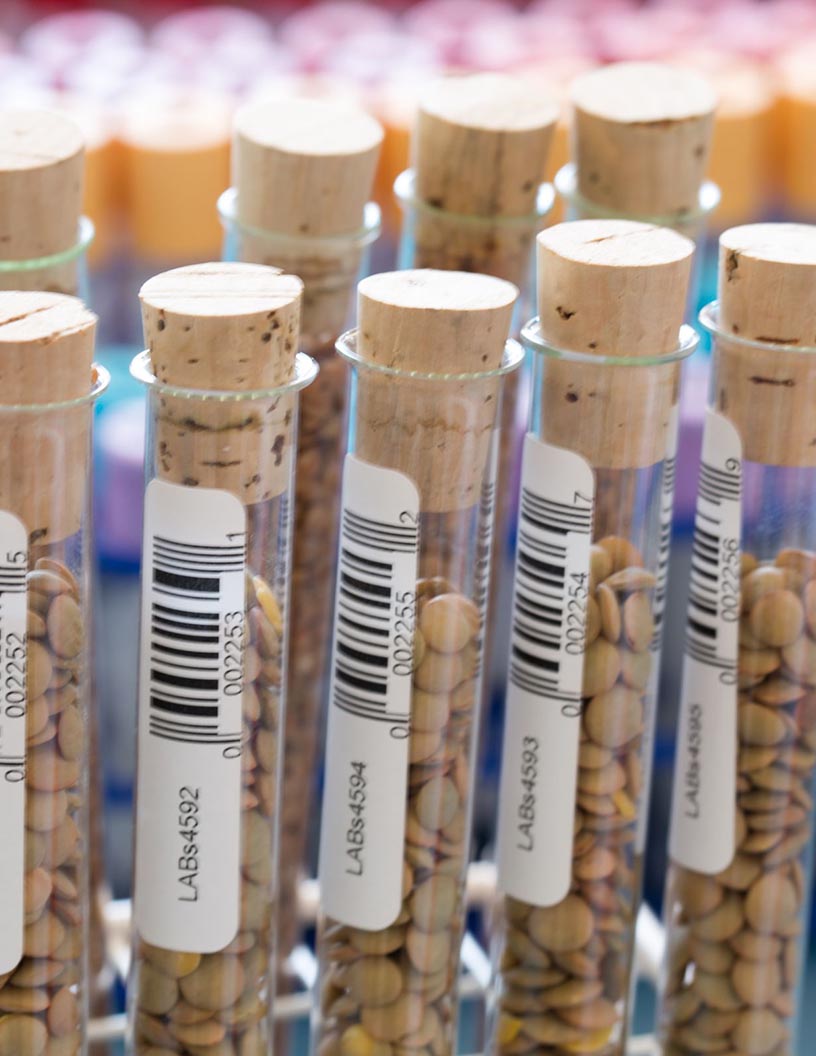
  • The market encompasses the production, storage, and distribution of biological samples for research and diagnostic purposes. This dynamic market is driven by the growing demand for personalized medicine, with core technologies such as nucleic acid isolation and cryopreservation playing crucial roles. The emergence of stem cell storage in biobanks represents a significant opportunity, as these cells hold immense potential for disease research and regenerative therapies. However, the market also faces challenges, including ethical issues surrounding informed consent and data privacy.
  • According to a recent report, the market is expected to account for over 20% of the global diagnostics market by 2025, underscoring its growing importance in the healthcare industry. Despite these opportunities and challenges, the market continues to evolve, with ongoing research and innovation shaping its future trajectory.

What will be the Size of the Biobanking Market during the forecast period?

Biobanking Market Size

Get Key Insights on Market Forecast (PDF) Request Free Sample

How is the Biobanking Market Segmented ?

The biobanking industry research report provides comprehensive data (region-wise segment analysis), with forecasts and estimates in "USD million" for the period 2024-2028, as well as historical data from 2018-2022 for the following segments.

  • Type
    • Physical
    • Virtual
  • Product
    • Equipment
    • Consumables
  • End-User
    • Pharmaceutical & Biotechnology Companies
    • Academic & Research Institutions
    • Hospitals
    • Contract Research Organizations (CROs)
  • Application
    • Regenerative Medicine
    • Life Science Research
    • Clinical Research
    • Drug Discovery & Development
    • Personalized Medicine
  • Sample Type
    • Blood Products
    • Human Tissues
    • Cell Lines
    • Nucleic Acids
    • Biological Fluids
    • Human Waste Products
  • Biobank Type
    • Population-Based Biobanks
    • Disease-Based Biobanks
    • Virtual Biobanks
    • Tissue Biobanks
    • Genetic Biobanks
  • Geography
    • North America
      • US
      • Canada
    • Europe
      • France
      • Germany
      • Italy
      • UK
    • Middle East and Africa
      • Egypt
      • KSA
      • Oman
      • UAE
    • APAC
      • China
      • India
      • Japan
    • South America
      • Argentina
      • Brazil
    • Rest of World (ROW)

    By Type Insights

    The physical segment is estimated to witness significant growth during the forecast period.

    Biobanks, essential repositories for storing and managing biological samples, have gained significant traction due to the increasing focus on personalized medicine. These institutions house various types of samples, including human tissues, cells, blood, DNA, and biomolecules, for research and medical applications. The classification of biobanks is based on the physical nature of the samples, resulting in tissue biobanks, cell biobanks, and blood biobanks. Automation solutions play a crucial role in enhancing the efficiency of biobanking processes. Long-term storage is a critical aspect, with ultra-low temperature freezers and liquid nitrogen storage ensuring sample integrity. Microbial contamination prevention and cross-contamination prevention are essential for maintaining sample quality.

    Informed consent processes, sample tracking systems, and regulatory compliance are integral components of biobanking operations. Sample distribution, quality control metrics, tissue processing workflows, and LIMs integration are other essential elements. Data security measures, RNA isolation protocols, viability assays, cryopreservation techniques, sample annotation standards, and sample integrity are crucial for maintaining the integrity and usability of the stored samples. Ethics review boards oversee ethical considerations, while inventory management systems, quality assurance, sample retrieval, and data privacy regulations ensure compliance and transparency. Cell culture media, DNA extraction methods, and biospecimen management are essential for sample preparation and processing.

    Biorepository informatics, sample storage systems, database integration, vapor phase storage, and inventory management systems facilitate efficient data management and access. The market for biobanking solutions is expanding, with a reported 15% of hospitals and research institutions adopting biobanking services. Furthermore, industry experts anticipate a 17% increase in the adoption of biobanking services by pharmaceutical and biotech companies. These trends underscore the growing importance of biobanking in advancing medical research and personalized medicine.

    Biobanking Market Size

    Request Free Sample

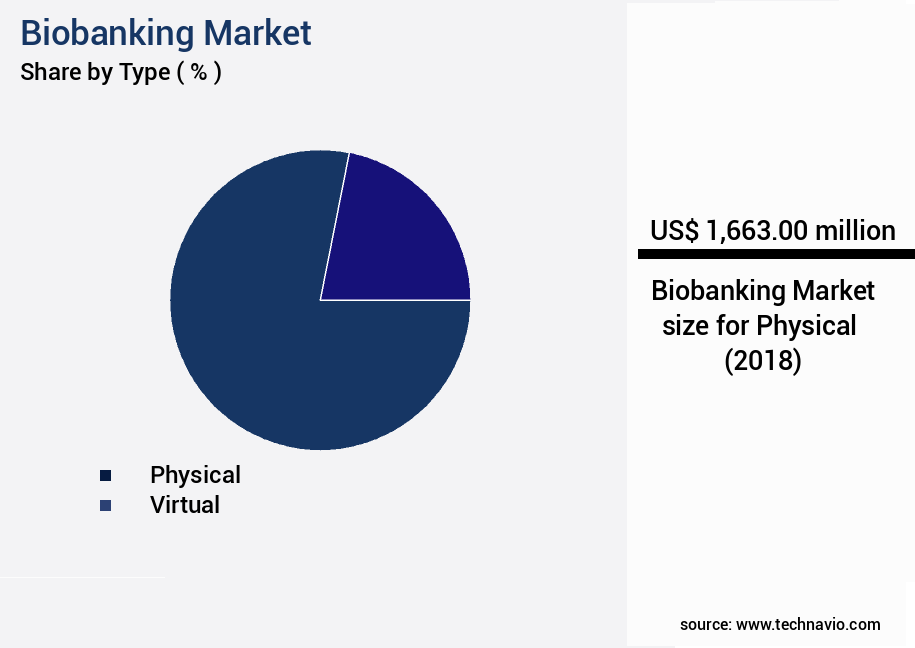
    The Physical segment was valued at USD 1.66 billion in 2018 and showed a gradual increase during the forecast period.

    Biobanking Market Size

    Request Free Sample

    Regional Analysis

    Europe is estimated to contribute 38% to the growth of the global market during the forecast period.Technavio’s analysts have elaborately explained the regional trends and drivers that shape the market during the forecast period.

    Biobanking Market Share by Geography

    See How Biobanking Market Demand is Rising in Europe Request Free Sample

    The European the market is characterized by a significant presence of established biobanks, with over 60% of the global total located in the region. This trend is largely due to the well-developed biobanking systems in Nordic countries such as Sweden, Norway, Denmark, Finland, Iceland, and France, among others. These nations have been at the forefront of population-based biobanking and possess a high degree of expertise. Advanced biobanks and effective public health services are the primary drivers of these robust biobanking systems.

    Currently, more than 10 million biological samples are stored in European biobanks, with an annual growth rate of approximately 5%. This growth can be attributed to the increasing demand for research and personalized medicine, as well as the expansion of existing biobanks.

    Market Dynamics

    Our researchers analyzed the data with 2023 as the base year, along with the key drivers, trends, and challenges. A holistic analysis of drivers will help companies refine their marketing strategies to gain a competitive advantage.

    The market is a critical sector in the life sciences industry, driven by the increasing demand for automated sample processing workflows and high-throughput screening techniques to accelerate research and development in various fields. Biobanks employ cryopreservation optimization strategies to maintain biospecimen quality, ensuring their integrity during long-term storage. Stringent biospecimen quality control procedures and sample tracking and traceability systems are essential to ensure data integrity and regulatory compliance for biorepositories. Secure data management and access control are vital components of modern biobanking, as advanced data analysis for biobanking becomes increasingly sophisticated. Regulatory compliance for biorepositories is a significant concern, with ethical considerations in biobanking playing an essential role in shaping industry best practices.

    Integration of Laboratory Information Management Systems (LIMS) and biorepository systems is a key trend, enabling cross-platform data integration and effective sample management strategies. Preventative maintenance of storage equipment and validation of sample preparation methods are crucial for maintaining biospecimen quality assurance programs. Advanced statistical analysis of biobanking data and implementation of data security measures are essential to ensure data privacy and security. The industrial application segment accounts for a significantly larger share of the market compared to the academic segment, with more than 70% of new product developments focusing on industrial applications. Efficient sample retrieval protocols and best practices for sample annotation are essential for maximizing the value of biospecimens.

    Cross-platform data integration and effective sample management strategies enable researchers to access and analyze data more efficiently, driving innovation and discovery in various fields. In conclusion, the market is a dynamic and evolving sector, with a strong focus on automation, data security, and regulatory compliance.

    Biobanking Market Size

    What are the key market drivers leading to the rise in the adoption of Biobanking Industry?

    • The expanding need for personalized medicine serves as the primary catalyst for market growth. 

    • The unmet medical need for effective therapies has fueled the demand for personalized medicine, leading to a significant increase in the utilization of biobanks. Personalized medicine, which involves treatments tailored to individual characteristics, needs, and preferences, necessitates the availability of individual samples with annotated clinical and pathological data. Research organizations are actively seeking ways to develop personalized treatments using biological samples, making biobanks an essential component of this evolving landscape. The growing demand for personalized medicine is driving the global expansion of biobanks, offering potential opportunities for companies in this sector.
    • This trend is not limited to healthcare; biobanks also find applications in various industries, including agriculture and research. The potential for personalized treatments using biological samples is vast, making the biobank market a dynamic and evolving one.

    What are the market trends shaping the Biobanking Industry?

    • The emergence of stem cell storage in biobanks represents a significant market trend. This innovative development is poised to shape the future of regenerative medicine.

    • The demand for stem cell storage in biobanks is experiencing significant expansion, significantly influencing market progression during the forecast period. The utilization of biobanking solutions in stem cell research is enhancing access to innovative therapeutic options for a broader population. Stem cells are reported to address numerous unmet medical requirements in sectors like cardiology and oncology. Consequently, there is a surge in the establishment of specialized biobanking facilities dedicated to stem cell research.
    • For example, the Global Stem Cells Group inaugurated operations at its new clinics in Arica and Iquique, Chile. This trend underscores the dynamic nature of the market and its applications across various industries.

    What challenges does the Biobanking Industry face during its growth?

    • The industry's expansion is significantly hindered by the escalating ethical concerns that pose a major challenge. 

    • Biobanking, the preservation of biological samples for research and diagnostic purposes, continues to evolve, raising ethical concerns and debates. Protecting individuals' identities is paramount, with informed consent being a crucial first step. However, potential misuse of biobank data by private companies adds to the ethical dilemma. The ongoing debate surrounding the use of biological samples, such as tissues and stem cells, is a contentious issue in many countries.
    • Disagreements persist regarding the storage and application of human embryonic stem cells in research, sparking ongoing discussions among scientists and policymakers. These ethical concerns underscore the importance of establishing clear guidelines and regulations to ensure the proper handling and use of biological samples in a professional and ethical manner.

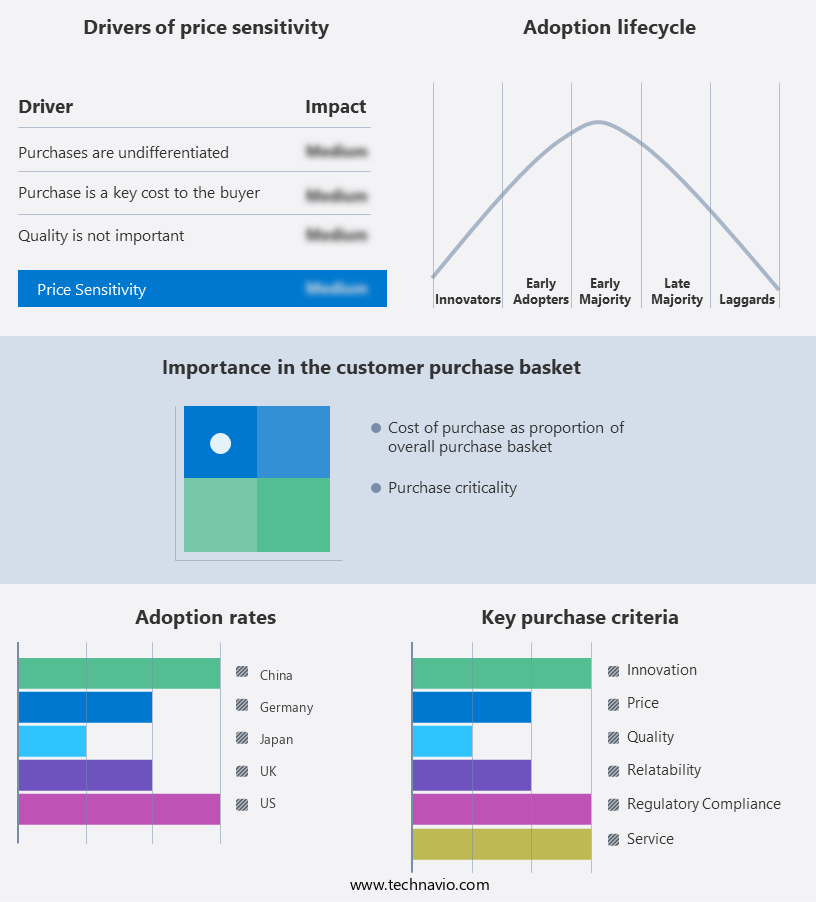
    Exclusive Technavio Analysis on Customer Landscape

    The biobanking market forecasting report includes the adoption lifecycle of the market, covering from the innovator’s stage to the laggard’s stage. It focuses on adoption rates in different regions based on penetration. Furthermore, the biobanking market report also includes key purchase criteria and drivers of price sensitivity to help companies evaluate and develop their market growth analysis strategies.

    Biobanking Market Share by Geography

     Customer Landscape of Biobanking Industry

    Competitive Landscape

    Companies are implementing various strategies, such as strategic alliances, biobanking market forecast, partnerships, mergers and acquisitions, geographical expansion, and product/service launches, to enhance their presence in the industry.

    AMS Biotechnology Europe Ltd. - This company specializes in providing a range of high-quality biobanking solutions, including Pig Liver Total RNA, Zebrafish Genomic DNA, and Human tonsil normal FFPE tissue blocks. Their offerings cater to various research needs, ensuring scientific advancements with reliable and authentic biological materials.

    The industry research and growth report includes detailed analyses of the competitive landscape of the market and information about key companies, including:

    • AMS Biotechnology Europe Ltd.
    • ASKION GmbH
    • Azenta Inc.
    • Bay Biosciences LLC
    • BioIVT LLC
    • Boca Biolistics LLC
    • CTIBiotech
    • Cureline Inc.
    • Danaher Corp.
    • Firalis SA
    • GENETICIST Inc.
    • Greiner Bio One International GmbH
    • Hamilton Co.
    • OraSure Technologies Inc.
    • PHC Holdings Corp.
    • Promega Corp.
    • ProteoGenex Inc.
    • Shanghai Genext Medical Technology Co. Ltd.
    • Thermo Fisher Scientific Inc.
    • US Biolab Corp. Inc.

    Qualitative and quantitative analysis of companies has been conducted to help clients understand the wider business environment as well as the strengths and weaknesses of key industry players. Data is qualitatively analyzed to categorize companies as pure play, category-focused, industry-focused, and diversified; it is quantitatively analyzed to categorize companies as dominant, leading, strong, tentative, and weak.

    Recent Development and News in Biobanking Market

    • In January 2024, Thermo Fisher Scientific, a leading life sciences solutions provider, announced the launch of its new Carrier Screening Service, expanding its portfolio in the market. This service enables laboratories to offer comprehensive carrier screening tests, helping identify genetic risks before pregnancy (Thermo Fisher Scientific Press Release, 2024).
    • In March 2024, Illumina and F. Hoffmann-La Roche Ltd. Entered into a strategic collaboration to develop and commercialize a new solution for long-read, whole-genome sequencing. This partnership combines Illumina's sequencing technology with Roche's clinical and diagnostic expertise, aiming to advance precision medicine and biobanking applications (Illumina Press Release, 2024).
    • In May 2024, Qiagen announced the acquisition of Bio-IT Technology, a leading bioinformatics software provider. This acquisition strengthens Qiagen's position in the market by enhancing its software offerings for managing and analyzing large genomic data sets (Qiagen Press Release, 2024).
    • In April 2025, the European Union approved the Horizon Europe research and innovation program, allocating €95.5 billion (approximately USD107 billion) for the period 2021-2027. A significant portion of this funding will be dedicated to personalized medicine and biobanking initiatives, boosting the European the market's growth prospects (European Commission Press Release, 2021).

    Dive into Technavio’s robust research methodology, blending expert interviews, extensive data synthesis, and validated models for unparalleled Biobanking Market insights. See full methodology.

    Market Scope

    Report Coverage

    Details

    Page number

    159

    Base year

    2023

    Historic period

    2018-2022

    Forecast period

    2024-2028

    Growth momentum & CAGR

    Accelerate at a CAGR of 9.04%

    Market growth 2024-2028

    USD 1669.1 million

    Market structure

    Fragmented

    YoY growth 2023-2024(%)

    8.36

    Key countries

    US, Canada, Germany, UK, Italy, France, China, India, Japan, Brazil, Egypt, UAE, Oman, Argentina, KSA, UAE, Brazil, and Rest of World (ROW)

    Competitive landscape

    Leading Companies, Market Positioning of Companies, Competitive Strategies, and Industry Risks

    Request Free Sample

    Research Analyst Overview

    • In the dynamic and evolving the market, automation solutions have become a crucial component for efficient long-term storage and management of various biospecimens. These solutions mitigate the risks of microbial contamination and cross-contamination, ensuring sample integrity. Ultra-low temperature freezers, a significant investment in biobanking infrastructure, maintain samples at optimal temperatures for extended periods. Cross-contamination prevention is achieved through stringent sample tracking systems and regulatory compliance measures. Quality control metrics, such as tissue processing workflows and LIMs integration, ensure standardization and accuracy. Data security measures are essential in biobanking, with biorepository informatics and database integration playing a vital role in maintaining data privacy regulations.
    • Vapor phase storage and inventory management systems further enhance the efficiency of sample retrieval and distribution. Sample annotation standards and ethics review boards ensure the ethical handling and use of biospecimens. Technological advancements include RNA isolation protocols, cryopreservation techniques, and DNA extraction methods. Viability assays and quality assurance processes are integral to maintaining sample integrity, while data integrity and cell culture media are crucial for maintaining sample health during storage. Regulatory compliance is a continuous process, with ongoing updates and adjustments to ensure the highest standards are met. The market activities reflect a focus on innovation, with advancements in sample storage systems, data privacy regulations, and tissue processing workflows.
    • The integration of LIMs, data security measures, and biorepository informatics has streamlined operations and improved overall efficiency. In the competitive landscape, biobanks strive for excellence in sample integrity, regulatory compliance, and data security, setting the stage for a robust and evolving market.

    What are the Key Data Covered in this Biobanking Market Research and Growth Report?

    • What is the expected growth of the Biobanking Market between 2024 and 2028?

      • USD 1.67 billion, at a CAGR of 9.04%

    • What segmentation does the market report cover?

      • The report is segmented by Type (Physical and Virtual), Product (Equipment and Consumables), Geography (Europe, North America, Asia, and Rest of World (ROW)), End-User (Pharmaceutical & Biotechnology Companies, Academic & Research Institutions, Hospitals, and Contract Research Organizations (CROs)), Application (Regenerative Medicine, Life Science Research, Clinical Research, Drug Discovery & Development, and Personalized Medicine), Sample Type (Blood Products, Human Tissues, Cell Lines, Nucleic Acids, Biological Fluids, and Human Waste Products), and Biobank Type (Population-Based Biobanks, Disease-Based Biobanks, Virtual Biobanks, Tissue Biobanks, and Genetic Biobanks)

    • Which regions are analyzed in the report?

      • Europe, North America, Asia, and Rest of World (ROW)

    • What are the key growth drivers and market challenges?

      • Growing demand for personalized medicine, Increasing ethical issues

    • Who are the major players in the Biobanking Market?

      • AMS Biotechnology Europe Ltd., ASKION GmbH, Azenta Inc., Bay Biosciences LLC, BioIVT LLC, Boca Biolistics LLC, CTIBiotech, Cureline Inc., Danaher Corp., Firalis SA, GENETICIST Inc., Greiner Bio One International GmbH, Hamilton Co., OraSure Technologies Inc., PHC Holdings Corp., Promega Corp., ProteoGenex Inc., Shanghai Genext Medical Technology Co. Ltd., Thermo Fisher Scientific Inc., and US Biolab Corp. Inc.

    Market Research Insights

    • The market encompasses the collection, processing, storage, and distribution of biospecimens for research and diagnostic purposes. This sector continues to evolve, integrating advanced technologies such as metabolomic and proteomic analysis, genomic sequencing, and data mining. Quality control and sample preparation are crucial components, ensuring audit trails and maintaining biospecimen preservation. Machine learning and predictive modeling facilitate data analysis, while validation studies ensure data accuracy. Performance metrics and user authentication provide access control and security. Sample labeling methods and data standardization enable effective metadata management and disease research.
    • Biobanking plays a pivotal role in drug discovery, personalized medicine, regenerative medicine, and clinical trials, with an estimated 1.5 billion biospecimens in use worldwide. The market's value is projected to reach USD20 billion by 2025, growing at a significant rate due to the increasing demand for biomarker discovery and precision medicine applications.

    We can help! Our analysts can customize this biobanking market research report to meet your requirements.

    Get in touch

    1 Executive Summary

    • 1.1 Market overview
      • Executive Summary - Chart on Market Overview
      • Executive Summary - Data Table on Market Overview
      • Executive Summary - Chart on Global Market Characteristics
      • Executive Summary - Chart on Market by Geography
      • Executive Summary - Chart on Market Segmentation by Type
      • Executive Summary - Chart on Market Segmentation by Product
      • Executive Summary - Chart on Incremental Growth
      • Executive Summary - Data Table on Incremental Growth
      • Executive Summary - Chart on Company Market Positioning

    2 Market Landscape

    • 2.1 Market ecosystem
      • Parent Market
      • Data Table on - Parent Market
    • 2.2 Market characteristics
      • Market characteristics analysis
    • 2.3 Value chain analysis
      • Value Chain Analysis

    3 Market Sizing

    • 3.1 Market definition
      • Offerings of companies included in the market definition
    • 3.2 Market segment analysis
      • Market segments
    • 3.3 Market size 2023
      • 3.4 Market outlook: Forecast for 2023-2028
        • Chart on Global - Market size and forecast 2023-2028 ($ million)
        • Data Table on Global - Market size and forecast 2023-2028 ($ million)
        • Chart on Global Market: Year-over-year growth 2023-2028 (%)
        • Data Table on Global Market: Year-over-year growth 2023-2028 (%)

      4 Historic Market Size

      • 4.1 Global Biobanking Market 2018 - 2022
        • Historic Market Size - Data Table on Global Biobanking Market 2018 - 2022 ($ million)
      • 4.2 Type segment analysis 2018 - 2022
        • Historic Market Size - Type Segment 2018 - 2022 ($ million)
      • 4.3 Product segment analysis 2018 - 2022
        • Historic Market Size - Product Segment 2018 - 2022 ($ million)
      • 4.4 Geography segment analysis 2018 - 2022
        • Historic Market Size - Geography Segment 2018 - 2022 ($ million)
      • 4.5 Country segment analysis 2018 - 2022
        • Historic Market Size - Country Segment 2018 - 2022 ($ million)

      5 Five Forces Analysis

      • 5.1 Five forces summary
        • Five forces analysis - Comparison between 2023 and 2028
      • 5.2 Bargaining power of buyers
        • Bargaining power of buyers - Impact of key factors 2023 and 2028
      • 5.3 Bargaining power of suppliers
        • Bargaining power of suppliers - Impact of key factors in 2023 and 2028
      • 5.4 Threat of new entrants
        • Threat of new entrants - Impact of key factors in 2023 and 2028
      • 5.5 Threat of substitutes
        • Threat of substitutes - Impact of key factors in 2023 and 2028
      • 5.6 Threat of rivalry
        • Threat of rivalry - Impact of key factors in 2023 and 2028
      • 5.7 Market condition
        • Chart on Market condition - Five forces 2023 and 2028

      6 Market Segmentation by Type

      • 6.1 Market segments
        • Chart on Type - Market share (2023-2028) (%)
        • Data Table on Type - Market share (2023-2028) (%)
      • 6.2 Comparison by Type
        • Chart on Comparison by Type
        • Data Table on Comparison by Type
      • 6.3 Physical - Market size and forecast (2023-2028)
        • Chart on Physical - Market size and forecast (2023-2028) ($ million)
        • Data Table on Physical - Market size and forecast (2023-2028) ($ million)
        • Chart on Physical - Year-over-year growth (2023-2028) (%)
        • Data Table on Physical - Year-over-year growth (2023-2028) (%)
      • 6.4 Virtual - Market size and forecast (2023-2028)
        • Chart on Virtual - Market size and forecast (2023-2028) ($ million)
        • Data Table on Virtual - Market size and forecast (2023-2028) ($ million)
        • Chart on Virtual - Year-over-year growth (2023-2028) (%)
        • Data Table on Virtual - Year-over-year growth (2023-2028) (%)
      • 6.5 Market opportunity by Type
        • Market opportunity by Type ($ million)
        • Data Table on Market opportunity by Type ($ million)

      7 Market Segmentation by Product

      • 7.1 Market segments
        • Chart on Product - Market share (2023-2028) (%)
        • Data Table on Product - Market share (2023-2028) (%)
      • 7.2 Comparison by Product
        • Chart on Comparison by Product
        • Data Table on Comparison by Product
      • 7.3 Equipment - Market size and forecast (2023-2028)
        • Chart on Equipment - Market size and forecast (2023-2028) ($ million)
        • Data Table on Equipment - Market size and forecast (2023-2028) ($ million)
        • Chart on Equipment - Year-over-year growth (2023-2028) (%)
        • Data Table on Equipment - Year-over-year growth (2023-2028) (%)
      • 7.4 Consumables - Market size and forecast (2023-2028)
        • Chart on Consumables - Market size and forecast (2023-2028) ($ million)
        • Data Table on Consumables - Market size and forecast (2023-2028) ($ million)
        • Chart on Consumables - Year-over-year growth (2023-2028) (%)
        • Data Table on Consumables - Year-over-year growth (2023-2028) (%)
      • 7.5 Market opportunity by Product
        • Market opportunity by Product ($ million)
        • Data Table on Market opportunity by Product ($ million)

      8 Market Segmentation by End-User

      • 8.1 Market segments
        • Chart on End-User - Market share (2023-2028) (%)
        • Data Table on End-User - Market share (2023-2028) (%)
      • 8.2 Comparison by End-User
        • Chart on Comparison by End-User
        • Data Table on Comparison by End-User
      • 8.3 Pharmaceutical & Biotechnology Companies - Market size and forecast (2023-2028)
        • Chart on Pharmaceutical & Biotechnology Companies - Market size and forecast (2023-2028) ($ million)
        • Data Table on Pharmaceutical & Biotechnology Companies - Market size and forecast (2023-2028) ($ million)
        • Chart on Pharmaceutical & Biotechnology Companies - Year-over-year growth (2023-2028) (%)
        • Data Table on Pharmaceutical & Biotechnology Companies - Year-over-year growth (2023-2028) (%)
      • 8.4 Academic & Research Institutions - Market size and forecast (2023-2028)
        • Chart on Academic & Research Institutions - Market size and forecast (2023-2028) ($ million)
        • Data Table on Academic & Research Institutions - Market size and forecast (2023-2028) ($ million)
        • Chart on Academic & Research Institutions - Year-over-year growth (2023-2028) (%)
        • Data Table on Academic & Research Institutions - Year-over-year growth (2023-2028) (%)
      • 8.5 Hospitals - Market size and forecast (2023-2028)
        • Chart on Hospitals - Market size and forecast (2023-2028) ($ million)
        • Data Table on Hospitals - Market size and forecast (2023-2028) ($ million)
        • Chart on Hospitals - Year-over-year growth (2023-2028) (%)
        • Data Table on Hospitals - Year-over-year growth (2023-2028) (%)
      • 8.6 Contract Research Organizations (CROs) - Market size and forecast (2023-2028)
        • Chart on Contract Research Organizations (CROs) - Market size and forecast (2023-2028) ($ million)
        • Data Table on Contract Research Organizations (CROs) - Market size and forecast (2023-2028) ($ million)
        • Chart on Contract Research Organizations (CROs) - Year-over-year growth (2023-2028) (%)
        • Data Table on Contract Research Organizations (CROs) - Year-over-year growth (2023-2028) (%)
      • 8.7 Market opportunity by End-User
        • Market opportunity by End-User ($ million)
        • Data Table on Market opportunity by End-User ($ million)

      9 Market Segmentation by Application

      • 9.1 Market segments
        • Chart on Application - Market share (2023-2028) (%)
        • Data Table on Application - Market share (2023-2028) (%)
      • 9.2 Comparison by Application
        • Chart on Comparison by Application
        • Data Table on Comparison by Application
      • 9.3 Regenerative Medicine - Market size and forecast (2023-2028)
        • Chart on Regenerative Medicine - Market size and forecast (2023-2028) ($ million)
        • Data Table on Regenerative Medicine - Market size and forecast (2023-2028) ($ million)
        • Chart on Regenerative Medicine - Year-over-year growth (2023-2028) (%)
        • Data Table on Regenerative Medicine - Year-over-year growth (2023-2028) (%)
      • 9.4 Life Science Research - Market size and forecast (2023-2028)
        • Chart on Life Science Research - Market size and forecast (2023-2028) ($ million)
        • Data Table on Life Science Research - Market size and forecast (2023-2028) ($ million)
        • Chart on Life Science Research - Year-over-year growth (2023-2028) (%)
        • Data Table on Life Science Research - Year-over-year growth (2023-2028) (%)
      • 9.5 Clinical Research - Market size and forecast (2023-2028)
        • Chart on Clinical Research - Market size and forecast (2023-2028) ($ million)
        • Data Table on Clinical Research - Market size and forecast (2023-2028) ($ million)
        • Chart on Clinical Research - Year-over-year growth (2023-2028) (%)
        • Data Table on Clinical Research - Year-over-year growth (2023-2028) (%)
      • 9.6 Drug Discovery & Development - Market size and forecast (2023-2028)
        • Chart on Drug Discovery & Development - Market size and forecast (2023-2028) ($ million)
        • Data Table on Drug Discovery & Development - Market size and forecast (2023-2028) ($ million)
        • Chart on Drug Discovery & Development - Year-over-year growth (2023-2028) (%)
        • Data Table on Drug Discovery & Development - Year-over-year growth (2023-2028) (%)
      • 9.7 Personalized Medicine - Market size and forecast (2023-2028)
        • Chart on Personalized Medicine - Market size and forecast (2023-2028) ($ million)
        • Data Table on Personalized Medicine - Market size and forecast (2023-2028) ($ million)
        • Chart on Personalized Medicine - Year-over-year growth (2023-2028) (%)
        • Data Table on Personalized Medicine - Year-over-year growth (2023-2028) (%)
      • 9.8 Market opportunity by Application
        • Market opportunity by Application ($ million)
        • Data Table on Market opportunity by Application ($ million)

      10 Market Segmentation by Sample Type

      • 10.1 Market segments
        • Chart on Sample Type - Market share (2023-2028) (%)
        • Data Table on Sample Type - Market share (2023-2028) (%)
      • 10.2 Comparison by Sample Type
        • Chart on Comparison by Sample Type
        • Data Table on Comparison by Sample Type
      • 10.3 Blood Products - Market size and forecast (2023-2028)
        • Chart on Blood Products - Market size and forecast (2023-2028) ($ million)
        • Data Table on Blood Products - Market size and forecast (2023-2028) ($ million)
        • Chart on Blood Products - Year-over-year growth (2023-2028) (%)
        • Data Table on Blood Products - Year-over-year growth (2023-2028) (%)
      • 10.4 Human Tissues - Market size and forecast (2023-2028)
        • Chart on Human Tissues - Market size and forecast (2023-2028) ($ million)
        • Data Table on Human Tissues - Market size and forecast (2023-2028) ($ million)
        • Chart on Human Tissues - Year-over-year growth (2023-2028) (%)
        • Data Table on Human Tissues - Year-over-year growth (2023-2028) (%)
      • 10.5 Cell Lines - Market size and forecast (2023-2028)
        • Chart on Cell Lines - Market size and forecast (2023-2028) ($ million)
        • Data Table on Cell Lines - Market size and forecast (2023-2028) ($ million)
        • Chart on Cell Lines - Year-over-year growth (2023-2028) (%)
        • Data Table on Cell Lines - Year-over-year growth (2023-2028) (%)
      • 10.6 Nucleic Acids - Market size and forecast (2023-2028)
        • Chart on Nucleic Acids - Market size and forecast (2023-2028) ($ million)
        • Data Table on Nucleic Acids - Market size and forecast (2023-2028) ($ million)
        • Chart on Nucleic Acids - Year-over-year growth (2023-2028) (%)
        • Data Table on Nucleic Acids - Year-over-year growth (2023-2028) (%)
      • 10.7 Biological Fluids - Market size and forecast (2023-2028)
        • Chart on Biological Fluids - Market size and forecast (2023-2028) ($ million)
        • Data Table on Biological Fluids - Market size and forecast (2023-2028) ($ million)
        • Chart on Biological Fluids - Year-over-year growth (2023-2028) (%)
        • Data Table on Biological Fluids - Year-over-year growth (2023-2028) (%)
      • 10.8 Human Waste Products - Market size and forecast (2023-2028)
        • Chart on Human Waste Products - Market size and forecast (2023-2028) ($ million)
        • Data Table on Human Waste Products - Market size and forecast (2023-2028) ($ million)
        • Chart on Human Waste Products - Year-over-year growth (2023-2028) (%)
        • Data Table on Human Waste Products - Year-over-year growth (2023-2028) (%)
      • 10.9 Market opportunity by Sample Type
        • Market opportunity by Sample Type ($ million)
        • Data Table on Market opportunity by Sample Type ($ million)

      11 Market Segmentation by Biobank Type

      • 11.1 Market segments
        • Chart on Biobank Type - Market share (2023-2028) (%)
        • Data Table on Biobank Type - Market share (2023-2028) (%)
      • 11.2 Comparison by Biobank Type
        • Chart on Comparison by Biobank Type
        • Data Table on Comparison by Biobank Type
      • 11.3 Population-Based Biobanks - Market size and forecast (2023-2028)
        • Chart on Population-Based Biobanks - Market size and forecast (2023-2028) ($ million)
        • Data Table on Population-Based Biobanks - Market size and forecast (2023-2028) ($ million)
        • Chart on Population-Based Biobanks - Year-over-year growth (2023-2028) (%)
        • Data Table on Population-Based Biobanks - Year-over-year growth (2023-2028) (%)
      • 11.4 Disease-Based Biobanks - Market size and forecast (2023-2028)
        • Chart on Disease-Based Biobanks - Market size and forecast (2023-2028) ($ million)
        • Data Table on Disease-Based Biobanks - Market size and forecast (2023-2028) ($ million)
        • Chart on Disease-Based Biobanks - Year-over-year growth (2023-2028) (%)
        • Data Table on Disease-Based Biobanks - Year-over-year growth (2023-2028) (%)
      • 11.5 Virtual Biobanks - Market size and forecast (2023-2028)
        • Chart on Virtual Biobanks - Market size and forecast (2023-2028) ($ million)
        • Data Table on Virtual Biobanks - Market size and forecast (2023-2028) ($ million)
        • Chart on Virtual Biobanks - Year-over-year growth (2023-2028) (%)
        • Data Table on Virtual Biobanks - Year-over-year growth (2023-2028) (%)
      • 11.6 Tissue Biobanks - Market size and forecast (2023-2028)
        • Chart on Tissue Biobanks - Market size and forecast (2023-2028) ($ million)
        • Data Table on Tissue Biobanks - Market size and forecast (2023-2028) ($ million)
        • Chart on Tissue Biobanks - Year-over-year growth (2023-2028) (%)
        • Data Table on Tissue Biobanks - Year-over-year growth (2023-2028) (%)
      • 11.7 Genetic Biobanks - Market size and forecast (2023-2028)
        • Chart on Genetic Biobanks - Market size and forecast (2023-2028) ($ million)
        • Data Table on Genetic Biobanks - Market size and forecast (2023-2028) ($ million)
        • Chart on Genetic Biobanks - Year-over-year growth (2023-2028) (%)
        • Data Table on Genetic Biobanks - Year-over-year growth (2023-2028) (%)
      • 11.8 Market opportunity by Biobank Type
        • Market opportunity by Biobank Type ($ million)
        • Data Table on Market opportunity by Biobank Type ($ million)

      12 Customer Landscape

      • 12.1 Customer landscape overview
        • Analysis of price sensitivity, lifecycle, customer purchase basket, adoption rates, and purchase criteria

      13 Geographic Landscape

      • 13.1 Geographic segmentation
        • Chart on Market share by geography 2023-2028 (%)
        • Data Table on Market share by geography 2023-2028 (%)
      • 13.2 Geographic comparison
        • Chart on Geographic comparison
        • Data Table on Geographic comparison
      • 13.3 Europe - Market size and forecast 2023-2028
        • Chart on Europe - Market size and forecast 2023-2028 ($ million)
        • Data Table on Europe - Market size and forecast 2023-2028 ($ million)
        • Chart on Europe - Year-over-year growth 2023-2028 (%)
        • Data Table on Europe - Year-over-year growth 2023-2028 (%)
      • 13.4 North America - Market size and forecast 2023-2028
        • Chart on North America - Market size and forecast 2023-2028 ($ million)
        • Data Table on North America - Market size and forecast 2023-2028 ($ million)
        • Chart on North America - Year-over-year growth 2023-2028 (%)
        • Data Table on North America - Year-over-year growth 2023-2028 (%)
      • 13.5 Asia - Market size and forecast 2023-2028
        • Chart on Asia - Market size and forecast 2023-2028 ($ million)
        • Data Table on Asia - Market size and forecast 2023-2028 ($ million)
        • Chart on Asia - Year-over-year growth 2023-2028 (%)
        • Data Table on Asia - Year-over-year growth 2023-2028 (%)
      • 13.6 Rest of World (ROW) - Market size and forecast 2023-2028
        • Chart on Rest of World (ROW) - Market size and forecast 2023-2028 ($ million)
        • Data Table on Rest of World (ROW) - Market size and forecast 2023-2028 ($ million)
        • Chart on Rest of World (ROW) - Year-over-year growth 2023-2028 (%)
        • Data Table on Rest of World (ROW) - Year-over-year growth 2023-2028 (%)
      • 13.7 US - Market size and forecast 2023-2028
        • Chart on US - Market size and forecast 2023-2028 ($ million)
        • Data Table on US - Market size and forecast 2023-2028 ($ million)
        • Chart on US - Year-over-year growth 2023-2028 (%)
        • Data Table on US - Year-over-year growth 2023-2028 (%)
      • 13.8 Germany - Market size and forecast 2023-2028
        • Chart on Germany - Market size and forecast 2023-2028 ($ million)
        • Data Table on Germany - Market size and forecast 2023-2028 ($ million)
        • Chart on Germany - Year-over-year growth 2023-2028 (%)
        • Data Table on Germany - Year-over-year growth 2023-2028 (%)
      • 13.9 Japan - Market size and forecast 2023-2028
        • Chart on Japan - Market size and forecast 2023-2028 ($ million)
        • Data Table on Japan - Market size and forecast 2023-2028 ($ million)
        • Chart on Japan - Year-over-year growth 2023-2028 (%)
        • Data Table on Japan - Year-over-year growth 2023-2028 (%)
      • 13.10 UK - Market size and forecast 2023-2028
        • Chart on UK - Market size and forecast 2023-2028 ($ million)
        • Data Table on UK - Market size and forecast 2023-2028 ($ million)
        • Chart on UK - Year-over-year growth 2023-2028 (%)
        • Data Table on UK - Year-over-year growth 2023-2028 (%)
      • 13.11 China - Market size and forecast 2023-2028
        • Chart on China - Market size and forecast 2023-2028 ($ million)
        • Data Table on China - Market size and forecast 2023-2028 ($ million)
        • Chart on China - Year-over-year growth 2023-2028 (%)
        • Data Table on China - Year-over-year growth 2023-2028 (%)
      • 13.12 Market opportunity by geography
        • Market opportunity by geography ($ million)
        • Data Tables on Market opportunity by geography ($ million)
      • 13.13 Canada - Market size and forecast (2023-2028)
        • Chart on Canada - Market size and forecast (2023-2028) ($ million)
        • Data Table on Canada - Market size and forecast (2023-2028) ($ million)
        • Chart on Canada - Year-over-year growth (2023-2028) (%)
        • Data Table on Canada - Year-over-year growth (2023-2028) (%)
      • 13.14 Italy - Market size and forecast (2023-2028)
        • Chart on Italy - Market size and forecast (2023-2028) ($ million)
        • Data Table on Italy - Market size and forecast (2023-2028) ($ million)
        • Chart on Italy - Year-over-year growth (2023-2028) (%)
        • Data Table on Italy - Year-over-year growth (2023-2028) (%)
      • 13.15 France - Market size and forecast (2023-2028)
        • Chart on France - Market size and forecast (2023-2028) ($ million)
        • Data Table on France - Market size and forecast (2023-2028) ($ million)
        • Chart on France - Year-over-year growth (2023-2028) (%)
        • Data Table on France - Year-over-year growth (2023-2028) (%)
      • 13.16 India - Market size and forecast (2023-2028)
        • Chart on India - Market size and forecast (2023-2028) ($ million)
        • Data Table on India - Market size and forecast (2023-2028) ($ million)
        • Chart on India - Year-over-year growth (2023-2028) (%)
        • Data Table on India - Year-over-year growth (2023-2028) (%)
      • 13.17 Brazil - Market size and forecast (2023-2028)
        • Chart on Brazil - Market size and forecast (2023-2028) ($ million)
        • Data Table on Brazil - Market size and forecast (2023-2028) ($ million)
        • Chart on Brazil - Year-over-year growth (2023-2028) (%)
        • Data Table on Brazil - Year-over-year growth (2023-2028) (%)
      • 13.18 Egypt - Market size and forecast (2023-2028)
        • Chart on Egypt - Market size and forecast (2023-2028) ($ million)
        • Data Table on Egypt - Market size and forecast (2023-2028) ($ million)
        • Chart on Egypt - Year-over-year growth (2023-2028) (%)
        • Data Table on Egypt - Year-over-year growth (2023-2028) (%)
      • 13.19 UAE - Market size and forecast (2023-2028)
        • Chart on UAE - Market size and forecast (2023-2028) ($ million)
        • Data Table on UAE - Market size and forecast (2023-2028) ($ million)
        • Chart on UAE - Year-over-year growth (2023-2028) (%)
        • Data Table on UAE - Year-over-year growth (2023-2028) (%)
      • 13.20 Oman - Market size and forecast (2023-2028)
        • Chart on Oman - Market size and forecast (2023-2028) ($ million)
        • Data Table on Oman - Market size and forecast (2023-2028) ($ million)
        • Chart on Oman - Year-over-year growth (2023-2028) (%)
        • Data Table on Oman - Year-over-year growth (2023-2028) (%)
      • 13.21 Argentina - Market size and forecast (2023-2028)
        • Chart on Argentina - Market size and forecast (2023-2028) ($ million)
        • Data Table on Argentina - Market size and forecast (2023-2028) ($ million)
        • Chart on Argentina - Year-over-year growth (2023-2028) (%)
        • Data Table on Argentina - Year-over-year growth (2023-2028) (%)
      • 13.22 KSA - Market size and forecast (2023-2028)
        • Chart on KSA - Market size and forecast (2023-2028) ($ million)
        • Data Table on KSA - Market size and forecast (2023-2028) ($ million)
        • Chart on KSA - Year-over-year growth (2023-2028) (%)
        • Data Table on KSA - Year-over-year growth (2023-2028) (%)

      14 Drivers, Challenges, and Opportunity/Restraints

      • 14.1 Market drivers
        • 14.2 Market challenges
          • 14.3 Impact of drivers and challenges
            • Impact of drivers and challenges in 2023 and 2028
          • 14.4 Market opportunities/restraints

            15 Competitive Landscape

            • 15.1 Overview
              • 15.2 Competitive Landscape
                • Overview on criticality of inputs and factors of differentiation
              • 15.3 Landscape disruption
                • Overview on factors of disruption
              • 15.4 Industry risks
                • Impact of key risks on business

              16 Competitive Analysis

              • 16.1 Companies profiled
                • Companies covered
              • 16.2 Market positioning of companies
                • Matrix on companies position and classification
              • 16.3 AMS Biotechnology Europe Ltd.
                • AMS Biotechnology Europe Ltd. - Overview
                • AMS Biotechnology Europe Ltd. - Product / Service
                • AMS Biotechnology Europe Ltd. - Key offerings
              • 16.4 ASKION GmbH
                • ASKION GmbH - Overview
                • ASKION GmbH - Product / Service
                • ASKION GmbH - Key offerings
              • 16.5 Azenta Inc.
                • Azenta Inc. - Overview
                • Azenta Inc. - Business segments
                • Azenta Inc. - Key news
                • Azenta Inc. - Key offerings
                • Azenta Inc. - Segment focus
              • 16.6 Bay Biosciences LLC
                • Bay Biosciences LLC - Overview
                • Bay Biosciences LLC - Product / Service
                • Bay Biosciences LLC - Key offerings
              • 16.7 BioIVT LLC
                • BioIVT LLC - Overview
                • BioIVT LLC - Product / Service
                • BioIVT LLC - Key news
                • BioIVT LLC - Key offerings
              • 16.8 Boca Biolistics LLC
                • Boca Biolistics LLC - Overview
                • Boca Biolistics LLC - Product / Service
                • Boca Biolistics LLC - Key offerings
              • 16.9 CTIBiotech
                • CTIBiotech - Overview
                • CTIBiotech - Product / Service
                • CTIBiotech - Key offerings
              • 16.10 Cureline Inc.
                • Cureline Inc. - Overview
                • Cureline Inc. - Product / Service
                • Cureline Inc. - Key offerings
              • 16.11 Danaher Corp.
                • Danaher Corp. - Overview
                • Danaher Corp. - Business segments
                • Danaher Corp. - Key news
                • Danaher Corp. - Key offerings
                • Danaher Corp. - Segment focus
              • 16.12 Firalis SA
                • Firalis SA - Overview
                • Firalis SA - Product / Service
                • Firalis SA - Key offerings
              • 16.13 GENETICIST Inc.
                • GENETICIST Inc. - Overview
                • GENETICIST Inc. - Product / Service
                • GENETICIST Inc. - Key offerings
              • 16.14 Hamilton Co.
                • Hamilton Co. - Overview
                • Hamilton Co. - Product / Service
                • Hamilton Co. - Key offerings
              • 16.15 ProteoGenex Inc.
                • ProteoGenex Inc. - Overview
                • ProteoGenex Inc. - Product / Service
                • ProteoGenex Inc. - Key offerings
              • 16.16 Thermo Fisher Scientific Inc.
                • Thermo Fisher Scientific Inc. - Overview
                • Thermo Fisher Scientific Inc. - Business segments
                • Thermo Fisher Scientific Inc. - Key news
                • Thermo Fisher Scientific Inc. - Key offerings
                • Thermo Fisher Scientific Inc. - Segment focus
              • 16.17 US Biolab Corp. Inc.
                • US Biolab Corp. Inc. - Overview
                • US Biolab Corp. Inc. - Product / Service
                • US Biolab Corp. Inc. - Key offerings

              17 Appendix

              • 17.1 Scope of the report
                • 17.2 Inclusions and exclusions checklist
                  • Inclusions checklist
                  • Exclusions checklist
                • 17.3 Currency conversion rates for US$
                  • Currency conversion rates for US$
                • 17.4 Research methodology
                  • Research methodology
                • 17.5 Data procurement
                  • Information sources
                • 17.6 Data validation
                  • Data validation
                • 17.7 Validation techniques employed for market sizing
                  • Validation techniques employed for market sizing
                • 17.8 Data synthesis
                  • Data synthesis
                • 17.9 360 degree market analysis
                  • 360 degree market analysis
                • 17.10 List of abbreviations
                  • List of abbreviations

                Research Methodology

                Technavio presents a detailed picture of the market by way of study, synthesis, and summation of data from multiple sources. The analysts have presented the various facets of the market with a particular focus on identifying the key industry influencers. The data thus presented is comprehensive, reliable, and the result of extensive research, both primary and secondary.

                INFORMATION SOURCES

                Primary sources

                • Manufacturers and suppliers
                • Channel partners
                • Industry experts
                • Strategic decision makers

                Secondary sources

                • Industry journals and periodicals
                • Government data
                • Financial reports of key industry players
                • Historical data
                • Press releases

                DATA ANALYSIS

                Data Synthesis

                • Collation of data
                • Estimation of key figures
                • Analysis of derived insights

                Data Validation

                • Triangulation with data models
                • Reference against proprietary databases
                • Corroboration with industry experts

                REPORT WRITING

                Qualitative

                • Market drivers
                • Market challenges
                • Market trends
                • Five forces analysis

                Quantitative

                • Market size and forecast
                • Market segmentation
                • Geographical insights
                • Competitive landscape

                Interested in this report?

                Get your sample now to see our research methodology and insights!

                Download Now

                Frequently Asked Questions

                Biobanking market growth will increase by $ 1669.1 mn during 2024-2028.

                The Biobanking market is expected to grow at a CAGR of 9.04% during 2024-2028.

                Biobanking market is segmented by Type( Physical, Virtual) Product( Equipment, Consumables, Asia, ROW)

                AMS Biotechnology Europe Ltd., ASKION GmbH, Azenta Inc., Bay Biosciences LLC, BioIVT LLC, Boca Biolistics LLC, CTIBiotech, Cureline Inc., Danaher Corp., Firalis SA, GENETICIST Inc., Greiner Bio One International GmbH, Hamilton Co., OraSure Technologies Inc., PHC Holdings Corp., Promega Corp., ProteoGenex Inc., Shanghai Genext Medical Technology Co. Ltd., Thermo Fisher Scientific Inc., US Biolab Corp. Inc. are a few of the key vendors in the Biobanking market.

                Europe will register the highest growth rate of 38% among the other regions. Therefore, the Biobanking market in Europe is expected to garner significant business opportunities for the vendors during the forecast period.

                US, Canada, Germany, UK, Italy, France, China, India, Japan, Brazil, Egypt, UAE, Oman, Argentina, KSA, UAE, Brazil, Rest of World (ROW)

                • Growing demand for personalized medicineThe high unmet medical need to develop effective therapies has driven the demand for personalized medicine is the driving factor this market.
                • which has driven the need for biobanks. This scenario could offer game-changing opportunities for the vendors. Personalized medicine means treatments based on individual characteristics is the driving factor this market.
                • needs is the driving factor this market.
                • and preferences. Individuals are increasingly banking their tissues and stem cells for future treatments if needed. A critical need for personalized medicine is the availability of individual samples with annotated clinical and pathological data on individuals. Research organizations are extensively exploring ways to develop personalized treatments with biological samples. Therefore is the driving factor this market.
                • the growing demand for personalized medicine will fuel the demand for biobanks worldwide. Such factors are expected to drive the growth of the global biobanking market during the forecast period. is the driving factor this market.

                The Biobanking market vendors should focus on grabbing business opportunities from the Physical segment as it accounted for the largest market share in the base year.
                RIA - Research AI Assistant
                Ask RIA