
Bleached Eucalyptus Kraft Pulp Market Size 2025-2029
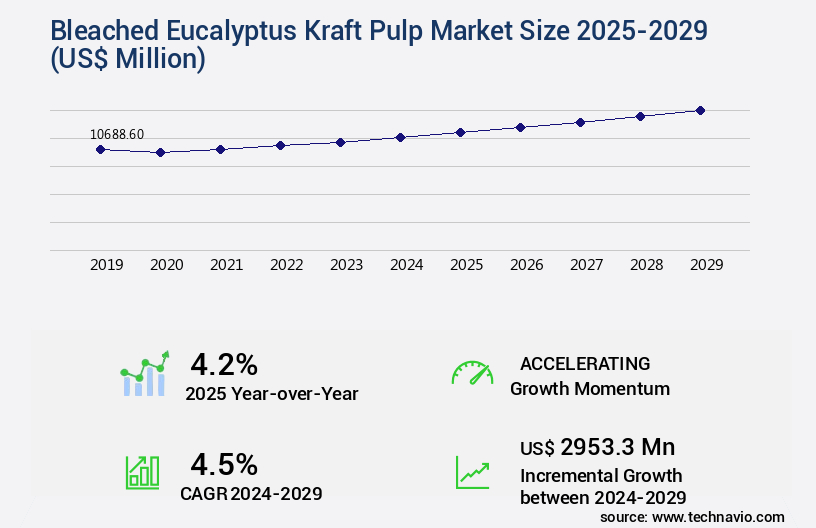
The bleached eucalyptus kraft pulp market size is valued to increase USD 2.95 billion, at a CAGR of 4.5% from 2024 to 2029. Rise in use of personal care and hygiene products will drive the bleached eucalyptus kraft pulp market.
Major Market Trends & Insights
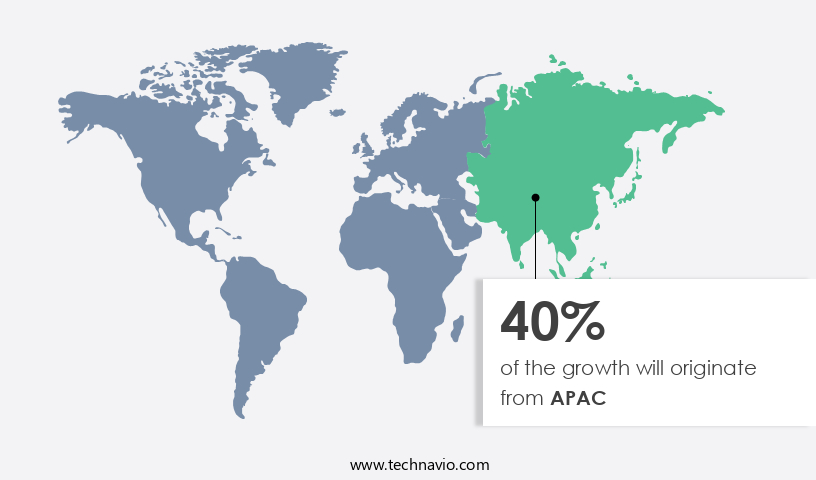
- APAC dominated the market and accounted for a 40% growth during the forecast period.
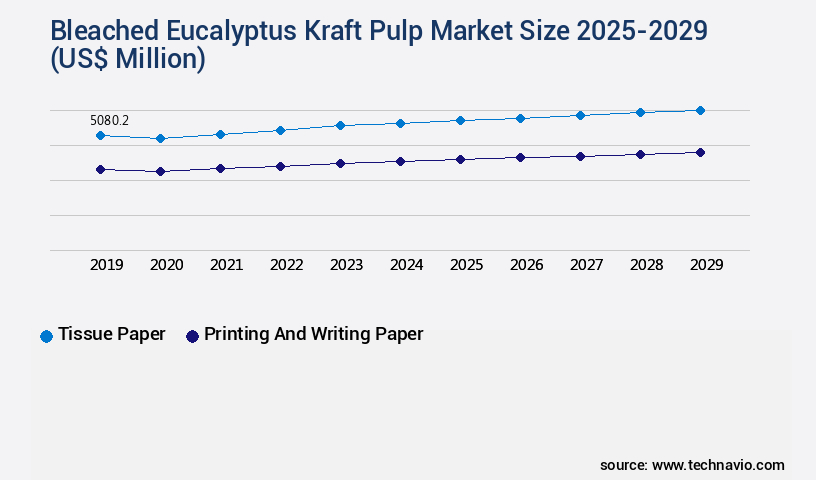
- By Application - Tissue paper segment was valued at USD 5.08 billion in 2023
- By Type - Regular grade segment accounted for the largest market revenue share in 2023
Market Size & Forecast
- Market Opportunities: USD 39.96 million
- Market Future Opportunities: USD 2953.30 million
- CAGR from 2024 to 2029 : 4.5%
Market Summary
- The market has experienced significant expansion in recent years, fueled by the increasing demand for sustainable and eco-friendly alternatives in various industries. Eucalyptus trees, known for their rapid growth and high yield, are a preferred choice for pulp production. According to industry reports, the global eucalyptus kraft pulp market was valued at over USD 3 billion in 2020. Forestry and plantation management play a crucial role in the market's growth. Sustainable forestry practices ensure a steady supply of raw materials while minimizing environmental impact. However, instances of forest fires pose a significant challenge, threatening the availability of raw materials and increasing production costs.
- The market's evolution is driven by the rising use of personal care and hygiene products, particularly in the Asia Pacific region. Eucalyptus kraft pulp is a popular choice due to its high brightness, strength, and biodegradability. Its versatility extends to various applications, including packaging, textiles, and paper production. Despite these opportunities, the market faces challenges such as fluctuating raw material prices and increasing competition from alternative pulp sources. To stay competitive, market players are investing in research and development to improve production efficiency and reduce environmental impact. The future direction of the market lies in continued innovation and sustainability.
What will be the Size of the Bleached Eucalyptus Kraft Pulp Market during the forecast period?
Get Key Insights on Market Forecast (PDF) Request Free Sample
How is the Bleached Eucalyptus Kraft Pulp Market Segmented ?
The bleached eucalyptus kraft pulp industry research report provides comprehensive data (region-wise segment analysis), with forecasts and estimates in "USD million" for the period 2025-2029, as well as historical data from 2019-2023 for the following segments.
- Application
- Tissue paper
- Printing and writing paper
- Others
- Type
- Regular grade
- High quality grade
- End-user
- Paper and pulp
- Packaging
- Textile
- Others
- Geography
- North America
- US
- Canada
- Europe
- France
- Germany
- Italy
- UK
- APAC
- China
- India
- Japan
- South Korea
- Rest of World (ROW)
- North America
By Application Insights
The tissue paper segment is estimated to witness significant growth during the forecast period.
The market is experiencing continuous evolution, particularly in the tissue paper segment, which saw the fastest growth rate in 2024. Eucalyptus fiber's unique properties, including softness when bleached, make it a preferred choice for manufacturing tissue papers, such as paper towels, hygienic tissue papers, wrapping tissues, wipes, facial tissues, custom-printed wrapping tissues, toilet tissues, and table napkins. This growth can be attributed to socio-economic factors, including rapid urbanization, increasing disposable income, and consumer expenditure. Eucalyptus kraft pulp production involves several processes, including sheet formation, fiber length distribution control, pulp consistency control, and digester operation parameter optimization.
Fiber morphology analysis, kraft pulp bleaching, and paper strength property assessments are crucial for ensuring high-quality pulp. Chemical oxygen demand (COD) and biological oxygen demand (BOD) measurements are essential for monitoring the environmental impact of the bleaching process. Enzyme-assisted bleaching, hydrogen peroxide bleaching, chlorine dioxide bleaching, and ozone bleaching technology are used to optimize lignin removal efficiency and reduce adsorbable organic halides and total organic carbon levels. Pulp viscosity testing, brightness stability, water retention value, and pulp brightness measurement are essential for maintaining optimal pulp properties. Efficient black liquor evaporation, opacity determination, chemical recovery system operation, drainage rate measurement, oxygen delignification process, and pulp freeness testing are all critical aspects of the pulp manufacturing process.
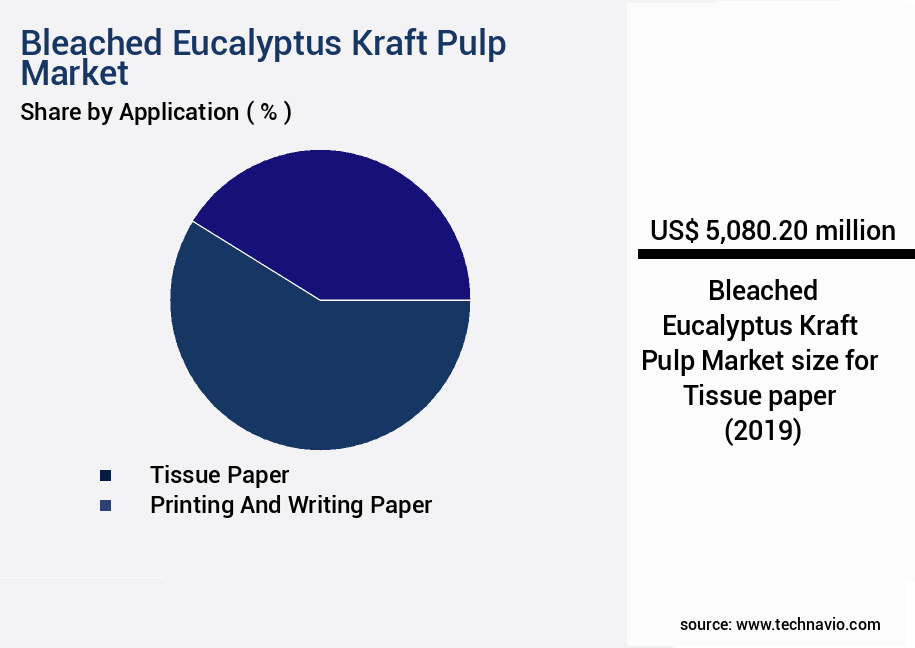
The Tissue paper segment was valued at USD 5.08 billion in 2019 and showed a gradual increase during the forecast period.
The kappa number reduction and eucalyptus fiber properties are vital indicators of pulp quality. Refining energy consumption and bleaching effluent treatment are essential for maintaining sustainable and eco-friendly production methods. Pulp drying efficiency is another crucial factor in the overall production process. The market is expected to continue growing, driven by the increasing demand for high-quality tissue papers.
Regional Analysis
APAC is estimated to contribute 40% to the growth of the global market during the forecast period. Technavio's analysts have elaborately explained the regional trends and drivers that shape the market during the forecast period.
See How Bleached Eucalyptus Kraft Pulp Market Demand is Rising in APAC Request Free Sample
The market in Asia Pacific (APAC) is experiencing significant expansion due to the region's high production and consumption of this pulp. Countries like Japan, China, Indonesia, Korea, and India are major contributors to the market's growth. In China, the increasing demand for bleached eucalyptus kraft pulp in manufacturing tissue papers and printing and writing papers is driving market growth. Furthermore, the year-over-year increase in per capita consumption of paper products in APAC countries is another factor fueling the market's expansion.
Additionally, the entry of foreign companies, such as Domtar Corp., into the region to capitalize on growth opportunities is bolstering the market. The APAC market is poised for continued growth due to these factors.
Market Dynamics
Our researchers analyzed the data with 2024 as the base year, along with the key drivers, trends, and challenges. A holistic analysis of drivers will help companies refine their marketing strategies to gain a competitive advantage.
The global eucalyptus kraft pulp market is witnessing significant growth due to the unique fiber characteristics of eucalyptus trees, which positively impact pulp quality. Eucalyptus fibers provide excellent strength and durability, making eucalyptus kraft pulp a preferred choice for various paper applications. One critical factor influencing pulp quality is the oxygen delignification process during pulping, which enhances pulp brightness. This process is essential for producing high-quality bleached eucalyptus kraft pulp, as brighter pulp contributes significantly to improved paper quality. Another crucial aspect is the optimization of chlorine dioxide bleaching and effluent treatment. Chlorine dioxide bleaching effectively removes lignin, resulting in a higher pulp yield.
However, it also generates significant effluent, necessitating proper treatment to meet environmental regulations. Pulp viscosity plays a vital role in determining paper strength. Improved refining energy consumption leads to higher pulp viscosity, resulting in stronger paper. This is a significant consideration for businesses seeking to produce high-performance paper products. Total organic carbon reduction is a critical environmental concern in bleached eucalyptus kraft pulp production. Adsorbable organic halides (AOX) are a significant contributor to organic carbon emissions. The adoption of enzyme-assisted bleaching techniques can help reduce AOX levels, making the process more environmentally friendly. Pulp brightness stability is essential for maintaining consistent paper quality.
Fiber morphology analysis can provide valuable insights into pulp properties, allowing manufacturers to optimize the sheet formation process and improve paper opacity. Drainage rate measurement is crucial for ensuring pulp quality. A faster drainage rate leads to better paper quality, as it reduces the amount of water absorbed in the paper, resulting in improved drying efficiency and cost savings. Water retention value (WRV) is a critical parameter for evaluating the performance of bleached eucalyptus kraft pulp. Higher WRV values indicate better water holding capacity, which can lead to improved paper strength and durability. Hydrogen peroxide bleaching is another popular method for producing high-quality bleached eucalyptus kraft pulp.
This process significantly enhances paper whiteness, making it an attractive option for businesses producing high-quality paper products. Ozone bleaching technology is gaining popularity due to its environmental benefits. It offers a more sustainable alternative to traditional chlorine-based bleaching methods, reducing the amount of hazardous chemicals used in the process. Chemical oxygen demand (COD) and biological oxygen demand (BOD) are essential parameters for monitoring the environmental impact of pulp production. Effective control of these parameters is crucial for maintaining regulatory compliance and minimizing environmental impact. White liquor preparation is a critical aspect of pulping efficiency. Optimizing white liquor preparation can lead to significant cost savings and improved pulping efficiency.
Black liquor evaporation energy optimization techniques are essential for minimizing energy consumption and reducing production costs. Energy-efficient black liquor evaporation can help businesses achieve significant cost savings while maintaining high-quality pulp production. Pulp drying efficiency is a critical factor in determining overall production costs. Higher pulp drying efficiency can lead to significant cost savings, making it an essential consideration for businesses seeking to optimize their production processes. Bleaching chemical dosage plays a crucial role in determining pulp properties. Optimal dosage levels can help businesses maintain consistent pulp quality while minimizing production costs.
In the Bleached Eucalyptus Kraft Pulp Market, optimizing pulp properties and production processes is essential for meeting quality standards and environmental regulations. One of the foundational elements in this optimization is understanding eucalyptus fiber characteristics impact on pulp quality. The short fibers of eucalyptus contribute to excellent formation and smoothness in paper, but their specific morphology plays a critical role in determining pulp strength and overall quality. A major stage in pulp production is delignification, where the oxygen delignification effect on pulp brightness becomes significant. By efficiently reducing lignin content prior to bleaching, this step enhances brightness while decreasing the need for harsh chemicals downstream. This links closely with chlorine dioxide bleaching and effluent treatment optimization, where precise control over chemical dosage can achieve desired brightness levels while minimizing environmental discharge and improving effluent treatability.
The physical performance of the pulp is closely tied to pulp viscosity correlation with paper strength, where maintaining an optimal viscosity ensures the fibers retain sufficient integrity to produce strong, durable paper. Alongside this, advancements in refining technologies are allowing improved refining energy consumption for higher pulp yield, reducing operational costs while maximizing fiber utilization. Environmental considerations are also central to pulp production. Strategies for total organic carbon reduction in bleached kraft pulp are helping mills meet stricter sustainability goals by lowering organic load in process streams. Additionally, controlling adsorbable organic halides and environmental regulations is critical to aligning with global standards, particularly in regions with stringent discharge limits.
Innovative approaches such as lignin removal efficiency using enzyme-assisted bleaching are gaining traction, offering a more selective and eco-friendly way to reduce lignin content without compromising fiber quality. These methods contribute to better pulp brightness stability and its influence on paper quality, which is vital for products where consistent appearance is required over time. Understanding fiber morphology analysis and its influence on paper properties provides insights into how changes in fiber structure impact strength, porosity, and surface characteristics of paper. Similarly, the sheet formation process and its effect on paper opacity plays a key role in the visual and functional qualities of the final product, especially for printing and packaging grades.
What are the key market drivers leading to the rise in the adoption of Bleached Eucalyptus Kraft Pulp Industry?
- The significant increase in the consumption of personal care and hygiene products serves as the primary market driver.
- The global hygiene and personal care market has experienced substantial growth due to increasing consumer awareness and focus on basic hygiene. The market is a key contributor to this sector, primarily driven by the production of diapers, feminine hygiene pads, and adult incontinence products. The use of eucalyptus kraft pulp in these products offers benefits such as superior absorbency and softness. Feminine hygiene pads represent a significant market segment, with increasing demand attributed to their widespread use in both developed and developing markets.
- In developing countries, the adoption of a globalized consumer culture has led to an increase in the use of hygiene pads, even during non-menstrual flow days. This trend is particularly noticeable in countries with growing economies and expanding populations. As a result, the demand for eucalyptus kraft pulp in the production of feminine hygiene products is expected to remain strong during the forecast period.
What are the market trends shaping the Bleached Eucalyptus Kraft Pulp Industry?
- Focusing on forestry and plantation management is currently a significant trend in the market. A professional approach to this field is essential for success.
- In the market, companies like Suzano and UPM are leading the charge towards sustainable business models. Integrated companies are managing their forest and plantation resources in a responsible manner, ensuring social and environmental sustainability. This approach not only aligns with evolving market expectations but also facilitates cost-effective production. For instance, UPM Kymmene's investment in plantations supports low-cost production and self-sufficiency.
- Companies are increasingly focusing on community development, with UPM Kymmene being a prime example. By investing in local plantations, these companies contribute to the local economy while ensuring a steady supply of raw materials. The emphasis on sustainable forest and plantation management and community development underscores the continuous evolution of the market.
What challenges does the Bleached Eucalyptus Kraft Pulp Industry face during its growth?
- Forest fires pose a significant challenge to the industry's growth, as instances of these natural disasters can cause extensive damage to infrastructure and disrupt operations in the affected areas.
- Bleached eucalyptus kraft pulp is a mature industry that derives raw materials from trees, with branches accounting for 25% and trunk wood or logs comprising 75%. A log contains approximately 27% lignin, serving as the glue, and 73% fiber for paper production. Each tree consumes 130 gallons of water for growth and an additional 50 gallons during processing. On average, 17 trees are necessary to manufacture one metric ton of paper. White office paper production necessitates around 24 trees, while newsprint requires roughly 12 trees, alongside 25 metric cubes of water, 10,061 kWh of electricity, and 680 gallons of oil.
- This industry's continuous evolution is reflected in its resource consumption and applications across various sectors, making it a significant contributor to the global economy.
Exclusive Technavio Analysis on Customer Landscape
The bleached eucalyptus kraft pulp market forecasting report includes the adoption lifecycle of the market, covering from the innovator's stage to the laggard's stage. It focuses on adoption rates in different regions based on penetration. Furthermore, the bleached eucalyptus kraft pulp market report also includes key purchase criteria and drivers of price sensitivity to help companies evaluate and develop their market growth analysis strategies.

Customer Landscape of Bleached Eucalyptus Kraft Pulp Industry
Competitive Landscape
Companies are implementing various strategies, such as strategic alliances, bleached eucalyptus kraft pulp market forecast, partnerships, mergers and acquisitions, geographical expansion, and product/service launches, to enhance their presence in the industry.
ALTRI SGPS S.A. - The company specializes in producing high-quality bleached eucalyptus kraft pulp, such as Celbi BEKP, recognized for its superior brightness.
The industry research and growth report includes detailed analyses of the competitive landscape of the market and information about key companies, including:
- ALTRI SGPS S.A.
- Andritz AG
- Asia Pulp and Paper APP Sinar Mas
- Billerud AB
- Domtar Corp.
- Eldorado Brasil Celulose SA
- Empresas CMPC S.A.
- Empresas Copec S.A
- ENCE Energia y Celulosa SA
- International Paper Co.
- Mercer International Inc.
- METSA GROUP
- Mondi Plc
- Oji Holdings Corp.
- Semapa
- Smurfit Kappa Group
- Stora Enso Oyj
- Suzano SA
- UPM Kymmene Corp.
Qualitative and quantitative analysis of companies has been conducted to help clients understand the wider business environment as well as the strengths and weaknesses of key industry players. Data is qualitatively analyzed to categorize companies as pure play, category-focused, industry-focused, and diversified; it is quantitatively analyzed to categorize companies as dominant, leading, strong, tentative, and weak.
Recent Development and News in Bleached Eucalyptus Kraft Pulp Market
- In January 2024, Arauco, a leading global forest products company, announced the launch of its new eucalyptus kraft pulp mill in Chile, expanding its production capacity by 500,000 tons per year (TPY) (Arauco press release, 2024). This strategic investment reinforces Arauco's commitment to the eucalyptus kraft pulp market.
- In March 2024, Smurfit Kappa, a major European packaging company, entered into a long-term partnership with Veracel, the world's largest producer of eucalyptus pulp, to secure a reliable supply of eucalyptus kraft pulp for its packaging solutions (Smurfit Kappa press release, 2024). This collaboration aims to reduce Smurfit Kappa's carbon footprint by utilizing eucalyptus, a fast-growing and renewable raw material.
- In May 2024, the European Union (EU) approved the use of bleached eucalyptus kraft pulp in food contact applications, marking a significant regulatory milestone for the industry (European Commission press release, 2024). This approval opens new opportunities for eucalyptus kraft pulp producers and consumers in the EU market.
- In April 2025, Prabhat, a leading Indian pulp and paper manufacturer, completed the acquisition of a eucalyptus kraft pulp mill in Brazil, adding 350,000 TPY to its production capacity (Prabhat press release, 2025). This acquisition strengthens Prabhat's position in the global eucalyptus kraft pulp market and provides a strategic foothold in South America.
Dive into Technavio's robust research methodology, blending expert interviews, extensive data synthesis, and validated models for unparalleled Bleached Eucalyptus Kraft Pulp Market insights. See full methodology.
|
Market Scope |
|
|
Report Coverage |
Details |
|
Page number |
224 |
|
Base year |
2024 |
|
Historic period |
2019-2023 |
|
Forecast period |
2025-2029 |
|
Growth momentum & CAGR |
Accelerate at a CAGR of 4.5% |
|
Market growth 2025-2029 |
USD 2953.3 million |
|
Market structure |
Fragmented |
|
YoY growth 2024-2025(%) |
4.2 |
|
Key countries |
US, China, Germany, Canada, Japan, India, France, South Korea, UK, and Italy |
|
Competitive landscape |
Leading Companies, Market Positioning of Companies, Competitive Strategies, and Industry Risks |
Research Analyst Overview
- In the dynamic and ever-evolving world of pulp and paper production, the market stands out for its significant role in delivering high-quality products. Eucalyptus trees, with their unique fiber properties, have become a preferred choice for kraft pulp production due to their superior strength and brightness. The sheet formation process in eucalyptus kraft pulp production is aided by fiber length distribution and pulp consistency control. Digester operation parameters are meticulously managed to optimize fiber morphology analysis, ensuring the production of pulp with desirable paper strength properties. Chemical oxygen demand (COD) and total organic carbon (TOC) are essential metrics in the eucalyptus kraft pulp market.
- The efficiency of lignin removal during the oxygen delignification process plays a crucial role in reducing adsorbable organic halides (AOX) and maintaining brightness stability. Bleaching processes, such as hydrogen peroxide and chlorine dioxide bleaching, are integral to achieving the desired pulp brightness. Pulp viscosity testing and kappa number reduction are critical quality indicators, while energy consumption in refining and bleaching processes continues to be a focus for optimization. Bleaching effluent treatment and pulp drying efficiency are essential aspects of eucalyptus kraft pulp production. The market's continuous evolution is driven by advancements in technology, including enzyme-assisted bleaching and ozone bleaching technology.
- The eucalyptus fiber's unique properties, such as its high brightness and strength, contribute to the market's growth. The industry's focus on improving production efficiency, reducing environmental impact, and enhancing product quality further fuels the eucalyptus kraft pulp market's evolution. For instance, the European pulp and paper industry's eucalyptus kraft pulp production increased by 2.5% in 2020 compared to the previous year, accounting for approximately 35% of the total kraft pulp production in Europe. This data underscores the market's significance and its potential for continued growth.
What are the Key Data Covered in this Bleached Eucalyptus Kraft Pulp Market Research and Growth Report?
-
What is the expected growth of the Bleached Eucalyptus Kraft Pulp Market between 2025 and 2029?
-
USD 2.95 billion, at a CAGR of 4.5%
-
-
What segmentation does the market report cover?
-
The report is segmented by Application (Tissue paper, Printing and writing paper, and Others), Type (Regular grade and High quality grade), End-user (Paper and pulp, Packaging, Textile, and Others), and Geography (APAC, Europe, North America, South America, and Middle East and Africa)
-
-
Which regions are analyzed in the report?
-
APAC, Europe, North America, South America, and Middle East and Africa
-
-
What are the key growth drivers and market challenges?
-
Rise in use of personal care and hygiene products, Instances of forest fires
-
-
Who are the major players in the Bleached Eucalyptus Kraft Pulp Market?
-
ALTRI SGPS S.A., Andritz AG, Asia Pulp and Paper APP Sinar Mas, Billerud AB, Domtar Corp., Eldorado Brasil Celulose SA, Empresas CMPC S.A., Empresas Copec S.A, ENCE Energia y Celulosa SA, International Paper Co., Mercer International Inc., METSA GROUP, Mondi Plc, Oji Holdings Corp., Semapa, Smurfit Kappa Group, Stora Enso Oyj, Suzano SA, and UPM Kymmene Corp.
-
Market Research Insights
- The market is a significant sector in the global pulp and paper industry, characterized by continuous innovation and evolution. Two key performance indicators illustrate its current state and future potential. First, chemical recovery efficiency has seen notable advancements, with some mills achieving up to 98% recovery, reducing waste and lowering production costs. Second, environmental impact assessments have become increasingly stringent, with effluent discharge limits becoming more restrictive. This has led to a focus on energy efficiency improvement through process optimization strategies and the adoption of wood pulping technology. Fiber furnish optimization, pulp quality control, and paper properties testing are essential aspects of this market.
- Fiber bonding mechanism and pulp strength development are critical to ensuring optimal paper production. Process automation technologies, such as process monitoring systems and data analytics applications, enable real-time production line control and yield improvement strategies. Bleaching sequence design, degree of polymerization, and bleaching chemical dosage are crucial factors in achieving the desired paper quality. Sustainability practices, including wastewater management and screen rejects analysis, are essential for maintaining market competitiveness and meeting regulatory requirements. Paper coating techniques and fiber swelling properties further enhance paper quality, while quality assurance methods ensure consistent production. In summary, the market is driven by ongoing advancements in technology, sustainability, and production efficiency, with mills continually seeking to optimize processes, reduce costs, and meet evolving regulatory requirements.
We can help! Our analysts can customize this bleached eucalyptus kraft pulp market research report to meet your requirements.
 RIA -
RIA - 
