
Blood Viscometer Market Size 2024-2028
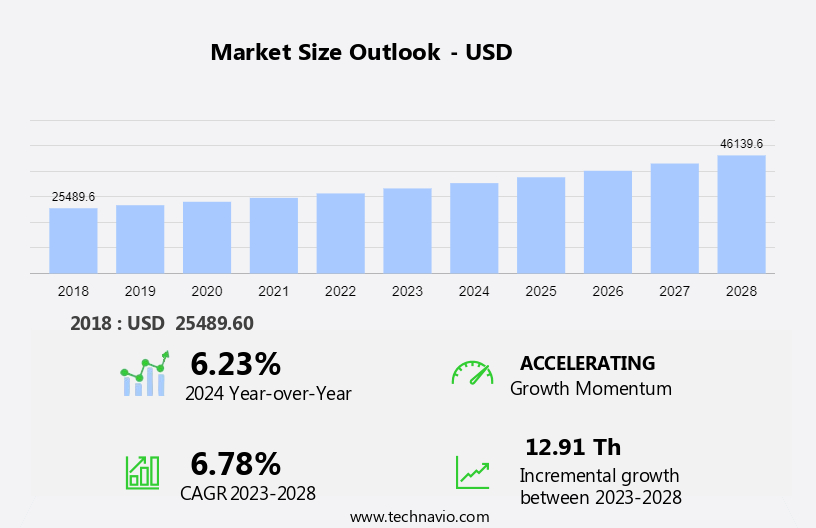
The Blood Viscometer Market size is forecast to increase by USD 12.91 thousand, at a CAGR of 6.78% between 2023 and 2028. The market is experiencing significant growth due to the rising prevalence of vascular diseases and the increasing demand for accurate and timely diagnosis. Technological advances, such as the development of portable and wireless viscometers, are driving innovation in the market. However, the high cost of blood viscometers remains a challenge for some healthcare providers and patients. Despite this, the market is expected to continue growing, fueled by the need for early and accurate diagnosis of blood disorders and vascular diseases. The increasing adoption of point-of-care testing and the integration of viscometers into diagnostic workflows are also contributing to market growth. Overall, the market is poised for continued expansion, driven by technological innovation and the growing demand for accurate and timely diagnostic tools.
What will be the Size of the Market During the Forecast Period?
To learn more about this report, View Report Sample
Market Dynamics and Customer Landscape
The market is a significant segment of the Medical Devices industry, focusing on viscosity measurement for various healthcare applications. It encompasses various types of viscometers, including Rotational Viscometers and Capillary Viscometers, which are essential for measuring the thickness of blood in settings such as Hospitals and clinical laboratory. Sensors play a crucial role in these devices, enhancing accuracy and reliability. The market also incorporates advanced software for data analysis and real-time monitoring. It caters to the needs of healthcare institutions for patient monitoring and early disease detection, particularly in Cardiovascular Diseases. Key players in the market include Thermo Fisher Scientific, Anton Paar, RheoSense, and BioFluid Technologies. The growth is driven by the increasing elderly population, automation, user-friendliness, and point-of-care diagnostics. However, challenges such as budget constraints, lack of awareness, and the need for repair services impact market dynamics. The market is segmented regionally, with North America, Europe, Asia Pacific, and the Middle East & Africa being major regions. The demand for portable devices providing quick results in patient monitoring is expected to drive growth, with companies emphasizing the development of advanced, cost-effective blood viscometers to meet evolving healthcare needs.
Key Market Driver
Increasing vascular diseases is notably driving the market growth. Blood viscometers are essential medical devices used to measure the viscosity of blood, offering vital insights into the risk of cardiovascular diseases. The viscosity of blood is crucial in determining blood flow conditions within the vasculature, allowing for the assessment of potential vascular symptoms. The market is poised for growth due to the increasing prevalence of cardiovascular diseases. This trend is expected to boost the demand for blood viscometers in various healthcare applications, including hospitals, laboratories, and clinics, within the regional framework. Manufacturers of blood viscometers, such as Thermo Fisher Scientific, Anton Paar, RheoSense, BioFluid Technologies, Health Onvector, Lamy Rheology, Benson Viscometers, HRD Antwerp, Beijing Steellex, and others, are focusing on developing user-friendly and automated blood viscometers for point-of-care diagnostics. These advancements aim to facilitate early disease detection and patient monitoring, catering to the needs of an aging population and budget constraints. Portable and quick-result blood viscometers from companies like BioFluid Technology are gaining popularity due to their convenience and ease of use. Despite these advancements, the lack of awareness regarding the importance of blood viscosity measurement and the high cost of some blood viscometers may hinder market growth.
Nevertheless, the increasing focus on automation, user-friendliness, and the potential for point-of-care diagnostics are expected to drive the market during the forecast period. Historical data and competition analysis indicate that the market for blood viscometers is highly competitive, with key players focusing on product innovation and expansion to maintain their market position. The market for blood viscometers is expected to grow significantly due to the increasing demand for medical instruments that provide accurate and reliable measurements of blood fluidity, thickness, and diagnosing disorders. Thus, such factors are driving the growth of the market during the forecast period.
Significant Market Trend
Technological advances is the key trend in the market. The market encompasses a range of medical devices designed for viscosity measurement in healthcare applications, particularly for diagnosing and monitoring cardiovascular diseases. Vendors in this sector are dedicated to research and innovation, producing advanced viscometers such as rotational viscometers and capillary viscometers from companies like Anton Paar, RheoSense, BioFluid Technologies, Health Onvector, Lamy Rheology, and HRD Antwerp. These instruments provide accurate measurements of the fluidity and thickness of blood and diagnose disorders.
For instance, Thermo Fisher Scientific offers the Haematology QS-100 Automated Blood Analyzer, which includes a viscometer for blood viscosity measurement. This device is user-friendly and suitable for hospitals, laboratories, and clinics. Portable viscometers from companies like Beijing Steellex and viscometer manufacturers Benson Viscometers Ltd. and RheoSense cater to budget constraints and the need for quick results in point-of-care diagnostics. Competition analysis reveals that vendors focus on automation, user-friendliness, and early disease detection to meet the growing demand for medical instruments. Historical data shows that an aging population and a lack of awareness about the importance of blood viscosity measurement drive market growth. Thus, such trends will shape the growth of the market during the forecast period.
Major Market Challenge
The high cost of blood viscometers is the major challenge that affects the growth of the market. The market is projected to expand substantially over the coming years due to the increasing demand for viscosity measurement in healthcare applications, particularly in the diagnosis and monitoring of cardiovascular diseases. Rheometers, capillary viscometers, rotational viscometers, and falling ball viscometers are among the popular types of blood viscometers used in hospitals, laboratories, and clinics for measuring the fluidity, thickness of blood, and diagnosing disorders. Companies such as Thermo Fisher Scientific, Anton Paar, RheoSense, BioFluid Technologies, Health Onvector, Lamy Rheology, Benson Viscometers, HRD Antwerp, Beijing Steellex, and others dominate the market. Despite the potential growth opportunities, the high cost of blood viscometers and the complex procedure involved in their operation may pose challenges to market expansion, especially in developing and emerging economies. The cost of a blood viscometer ranges between USD2,500 and USD3,500, which can be a significant investment for small hospitals and private clinics with budget constraints.
Moreover, the increasing cost of technological advancements in blood viscometers may further impede market growth. However, the trend towards automation, user-friendliness, and point-of-care diagnostics is expected to drive the demand for portable and quick-result blood viscometers. The aging population and the need for early disease detection are also expected to fuel market growth. Competition analysis indicates that vendors are focusing on offering extended warranties, free installation, and operational qualification documentation to attract customers. Hence, the above factors will impede the growth of the market during the forecast period
Key Market Customer Landscape
The report includes the adoption lifecycle of the market, covering from the innovator's stage to the laggard's stage. It focuses on adoption rates in different regions based on penetration. Furthermore, the report also includes key purchase criteria and drivers of price sensitivity to help companies evaluate and develop their expansion strategies.
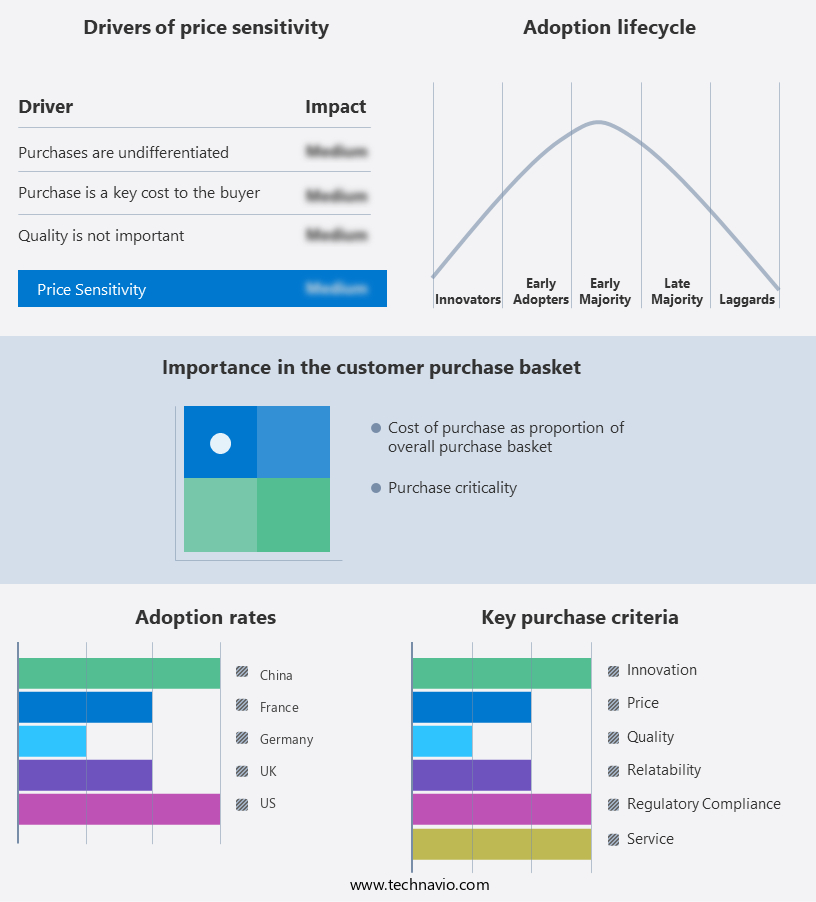
Market Customer Landscape
Who are the Major Market Players?
companies are implementing various strategies, such as strategic alliances, partnerships, mergers and acquisitions, geographical expansion, and product/service launches, to enhance their presence in the market.
Anton Paar GmbH - The company offers blood viscometers such as Lovis 2000 ME and DMA 4500 M.
The report also includes detailed analyses of the competitive landscape of the market and information about 15 market companies, including:
- A and D Co. Ltd.
- AMETEK Inc.
- Analytical Technology and Control Ltd.
- ATAGO Co. Ltd.
- Benson Viscometers Ltd.
- BioFluid Technology Inc.
- Cambridge Viscosity Inc.
- Cannon Instrument Co.
- China BeiJing Steellex Scientific Instrument Co.
- Fann Instrument Co.
- KYOTO ELECTRONICS MANUFACTURING CO. LTD.
- Labtron Equipment Ltd.
- LAUDA Scientific GmbH
- PCE Holding GmbH
Qualitative and quantitative market research and growth analysis of companies has been conducted to help clients understand the wider business environment as well as the strengths and weaknesses of key market players. In market growth analysis, data is qualitatively analyzed to categorize companies as pure play, category-focused, industry-focused, and diversified; it is quantitatively analyzed to categorize companies as dominant, leading, strong, tentative, and weak.
What are the Fastest-Growing Segments in the Market?
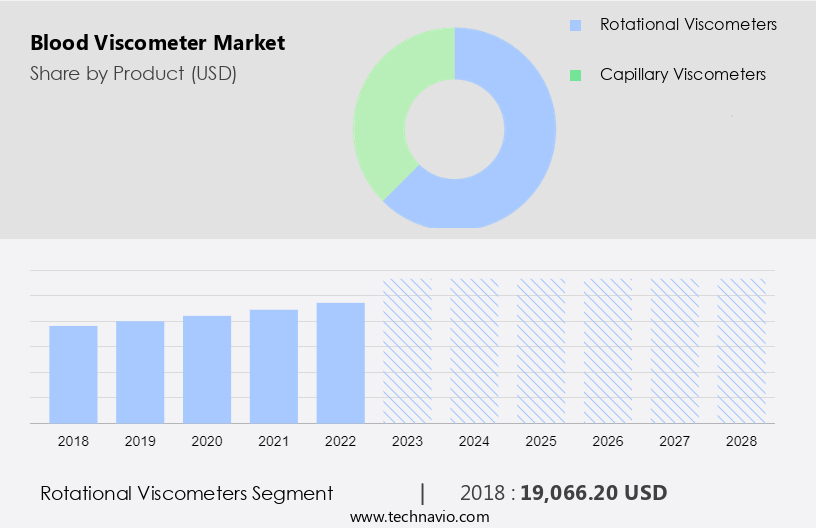
The market share growth by the rotational viscometers segment will be significant during the forecast period. Rotational segment measure viscosity by analyzing the torque required to rotate a spindle immersed in a fluid at a constant speed. The price of a rotational segment depends on motor composition and the instrument's technical characteristics.
Get a glance at the market contribution of various segments View the PDF Sample
The rotational viscometers segment was valued at USD 19,066.20 in 2018. There are two different types of rotational segment, namely, spring and springless. Consumers can purchase rotational segment with upgrades at higher prices or ones without upgrades at lower prices. Thus, customers have the flexibility to opt for a suitable rotational segment according to their needs. These factors will drive the expansion of this segment during the forecast period.
Key Regional Analysis
For more insights on the market share of various regions Download PDF Sample now!
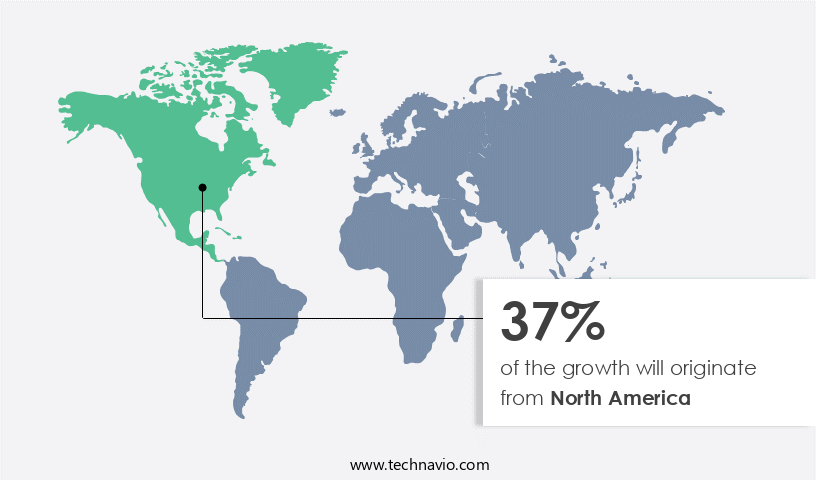
North America is estimated to contribute 37% to the growth of the global market during the forecast period. Technavio's analysts have elaborately explained the regional market trends and analysis and drivers that shape the market during the forecast period. The US and Canada are the key revenue-contributing countries in the regional market. The presence of major companies and the rising demand for testing blood viscosity are driving the expansion of the market in North America. Major companies such as BioFluid Technology Inc., RheoSense Inc., and Thermo Fisher Scientific Inc. offer innovative product. For example, RheoSense Inc. provides this product based on VROC technology, which measures dynamic viscosity across various applications. The adoption of this product in healthcare facilities is expected to increase, which, in turn, will drive the expansion of the regional market during the forecast period.
Segment Overview
The market research report provides comprehensive data (region-wise segment analysis), with forecasts and estimates in "USD Billion" for the period 2024 to 2028, as well as historical data from 2018 to 2022 for the following segments.
- Product Outlook
- Rotational viscometers
- Capillary viscometers
- End-user Outlook
- Hospitals
- Diagnostics
- Others
- Region Outlook
- North America
- The U.S.
- Canada
- Europe
- The U.K.
- Germany
- France
- Rest of Europe
- Asia
- China
- India
- ROW
- Australia
- Argentina
- Rest of the world
- North America
Market Analyst Overview
The market refers to the industry dedicated to manufacturing and supplying medical devices used for measuring the viscosity of blood. These devices are essential for various healthcare applications, including diagnostics and patient monitoring, particularly in the context of cardiovascular diseases. Two primary types of blood viscometers are available: Rotational viscometers and Capillary viscometers. Rotational viscometers measure the viscosity by applying controlled shear stress to a sample, while Capillary viscometers determine viscosity based on the time it takes for a fluid to flow through a capillary tube. Key players in the market include Thermo Fisher Scientific, Anton Paar, RheoSense, BioFluid Technologies, Health Onvector, Lamy Rheology, Benson Viscometers, HRD Antwerp, and others. These companies offer a range of viscometers, including falling ball viscometers, to cater to different customer needs. The market is driven by factors such as the increasing elderly population, automation, user-friendliness, and the demand for point of care diagnostics and early disease detection.
However, budget constraints and a lack of awareness about the importance of blood viscosity measurement can hinder market growth. Competition analysis reveals that companies are focusing on developing portable devices and providing quick results to cater to the evolving market requirements. Key players are also investing in research and development to improve the accuracy and reliability of their blood viscometers. Historical data indicates steady growth in the market, with regional frameworks playing a crucial role in shaping market trends. In addition to established players, new entrants such as Beijing Steellex are also making their mark in the industry. In summary, the market is a growing and competitive industry, driven by the need for accurate and reliable blood viscosity measurement for various healthcare applications. Key players are focusing on innovation and meeting customer demands to maintain their market position.
|
Market Scope |
|
|
Report Coverage |
Details |
|
Page number |
159 |
|
Base year |
2023 |
|
Historic period |
2018 - 2022 |
|
Forecast period |
2024-2028 |
|
Growth momentum & CAGR |
Accelerate at a CAGR of 6.78% |
|
Market Growth 2024-2028 |
USD 12.91 Th |
|
Market structure |
Fragmented |
|
YoY growth 2023-2024(%) |
6.23 |
|
Regional analysis |
North America, Europe, Asia, and Rest of World (ROW) |
|
Performing market contribution |
North America at 37% |
|
Key countries |
US, Germany, UK, China, and France |
|
Competitive landscape |
Leading Companies, Market Positioning of Companies, Competitive Strategies, and Industry Risks |
|
Key companies profiled |
A and D HOLON Holdings Co. Ltd., AMETEK Inc., Analytical Technology and Control Ltd., Anton Paar GmbH, ATAGO Co. Ltd., Benson Viscometers Ltd., BioFluid Technology Inc., Cambridge Viscosity Inc., Cannon Instrument Co., China BeiJing Steellex Scientific Instrument Co., Fann Instrument Co., Health Onvector, KYOTO ELECTRONICS MANUFACTURING CO. LTD., Labtron Equipment Ltd., Lamy Rheology, LAUDA Scientific GmbH, PCE Holding GmbH, Rheonics GmbH, RheoSense Inc., and Thermo Fisher Scientific Inc. |
|
Market dynamics |
Parent market growth analysis, Market Forecasting, Market growth inducers and obstacles, Fast-growing and slow-growing segment analysis, COVID-19 impact and recovery analysis and future consumer dynamics, and Market condition analysis for the market forecast period. |
|
Customization purview |
If our market report has not included the data that you are looking for, you can reach out to our analysts and get segments customized. |
What are the Key Data Covered in this Market Report?
- CAGR of the market during the forecast period
- Detailed information on factors that will drive the expansion of the market between 2024 and 2028
- Precise estimation of the market and its contribution to the parent market
- Accurate predictions about upcoming market growth and trends and changes in consumer behavior
- Expansion of the market across North America, Europe, Asia, and Rest of World (ROW)
- Thorough market growth and forecasting analysis of the market's competitive landscape and detailed information about companies
- Comprehensive market analysis and report of factors that will challenge the expansion of market companies
We can help! Our analysts can customize this market research report to meet your requirements.
 RIA -
RIA - 
