
Vascular Embolization Devices Market Size 2024-2028
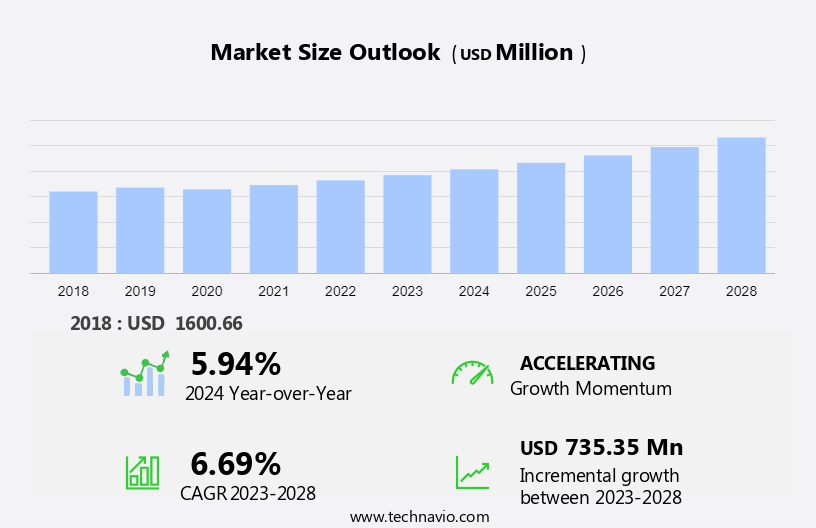
The vascular embolization devices market size is forecast to increase by USD 735.35 million at a CAGR of 6.69% between 2023 and 2028. Vascular embolization techniques have gained significant traction in the medical field due to their effectiveness in managing various conditions, including severe hemoptysis (SH) and ischemic heart diseases such as coronary and rheumatic heart diseases. The market for embolization products is witnessing notable growth, driven by the increasing prevalence of cardiovascular diseases and the rising number of minimally invasive procedures. Technological advancements in embolization devices have led to improved accuracy, safety, and efficiency, making them an attractive alternative to traditional surgical interventions. However, the high costs associated with these procedures remain a significant challenge, limiting their widespread adoption. The market analysis also highlights the impact of automobile accidents on the demand for embolization devices due to the high incidence of vascular injuries. In conclusion, the market is poised for steady growth, fueled by the increasing burden of vascular diseases and the ongoing technological innovations in embolization techniques.
What will be the Size of the Market During the Forecast Period?
The market is witnessing significant growth due to the increasing prevalence of vascular diseases and the need for effective therapeutic interventions. These devices play a crucial role in managing various conditions, including unruptured and ruptured brain aneurysms, severe hemoptysis (SH), vascular diseases in oncology, neurology, urology, and gastrointestinal diseases. Vascular embolization techniques have emerged as a preferred choice for treating several conditions due to their minimally invasive nature and ability to control bleeding. The progression of diseases such as brain aneurysms, liver cancer, and hepatocellular carcinoma necessitates timely interventions to prevent complications and improve patient outcomes.
Moreover, the Brain Aneurysm Foundation reports that an estimated 6 million people in the US live with an unruptured brain aneurysm, while ruptured brain aneurysms affect approximately 30,000 individuals annually. These conditions can lead to life-threatening complications, including hemorrhage and stroke. Vascular embolization devices offer a promising solution by enabling precise delivery of embolic agents to occlude the affected area, thereby reducing the risk of bleeding and promoting healing. Hospitals and healthcare services have increasingly adopted vascular embolization procedures due to their numerous advantages, including reduced hospital stays, lower morbidity rates, and improved patient satisfaction. The use of these devices in managing vascular diseases is expected to continue growing as technological advancements lead to the development of more effective and efficient embolization products.
In oncology, vascular embolization techniques are employed to cut off the blood supply to tumors, making it an essential component of cancer treatment. Neurology and urology also benefit significantly from these interventions, with embolization procedures used to treat various conditions such as arteriovenous malformations, uterine fibroids, and kidney tumors. Gastrointestinal diseases, including those affecting the liver, also contribute to the market's growth. Liver cancer, particularly hepatocellular carcinoma, is a significant health concern worldwide. Vascular embolization devices are used to deliver embolic agents to the tumor, thereby reducing blood flow and promoting tumor necrosis. The market is driven by the increasing prevalence of vascular diseases, the growing demand for minimally invasive procedures, and the ongoing technological advancements in embolization techniques and embolic agents. As research and development efforts continue, we can expect to see further innovations in this field, ensuring that patients receive the best possible care for their vascular conditions.
Market Segmentation
The market research report provides comprehensive data (region-wise segment analysis), with forecasts and estimates in "USD million" for the period 2024-2028, as well as historical data from 2018-2022 for the following segments.
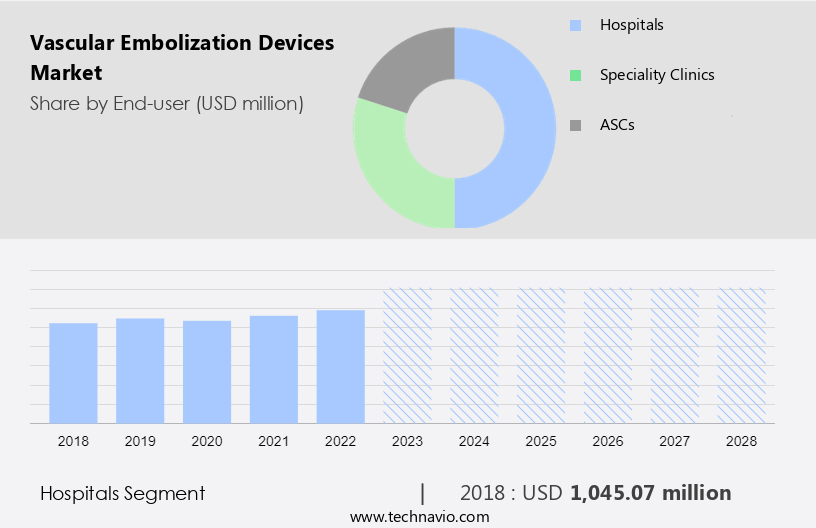
- End-user
- Hospitals
- Speciality clinics
- ASCs
- Product
- Coiling devices
- Non-coiling devices
- Geography
- North America
- US
- Europe
- Germany
- UK
- France
- Asia
- Japan
- Rest of World (ROW)
- North America
By End-user Insights
The hospitals segment is estimated to witness significant growth during the forecast period. The hospital sector represents a substantial market segment in the global vascular embolization devices industry. These devices are extensively used in hospitals due to the high prevalence of vascular diseases, such as cerebrovascular diseases leading to strokes and heart attacks, and the increasing preference for minimally invasive procedures. Moreover, the expansion of healthcare infrastructure and the growing recognition among healthcare providers of the benefits of interventional therapies contribute to the rising demand for vascular embolization devices in hospitals worldwide. This segment holds significance due to its extensive patient pool and the availability of specialized medical professionals skilled in performing intricate procedures.
Get a glance at the market share of various segments Request Free Sample
The hospitals segment accounted for USD 1.05 billion in 2018 and showed a gradual increase during the forecast period.
Regional Insights
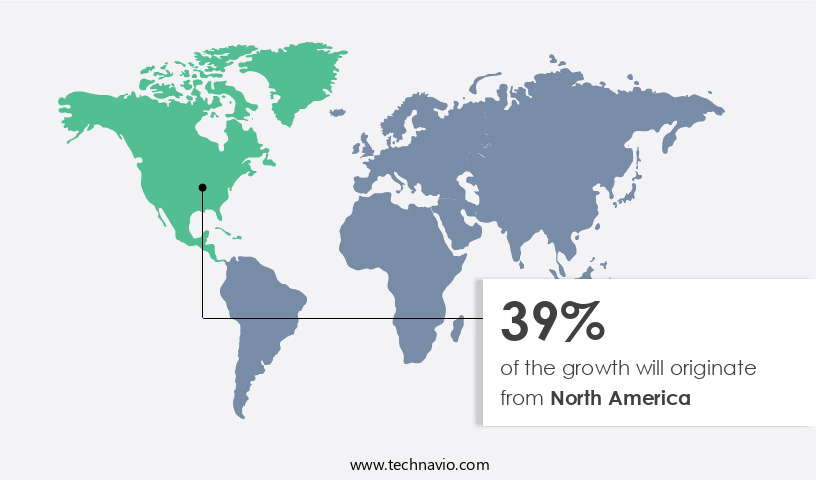
North America is estimated to contribute 39% to the growth of the global market during the forecast period. Technavio's analysts have elaborately explained the regional trends and drivers that shape the market during the forecast period.
For more insights on the market share of various regions Request Free Sample
The market in North America is poised for steady expansion over the forecast period due to several factors. Technological innovations and new product launches are key drivers, with numerous start-ups receiving funding to develop advanced medical devices. Furthermore, the prevalence of cancer and vascular diseases in the region, coupled with the availability of skilled medical professionals, is expected to boost market growth. For instance, the Brain Aneurysm Foundation reports that approximately 30,000 ruptures occur annually in the US. As embolization coils are utilized in treating brain aneurysms, the rising incidence of these conditions will fuel the demand for vascular embolization devices in North America. This market's growth is significant due to its potential to improve patient outcomes and reduce bleeding risks associated with vascular conditions.
Market Dynamics
Our researchers analyzed the data with 2023 as the base year, along with the key drivers, trends, and challenges. A holistic analysis of drivers will help companies refine their marketing strategies to gain a competitive advantage.
Market Driver
The increasing prevalence of vascular diseases is the key driver of the market. The market is witnessing significant growth due to the increasing prevalence of vascular diseases, such as cerebral aneurysms, arteriovenous malformations (AVMs), and peripheral vascular diseases. These conditions often require interventions using embolization devices for therapeutic purposes, including controlling bleeding and halting the progression of disease. According to the Brain Aneurysm Foundation, cerebral aneurysms affect approximately 3.2% of the global population, with a mean age of 50 years and a gender ratio of 1:1. After the age of 50, the female population is disproportionately affected due to decreased estrogen levels and reduced collagen content in the vascular tissue. Neuro-interventional radiology, hospitals, ambulatory surgical centers, and specialty clinics are key end-users of vascular embolization devices.
Moreover, neurology and oncology segments account for a significant market share due to the high prevalence of conditions such as intracranial aneurysms, neurovascular malformations, and liver cancer requiring embolization procedures. Technological advancements in embolization products, including shape memory medical's Avenir Coil System, intravascular embolization, and flow diverters, continue to drive market growth. Vascular diseases, including ischemic heart disease, cardiovascular diseases, rheumatic heart disease, and cerebrovascular disease, are chronic disorders affecting millions of people worldwide. Minimally invasive treatments, such as embolization, have become increasingly popular due to their effectiveness and reduced risk compared to traditional surgical procedures. The non-coiling devices segment, including embolic agents like microspheres, coils, detachable balloons, and embolic plugs, and support devices, is expected to witness significant growth during the forecast period.
Furthermore, the patient population for vascular embolization procedures includes those with severe hemoptysis (SH), aneurysms, and various other vascular diseases. The market for vascular embolization devices is expected to continue growing due to the increasing demand for minimally invasive procedures and the expanding target patient pool. Hospitals and clinics are the primary providers of healthcare services for vascular embolization procedures. In conclusion, The market is expected to grow significantly due to the increasing prevalence of vascular diseases, the growing demand for minimally invasive procedures, and technological advancements in embolization products. The market is segmented into neuro-interventional radiology, oncology, 5D segment, and hospitals & clinics, with neurology and oncology segments accounting for a significant market share. The non-coiling devices segment, including embolic agents and support devices, is expected to witness significant growth during the forecast period.
Market Trends
A rise in cases of automobile accidents is the upcoming trend in the market. The market has experienced significant growth due to the increasing prevalence of vascular diseases, such as aneurysms, arteriovenous malformations (AVMs), and neurovascular malformations. According to the Brain Aneurysm Foundation, approximately 6 million people in the US have an unruptured brain aneurysm, and ruptured brain aneurysms affect around 30,000 individuals annually. Neuro-interventional radiology has emerged as a leading therapeutic approach for managing these conditions, with minimally invasive procedures like embolization becoming increasingly popular. Embolization techniques involve the use of various devices, including embolization coils, liquid embolic agents, embolization particles, flow diverters, and support devices. These products are used to block the blood flow to the affected area, thereby preventing the progression of disease and reducing the risk of bleeding.
Moroever, the market for vascular embolization devices is segmented into the Non-coiling Devices Segment, which includes embolic agents, microspheres, coils, detachable balloons, and embolic plugs. The market is driven by the growing patient population with chronic diseases such as heart disease, chronic disorders, and cancer. The target patient pool includes neurology and oncology patients, as well as those requiring interventions for ischemic heart disease, cardiovascular diseases, rheumatic heart disease, cerebrovascular disease, heart attack, stroke, angioplasties, and severe hemoptysis (SH). The market is also influenced by technological advancements in vascular embolization techniques, which have led to the development of new and innovative embolization products and procedures.
The market for vascular embolization devices is vast and diverse, with applications in various healthcare services, including hospitals, ambulatory surgical centers, specialty clinics, and diagnostic centers. The market is expected to continue growing due to the increasing demand for minimally invasive treatments for various vascular diseases. The neurovascular segment, which includes cerebral aneurysms and neurovascular malformations, is a significant contributor to the market's growth. The oncology segment, which includes liver cancer and hepatocellular carcinoma, is also expected to witness significant growth due to the increasing incidence of cancer and the growing demand for minimally invasive cancer treatments. The 5D segment, which includes devices for diagnostic, therapeutic, interventional, imaging, and monitoring applications, is also expected to witness significant growth due to the increasing demand for minimally invasive procedures and the growing focus on improving patient outcomes.
In conclusion, the market is expected to witness significant growth due to the increasing prevalence of vascular diseases, the growing demand for minimally invasive treatments, and the ongoing technological advancements in embolization techniques. The market is vast and diverse, with applications in various healthcare services and segments, including neurology, oncology, and diagnostic centers. The market is expected to continue growing due to the increasing focus on improving patient outcomes and reducing the burden of chronic diseases on healthcare systems.
Market Challenge
High costs associated with embolization procedures is a key challenge affecting the market growth. The market encompasses a range of instruments utilized for therapeutic purposes in managing various vascular diseases. These devices include embolization coils, liquid embolic agents, embolization particles, flow diverters, and other support devices. Neuro-interventional radiology, neurology, oncology, and cardiovascular diseases are primary sectors where these devices find extensive application. Conditions such as unruptured and ruptured brain aneurysms, arteriovenous malformations (AVMs), aneurysms, neurovascular malformations, ischemic heart disease, cardiovascular diseases, cerebrovascular disease, heart attack, stroke, angioplasties, and severe hemoptysis (SH) are among the chronic disorders addressed through vascular embolization techniques. The National Health Department, hospitals, ambulatory surgical centers, and specialty clinics are significant healthcare services that contribute to the market's growth.
However, technological advancements in embolization products and minimally invasive procedures have expanded the target patient pool, enabling more precise and effective treatments. The market comprises several segments, including the Non-coiling Devices Segment, which includes embolic agents like microspheres, coils, detachable balloons, and embolic plugs. The market's growth is influenced by the increasing prevalence of chronic diseases, such as heart disease, cancer, and brain aneurysms, which necessitate coil embolization and other embolization procedures. Despite the market's potential, the high cost of vascular embolization devices and procedures can pose a challenge, increasing the financial burden on end-users and patients. However, ongoing research and development efforts aim to create more cost-effective solutions, ensuring continued growth in the market.
Exclusive Customer Landscape
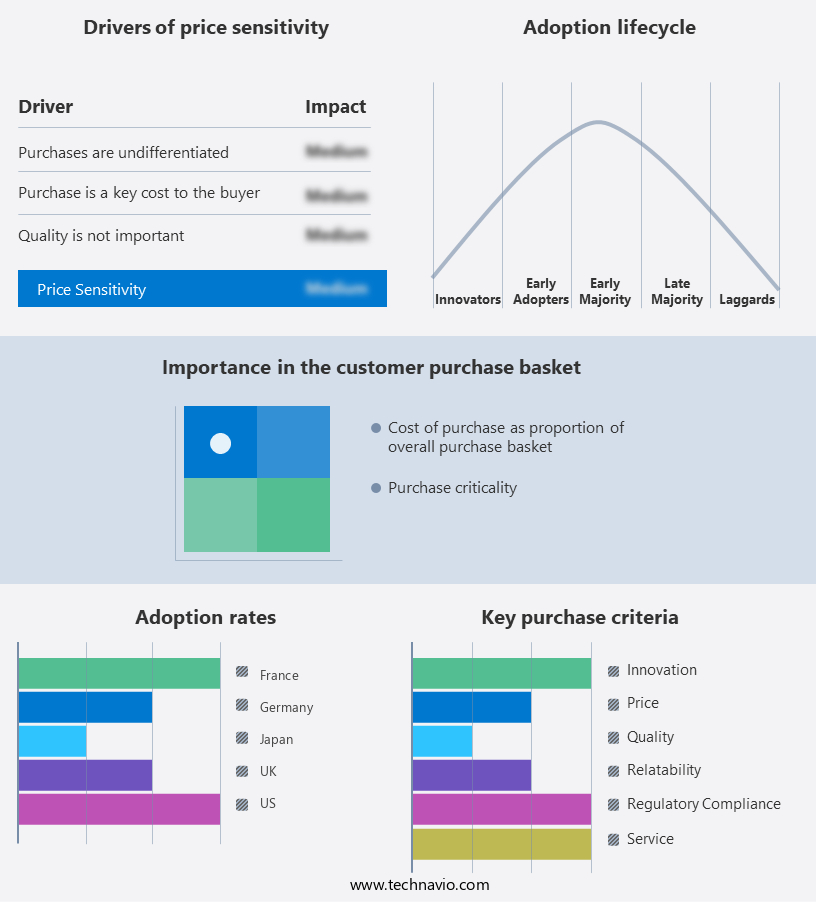
The market forecasting report includes the adoption lifecycle of the market, covering from the innovator's stage to the laggard's stage. It focuses on adoption rates in different regions based on penetration. Furthermore, the report also includes key purchase criteria and drivers of price sensitivity to help companies evaluate and develop their market growth analysis strategies.
Customer Landscape
Key Companies & Market Insights
Companies are implementing various strategies, such as strategic alliances, partnerships, mergers and acquisitions, geographical expansion, and product/service launches, to enhance their presence in the market.
Guerbet: The company offers vascular embolization devices such as DC Bead, which contains hydrophilic microspheres made from cross-linked polyvinyl alcohol polymer. It is injected via a catheter into targeted blood vessels to achieve selective embolization.
The market research and growth report includes detailed analyses of the competitive landscape of the market and information about key companies, including:
- Acandis GmbH
- B.Braun SE
- BALT Group
- Boston Scientific Corp.
- Braile Biomedica
- Eisai Co. Ltd.
- Embolx Inc.
- Guerbet
- Johnson and Johnson Services Inc.
- Kaneka Corp.
- Medtronic
- Merit Medical Systems Inc.
- Penumbra Inc.
- Shape Memory Medical Inc.
- Spartan Micro Inc.
- Stryker Corp.
- Wallby Medical LLC
- Terumo Corp.
- Cook Group Inc.
- Abbott Laboratories
Qualitative and quantitative analysis of companies has been conducted to help clients understand the wider business environment as well as the strengths and weaknesses of key market players. Data is qualitatively analyzed to categorize companies as pure play, category-focused, industry-focused, and diversified; it is quantitatively analyzed to categorize companies as dominant, leading, strong, tentative, and weak.
Research Analyst Overview
Vascular embolization devices are essential tools used in therapeutic interventions to manage various vascular diseases. These devices, including embolization coils, liquid embolic agents, and flow diverters, help control blood flow and halt the progression of diseases such as aneurysms and arteriovenous malformations (AVMs). Neuro-interventional radiology and hospitals & clinics utilize these minimally invasive treatments for conditions like unruptured and ruptured brain aneurysms, cerebral aneurysms, and neurovascular malformations. Patients with ischemic heart disease, cardiovascular diseases, coronary heart disease, rheumatic heart disease, cerebrovascular disease, heart attack, stroke, angioplasties, and chronic disorders like cancer benefit from these advanced procedures. Specialty clinics and ambulatory surgical centers offer these treatments to a growing patient population.
In conclusion, technological advancements in embolization products, such as the Avencoil System, enable intravascular embolization for intracranial aneurysms and severe hemoptysis (SH). The non-coiling devices segment also includes embolic agents like microspheres, coils, detachable balloons, and embolic plugs, as well as support devices. The neuro-interventional radiology segment and oncology segment are significant markets for these devices, with applications in urology, gastrointestinal diseases, liver cancer, and hepatocellular carcinoma. The Brain Aneurysm Foundation emphasizes the importance of early detection and treatment using these minimally invasive procedures. The healthcare services sector continues to expand, providing opportunities for the market to cater to the increasing demand for effective treatments for various vascular diseases.
|
Market Scope |
|
|
Report Coverage |
Details |
|
Page number |
167 |
|
Base year |
2023 |
|
Historic period |
2018-2022 |
|
Forecast period |
2024-2028 |
|
Growth momentum & CAGR |
Accelerate at a CAGR of 6.69% |
|
Market growth 2024-2028 |
USD 735.35 million |
|
Market structure |
Fragmented |
|
YoY growth 2023-2024(%) |
5.94 |
|
Regional analysis |
North America, Europe, Asia, and Rest of World (ROW) |
|
Performing market contribution |
North America at 39% |
|
Key countries |
US, Germany, France, UK, and Japan |
|
Competitive landscape |
Leading Companies, Market Positioning of Companies, Competitive Strategies, and Industry Risks |
|
Key companies profiled |
Acandis GmbH, B.Braun SE, BALT Group, Boston Scientific Corp., Braile Biomedica, Eisai Co. Ltd., Embolx Inc., Guerbet, Johnson and Johnson Services Inc., Kaneka Corp., Medtronic, Merit Medical Systems Inc., Penumbra Inc., Shape Memory Medical Inc., Spartan Micro Inc., Stryker Corp., Wallby Medical LLC, Terumo Corp., Cook Group Inc., and Abbott Laboratories |
|
Market dynamics |
Parent market analysis, market growth inducers and obstacles, market forecast, fast-growing and slow-growing segment analysis, COVID-19 impact and recovery analysis and future consumer dynamics, market condition analysis for the forecast period |
|
Customization purview |
If our market report has not included the data that you are looking for, you can reach out to our analysts and get segments customized. |
What are the Key Data Covered in this Market Research and Growth Report?
- CAGR of the market during the forecast period
- Detailed information on factors that will drive the market growth and forecasting between 2024 and 2028
- Precise estimation of the size of the market and its contribution of the market in focus to the parent market
- Accurate predictions about upcoming market growth and trends and changes in consumer behaviour
- Growth of the market across North America, Europe, Asia, and Rest of World (ROW)
- Thorough analysis of the market's competitive landscape and detailed information about companies
- Comprehensive analysis of factors that will challenge the growth of market companies
We can help! Our analysts can customize this market research report to meet your requirements. Get in touch
 RIA -
RIA - 
