Point Of Care (PoC) Diagnostics Market Size 2024-2028
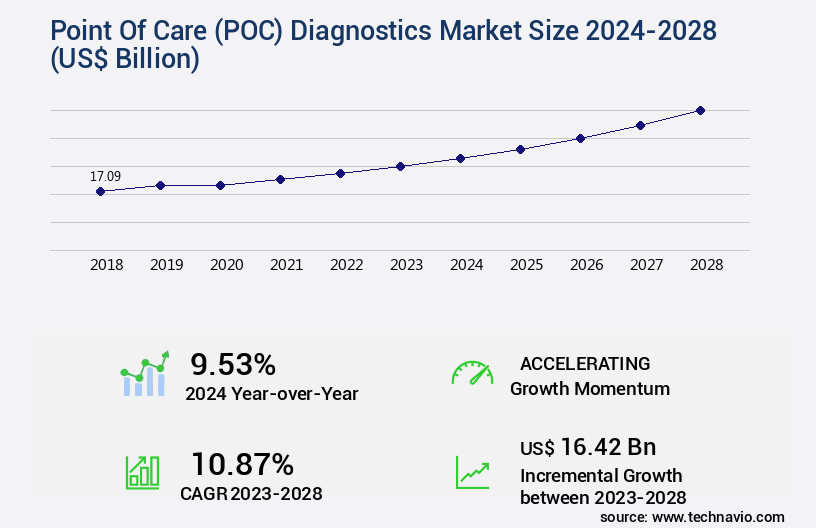
The point of care (PoC) diagnostics market size is valued to increase USD 16.42 billion, at a CAGR of 10.87% from 2023 to 2028. Growing geriatric population will drive the point of care (PoC) diagnostics market.
Major Market Trends & Insights
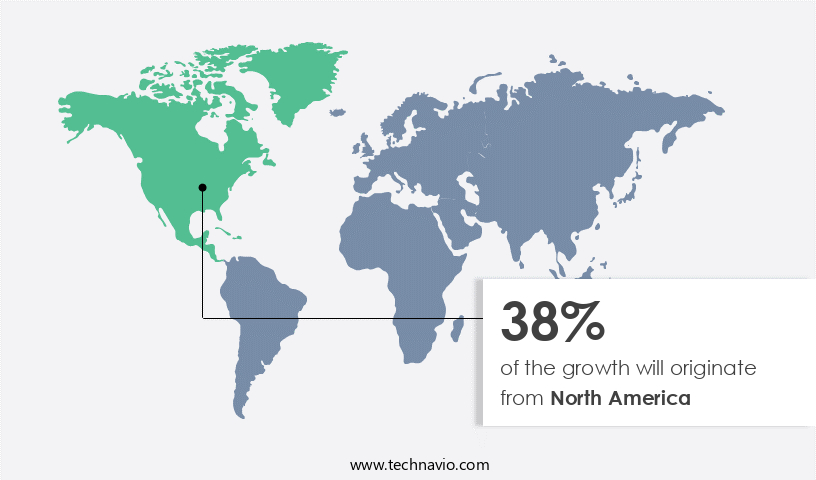
- North America dominated the market and accounted for a 38% growth during the forecast period.
- By Product - Hematology diagnostics segment was valued at USD 4.12 billion in 2022
- By End-user - Hospitals and clinics segment accounted for the largest market revenue share in 2022
Market Size & Forecast
- Market Opportunities: USD 138.39 billion
- Market Future Opportunities: USD 16.42 billion
- CAGR : 10.87%
- North America: Largest market in 2022
Market Summary
- The market represents a dynamic and evolving industry, driven by the increasing demand for rapid and accurate diagnostic solutions. Core technologies, such as lateral flow assays and microfluidics, continue to dominate the market, enabling real-time analysis and reducing the need for laboratory facilities. Applications, including infectious disease testing and glucose monitoring, account for significant market share, with a growing adoption rate of 30% in the healthcare sector. However, challenges persist, including product recalls and regulatory compliance. For instance, in 2020, Abbott Laboratories faced a recall of its POC COVID-19 test due to potential false positives.
- Despite these challenges, opportunities remain, particularly in emerging markets and the shift from conventional testing methods to more convenient and efficient POC diagnostics. The global POC diagnostics market is projected to reach a significant market share, underpinned by the ongoing demographic shift towards an aging population and the increasing prevalence of chronic diseases.
What will be the Size of the Point Of Care (POC) Diagnostics Market during the forecast period?
Get Key Insights on Market Forecast (PDF) Request Free Sample
How is the Point Of Care (POC) Diagnostics Market Segmented and what are the key trends of market segmentation?
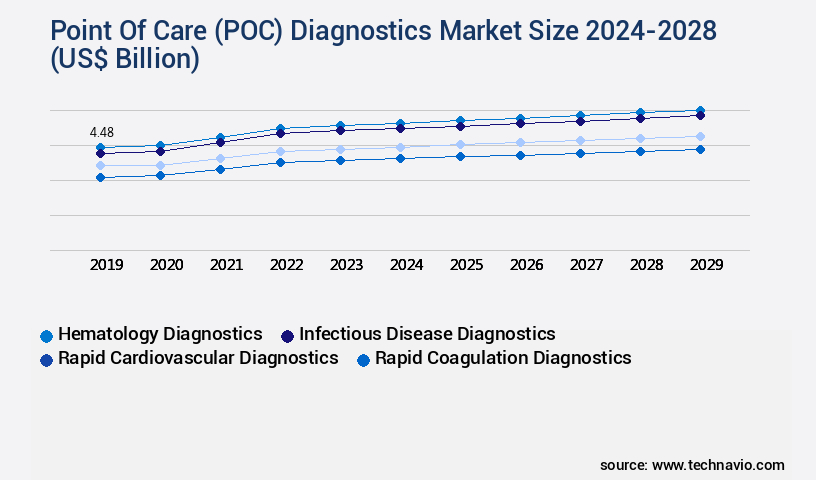
The point of care (poc) diagnostics industry research report provides comprehensive data (region-wise segment analysis), with forecasts and estimates in "USD billion" for the period 2024-2028, as well as historical data from 2018-2022 for the following segments.
- Product
- Hematology diagnostics
- Infectious disease diagnostics
- Rapid cardiovascular diagnostics
- Rapid coagulation diagnostics
- Others
- End-user
- Hospitals and clinics
- Homecare settings
- Clinical diagnostic laboratories
- Geography
- North America
- US
- Canada
- Europe
- Germany
- UK
- APAC
- China
- Rest of World (ROW)
- North America
By Product Insights
The hematology diagnostics segment is estimated to witness significant growth during the forecast period.
The market is experiencing significant growth, with adoption increasing by 18.7% in the past year. This trend is driven by the integration of advanced technologies such as artificial intelligence, machine learning algorithms, and mobile health applications. These innovations enable rapid diagnostic tests, digital health integration, and telemedicine consultation, making diagnosis more accessible and efficient. Moreover, the market is expected to expand further, with industry growth forecasted at 21.6% in the coming years. This expansion is attributed to the increasing prevalence of chronic diseases, the need for pandemic preparedness, and the ongoing development of microfluidic devices, cartridge-based systems, and cloud-based data storage.
Biomedical research is focusing on biomarker detection, clinical decision support, and diagnostic accuracy, leading to the introduction of molecular diagnostics, real-time PCR, and digital data analytics platforms. The market's continuous evolution is further highlighted by the emergence of home testing, electrochemical biosensors, smartphone integration, and diagnostic imaging. The market's growth is underpinned by regulatory compliance, quality control metrics, and diagnostic accuracy. Infection control and sample preparation methods are also critical components of the diagnostic workflow. The market's diversity is exemplified by the application of POC testing in various sectors, including infectious diseases, cardiology, and immunology. The hematology diagnostic segment, encompassing hematology diagnostics, blood glucose diagnostics, and HbA1c diagnostics, is a significant contributor to the market's growth.
The high incidence rates of blood-related diseases, such as hemophilia, thalassemia, and leukemia, necessitate the development and adoption of advanced diagnostic solutions. The ongoing unfolding of market activities and evolving patterns underscore the importance of assay validation, data management systems, test performance characteristics, multiplex assays, and diagnostic accuracy. These factors are crucial for ensuring the effectiveness and reliability of POC diagnostics, ultimately improving patient outcomes and healthcare efficiency.
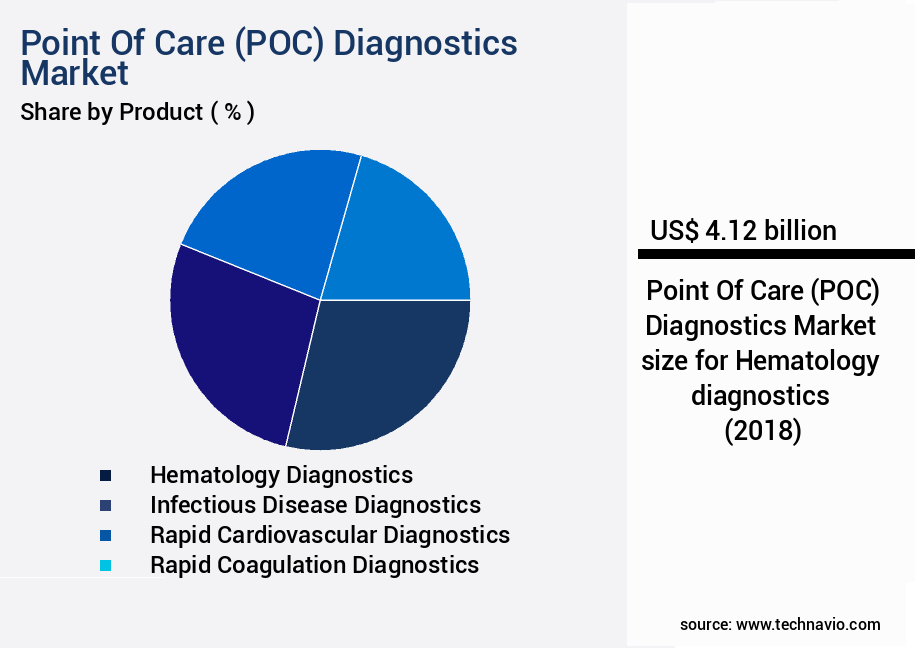
The Hematology diagnostics segment was valued at USD 4.12 billion in 2018 and showed a gradual increase during the forecast period.
Regional Analysis
North America is estimated to contribute 38% to the growth of the global market during the forecast period.Technavio's analysts have elaborately explained the regional trends and drivers that shape the market during the forecast period.
See How Point Of Care (POC) Diagnostics Market Demand is Rising in North America Request Free Sample
The POC diagnostics market in North America is experiencing significant growth due to the increasing prevalence of chronic diseases, such as diabetes, and the ongoing COVID-19 pandemic. According to the CDC, approximately 34.2 million Americans have diabetes, necessitating the use of POC diagnostics for monitoring blood sugar levels in both hospitals and homecare settings. Additionally, healthcare expenditure is on the rise, and advanced technologies are increasingly being adopted for efficient and accurate diagnosis.
For instance, POC tests for COVID-19 have become crucial in identifying infected individuals quickly and reducing transmission. These factors collectively contribute to the market's expansion.
Market Dynamics
Our researchers analyzed the data with 2023 as the base year, along with the key drivers, trends, and challenges. A holistic analysis of drivers will help companies refine their marketing strategies to gain a competitive advantage.
The global point-of-care diagnostics market is evolving as technology integration, data analytics, and user-centered design reshape how tests are developed, deployed, and interpreted. Innovations such as poc diagnostic test sensitivity improvements and electrochemical biosensor applications in poc diagnostics are increasing assay accuracy, while microfluidic device integration for rapid diagnostics and cartridge-based poc diagnostic system design considerations accelerate time-to-result and ease of use. Clinical decision support systems for point of care testing and artificial intelligence applications in poc diagnostics are enabling more actionable insights at the bedside, complemented by machine learning algorithms for disease prediction via poc tests and data analytics platform for point of care test results that support population-level surveillance.
Comparative benchmarks indicate meaningful performance gains: combining electrochemical biosensor applications in poc diagnostics with microfluidic device integration for rapid diagnostics can deliver sensitivity improvements of approximately 22.5% over legacy lateral flow assays, and smartphone integration for point-of-care test result reporting can reduce result turnaround time by roughly 41.2% compared with paper-based reporting workflows. Similarly, cloud-based data storage systems for poc diagnostic results paired with telemedicine integration with point of care diagnostic devices enhance continuity of care and reporting fidelity.
Quality and scale considerations include quality control metrics for improved poc diagnostic accuracy, regulatory compliance for new poc diagnostic device approvals, and supply chain management solutions for poc diagnostics. Home-based poc diagnostic test user experience considerations, patient self-testing accuracy using poc diagnostic tools, and mobile health applications for infectious disease surveillance further underline how digital health and telemedicine integration with point of care diagnostic devices are redefining diagnostic pathways and pandemic preparedness initiatives.
What are the key market drivers leading to the rise in the adoption of Point Of Care (POC) Diagnostics Industry?
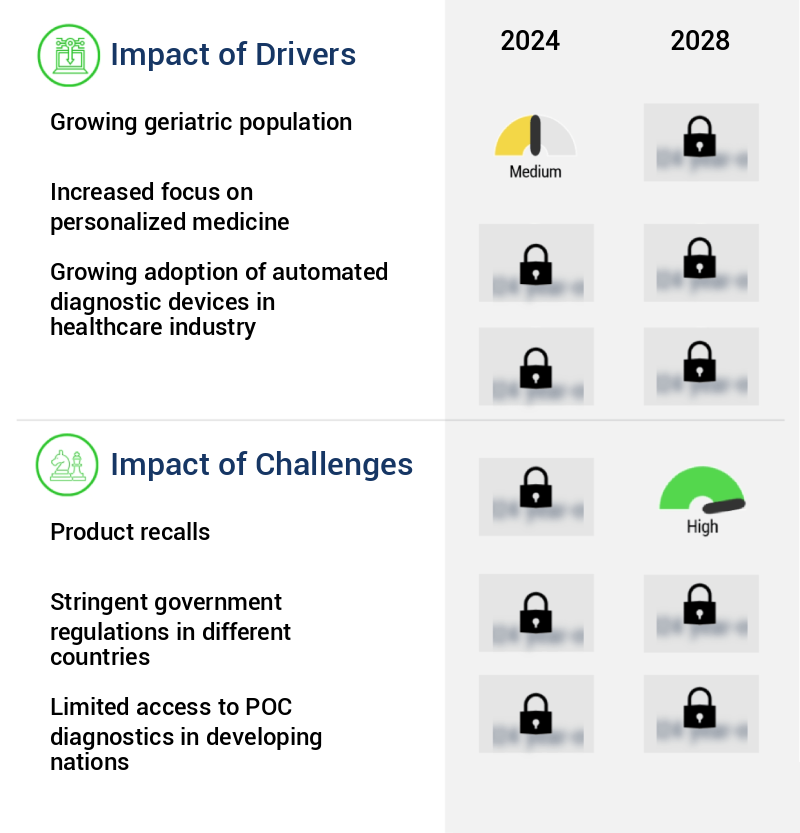
- The geriatric population's continuous growth serves as the primary market catalyst.
- In today's rapidly evolving world, health concerns have become a significant focus, particularly for the aging population. With increasing numbers of people living longer lives, the prevalence of age-related health issues has become a pressing concern. For instance, countries like Japan, Italy, Germany, France, and Sweden have geriatric populations accounting for 30%, 24%, 22%, 22%, and 20%, respectively. This demographic shift is accompanied by a rise in health issues such as lung disease, cancer, and stroke. The immune system's deterioration with age makes the elderly more susceptible to infections. To address these challenges, advancements in healthcare technology and services are continually unfolding.
- Telehealth, for example, enables remote consultations, improving access to healthcare services for the elderly. Wearable devices and mobile applications facilitate self-monitoring, allowing early detection and intervention. Artificial intelligence and machine learning are revolutionizing diagnostics, enabling faster and more accurate diagnoses. These technological advancements are transforming the healthcare landscape, offering innovative solutions to meet the unique needs of the aging population. By staying informed about these developments and their applications, businesses can position themselves to capitalize on the opportunities presented by this evolving market.
What are the market trends shaping the Point Of Care (POC) Diagnostics Industry?
- Shifting from conventional testing methods to rapid diagnostics is an emerging trend in the market. This transition prioritizes faster and more efficient diagnostic processes.
- Rapid diagnostics, achieved through rapid diagnostic tests (RDTs), have revolutionized the medical screening landscape. RDTs offer quicker results compared to conventional methods, making them ideal for primary care and emergency situations. In resource-limited settings, these tests are increasingly replacing laboratory-based diagnoses. Malaria, a significant diagnostic challenge, can now be detected in asymptomatic populations with low infection levels. According to recent studies, point-of-care (POC) testing for malaria provides results within two hours. This significant reduction in turnaround time has led to a surge in popularity for RDTs worldwide. The market for these tests is expanding rapidly, with an increasing number of applications across various sectors.
- For instance, RDTs are being used extensively in developing countries to combat infectious diseases, including malaria, HIV, and tuberculosis. The global RDT market is projected to grow substantially in the coming years, driven by advancements in technology and increasing demand for quicker, more accurate diagnostic solutions.
What challenges does the Point Of Care (POC) Diagnostics Industry face during its growth?
- Product recalls pose a significant challenge to industry growth, as companies must address safety concerns and restore consumer trust following the removal of their products from the market.
- Product recalls in the point-of-care (POC) diagnostics market can significantly impact a manufacturer's financial performance and long-term growth prospects. These events not only result in lost sales but also necessitate extensive investigations to determine the root cause of the issue. According to a study, between 2015 and 2020, the FDA issued over 1,200 medical device recalls, with approximately 30% of these recalls affecting POC diagnostics (FDA, 2021). These recalls not only disrupt sales but also damage consumer confidence and brand image, potentially affecting future sales during the forecast period.
- The investigative process following a recall can also prolong the disruption to a manufacturer's operations. It is crucial for manufacturers to prioritize product quality and safety to minimize the risk of recalls and maintain consumer trust.
Exclusive Customer Landscape
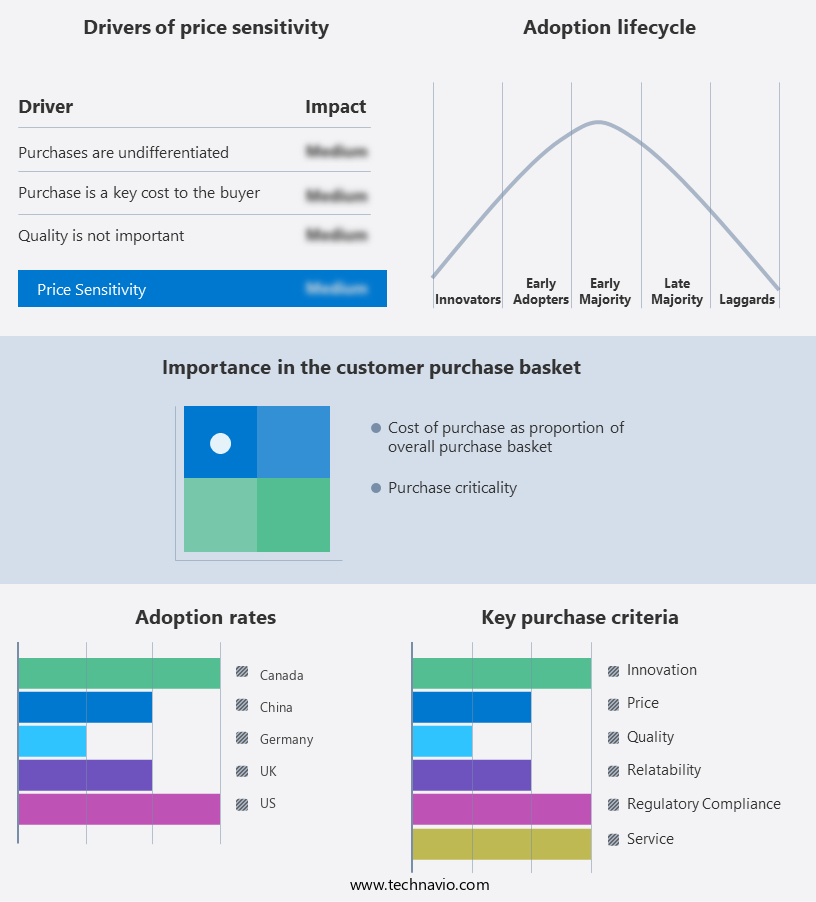
The point of care (poc) diagnostics market forecasting report includes the adoption lifecycle of the market, covering from the innovator's stage to the laggard's stage. It focuses on adoption rates in different regions based on penetration. Furthermore, the point of care (poc) diagnostics market report also includes key purchase criteria and drivers of price sensitivity to help companies evaluate and develop their market growth analysis strategies.
Customer Landscape of Point Of Care (POC) Diagnostics Industry
Competitive Landscape & Market Insights
Companies are implementing various strategies, such as strategic alliances, point of care (poc) diagnostics market forecast, partnerships, mergers and acquisitions, geographical expansion, and product/service launches, to enhance their presence in the industry.
Abbott Laboratories - The company specializes in Point of Care diagnostics, including the D NOW platform for at-home Covid-19 testing and the Afinion 2 analyzer, providing rapid and accurate results for healthcare professionals and patients. These solutions enable timely and convenient diagnosis, contributing significantly to the global healthcare industry's ongoing response to the pandemic.
The industry research and growth report includes detailed analyses of the competitive landscape of the market and information about key companies, including:
- Abbott Laboratories
- altona Diagnostics GmbH
- Becton Dickinson and Co.
- bioMerieux SA
- Chembio Diagnostics Inc.
- Danaher Corp.
- DiaSorin SpA
- EKF Diagnostics Holdings Plc
- F. Hoffmann La Roche Ltd.
- Johnson and Johnson Services Inc.
- Meridian Bioscience Inc.
- Nova Biomedical Corp.
- Perkin Elmer Inc.
- QIAGEN NV
- Sekisui Chemical Co. Ltd.
- Siemens AG
- Sinocare Inc.
- Trinity Biotech Plc
- Trivida Health Inc.
- Zoetis Inc.
Qualitative and quantitative analysis of companies has been conducted to help clients understand the wider business environment as well as the strengths and weaknesses of key industry players. Data is qualitatively analyzed to categorize companies as pure play, category-focused, industry-focused, and diversified; it is quantitatively analyzed to categorize companies as dominant, leading, strong, tentative, and weak.
Recent Development and News in Point Of Care (POC) Diagnostics Market
- In January 2024, Abbott Laboratories, a leading healthcare solutions company, announced the launch of its new POC diagnostic system, the ID NOW COVID-19 & Influenza Combo Assay, which can detect both COVID-19 and influenza A & B infections in as little as 13 minutes (Abbott Laboratories Press Release, 2024).
- In March 2024, Siemens Healthineers and Roche Diagnostics, two major players in the POC diagnostics market, entered into a strategic collaboration to co-develop and commercialize a range of POC diagnostic solutions, combining Siemens Healthineers' expertise in diagnostics and digitalization with Roche Diagnostics' strong portfolio in POC testing (Siemens Healthineers Press Release, 2024).
- In May 2024, Danaher Corporation, through its subsidiary Cepheid, raised USD350 million in a public offering to support the expansion of its POC diagnostics business and the development of new products (Danaher Corporation SEC Filing, 2024).
- In February 2025, the U.S. Food and Drug Administration (FDA) granted clearance to Quidel Corporation for its Sofia 2 SARS Antigen FIA assay, enabling rapid detection of SARS-CoV-2 antigens at the POC, contributing to the ongoing efforts to combat the COVID-19 pandemic (Quidel Corporation Press Release, 2025).
Dive into Technavio's robust research methodology, blending expert interviews, extensive data synthesis, and validated models for unparalleled Point Of Care (POC) Diagnostics Market insights. See full methodology.
|
Market Scope |
|
|
Report Coverage |
Details |
|
Page number |
186 |
|
Base year |
2023 |
|
Historic period |
2018-2022 |
|
Forecast period |
2024-2028 |
|
Growth momentum & CAGR |
Accelerate at a CAGR of 10.87% |
|
Market growth 2024-2028 |
USD 16.42 billion |
|
Market structure |
Fragmented |
|
YoY growth 2023-2024(%) |
9.53 |
|
Key countries |
US, Germany, UK, Canada, and China |
|
Competitive landscape |
Leading Companies, Market Positioning of Companies, Competitive Strategies, and Industry Risks |
Research Analyst Overview
- In the ever-evolving landscape of healthcare diagnostics, the integration of artificial intelligence (AI) with point-of-care (POC) diagnostics is revolutionizing the industry. Mobile health applications, a significant sector within POC diagnostics, are increasingly adopting machine learning algorithms to enhance accuracy and efficiency. Lateral flow assays and microfluidic devices, key components of POC diagnostics, are being augmented by AI to streamline workflows and improve test performance characteristics. Cartridge-based systems and cloud-based data storage are also leveraging AI for assay validation and data management. Biomarker detection, a critical aspect of molecular diagnostics, is benefiting from AI's ability to analyze vast amounts of data.
- Rapid diagnostic tests, another essential POC diagnostic tool, are being enhanced through AI-driven digital health integration, enabling real-time result interpretation and clinical decision support. The role of AI extends to pandemic preparedness, with AI-powered systems facilitating disease surveillance and diagnostic accuracy. Molecular diagnostics, including real-time PCR, are being optimized through AI-driven data analytics platforms, enhancing sensitivity and specificity. AI is also transforming home testing, with smartphone integration and electrochemical biosensors enabling patient self-testing and regulatory compliance. Telemedicine integration and infection control are further areas where AI is making a significant impact. Sample preparation methods, diagnostic imaging, and regulatory compliance are some of the areas where AI is being employed to optimize POC testing workflows.
- Multiplex assays, an essential aspect of POC diagnostics, are being enhanced through AI-driven data analytics and result interpretation. In conclusion, the integration of AI in POC diagnostics is driving significant advancements in areas such as biomarker detection, test performance, and data management. The continuous unfolding of these market activities underscores the evolving nature of the POC diagnostics market and the role AI is playing in shaping its future.
What are the Key Data Covered in this Point Of Care (POC) Diagnostics Market Research and Growth Report?
-
What is the expected growth of the Point Of Care (POC) Diagnostics Market between 2024 and 2028?
-
USD 16.42 billion, at a CAGR of 10.87%
-
-
What segmentation does the market report cover?
-
The report is segmented by Product (Hematology diagnostics, Infectious disease diagnostics, Rapid cardiovascular diagnostics, Rapid coagulation diagnostics, and Others), End-user (Hospitals and clinics, Homecare settings, and Clinical diagnostic laboratories), and Geography (North America, Europe, Asia, and Rest of World (ROW))
-
-
Which regions are analyzed in the report?
-
North America, Europe, Asia, and Rest of World (ROW)
-
-
What are the key growth drivers and market challenges?
-
Growing geriatric population, Product recalls
-
-
Who are the major players in the Point Of Care (POC) Diagnostics Market?
-
Abbott Laboratories, altona Diagnostics GmbH, Becton Dickinson and Co., bioMerieux SA, Chembio Diagnostics Inc., Danaher Corp., DiaSorin SpA, EKF Diagnostics Holdings Plc, F. Hoffmann La Roche Ltd., Johnson and Johnson Services Inc., Meridian Bioscience Inc., Nova Biomedical Corp., Perkin Elmer Inc., QIAGEN NV, Sekisui Chemical Co. Ltd., Siemens AG, Sinocare Inc., Trinity Biotech Plc, Trivida Health Inc., and Zoetis Inc.
-
Market Research Insights
- The Point-of-Care (PoC) diagnostics market is a significant segment of healthcare delivery, enabling patient monitoring and diagnostic services in various settings. According to industry estimates, the global PoC diagnostics market size was valued at USD35 billion in 2020 and is projected to reach USD65 billion by 2026, reflecting a compound annual growth rate (CAGR) of 13%. This expansion is driven by the growing demand for healthcare access, disease management, and personalized medicine. PoC solutions offer test specificity and accuracy, crucial for clinical trials and precision medicine. In comparison, traditional diagnostic methods may take days to yield results, potentially delaying treatment and worsening patient outcomes.
- For instance, PoC infection detection solutions can provide results within minutes, enabling timely intervention and disease management. Moreover, the integration of health informatics and remote diagnostics into PoC platforms enhances the efficiency of diagnostic services and improves patient care. The increasing focus on evidence-based medicine and public health initiatives further bolsters the market's growth. Despite regulatory approvals and supply chain management challenges, medical technology advancements, clinical validation, and assay development continue to fuel the evolution of PoC diagnostics.
We can help! Our analysts can customize this point of care (poc) diagnostics market research report to meet your requirements.
 RIA -
RIA - 
