Bone Grafts and Substitutes Market Analysis North America, Europe, Asia, Rest of World (ROW) - US, Germany, UK, China, Japan - Size and Forecast 2024-2028

Bone Grafts and Substitutes Market Analysis North America, Europe, Asia, Rest of World (ROW) - US, Germany, UK, China, Japan - Size and Forecast 2024-2028

Published: May 2024 183 Pages SKU: IRTNTR73350

Market Overview at a Glance

$1.72 B
Market Opportunity
9.45%
CAGR
8.42
YoY growth 2023-2024(%)

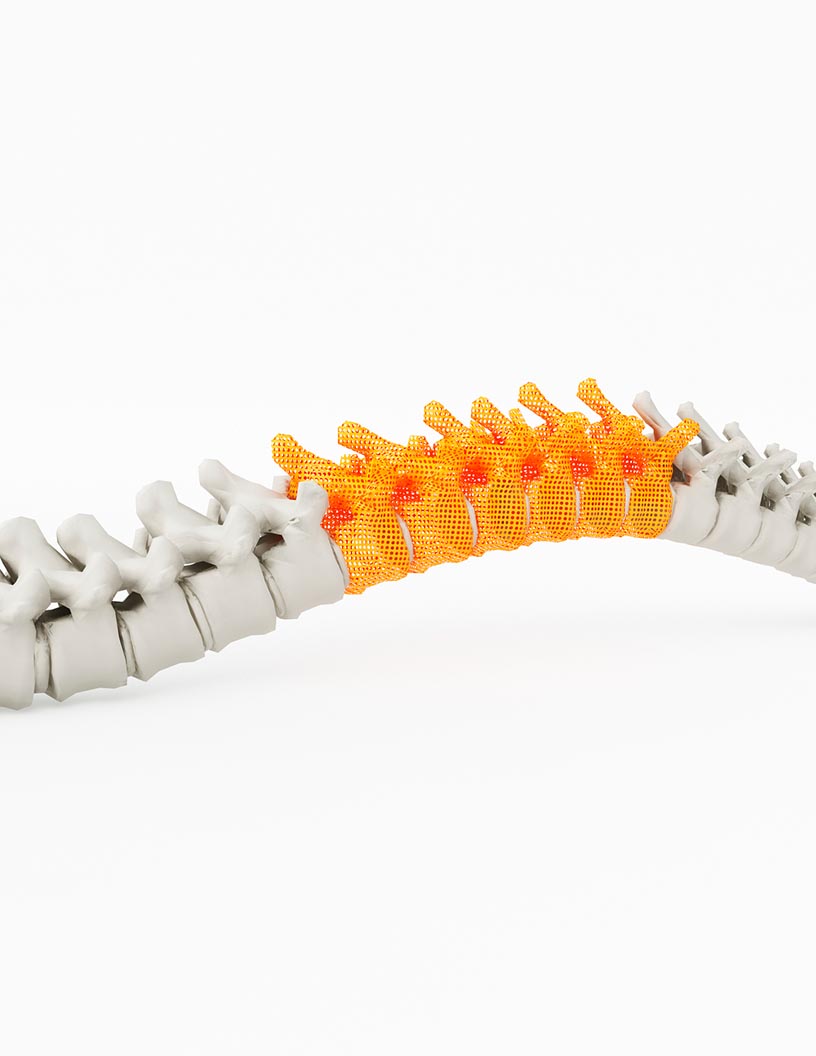
Bone Grafts And Substitutes Market Size 2024-2028

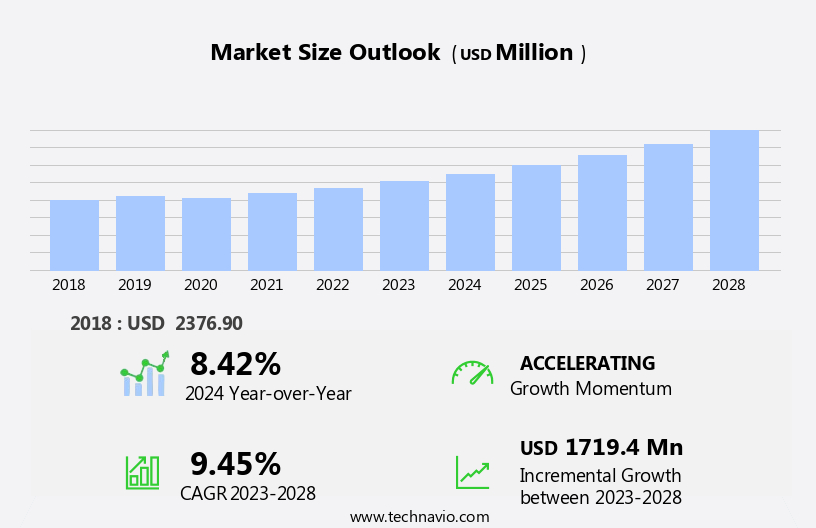
The bone grafts and substitutes market size is forecast to increase by USD 1.72 billion, at a CAGR of 9.45% between 2023 and 2028.

  • The market is witnessing significant growth, driven by the increasing prevalence of orthopedic conditions and the subsequent rise in surgical procedures. The market is further fueled by the adoption of minimally invasive surgical techniques, which reduce recovery time and post-operative complications, making bone grafts and substitutes increasingly popular. However, high costs associated with implants and procedures pose a substantial challenge for market growth. Despite this, opportunities exist for companies to innovate and offer cost-effective solutions, catering to the growing demand for efficient and affordable bone grafting technologies.
  • In summary, the market is experiencing robust growth due to the rising number of orthopedic conditions and surgical procedures, with the adoption of minimally invasive techniques providing additional momentum. However, high costs remain a significant challenge, offering opportunities for companies to differentiate themselves by offering cost-effective solutions.

What will be the Size of the Bone Grafts And Substitutes Market during the forecast period?

Bone Grafts And Substitutes Market Size

Explore in-depth regional segment analysis with market size data - historical 2018-2022 and forecasts 2024-2028 - in the full report.  
Request Free Sample

The market continues to evolve, driven by advancements in technology and research. Three-dimensional (3D) printing is revolutionizing the industry, enabling the creation of customized bone grafts with precise dimensions and mechanical strength. Synthetic bone grafts, such as tricalcium phosphate and calcium phosphate cements, offer advantages over harvested bone grafts, including eliminating the need for a second surgical site and reducing donor site morbidity. Bone remodeling, a critical aspect of bone grafting, is being enhanced through the use of bioactive glass and stem cells. These materials promote tissue engineering and bone regeneration, leading to improved patient outcomes. Minimally invasive surgery is another trend gaining traction, allowing for faster recovery times and reduced infection rates.

Long-term stability is a key consideration in bone grafting procedures, with scaffolding materials and bone substitutes playing crucial roles. Antimicrobial coatings and drug delivery systems are also being integrated into bone grafts to prevent infection and promote healing. Regulatory approvals for new bone grafting techniques and materials are ongoing, with clinical trials and pre-clinical testing providing valuable insights into patient outcomes and safety. Reconstructive surgery, oncology surgery, trauma surgery, and orthopedic applications are among the sectors benefiting from these advancements. Surgical techniques continue to evolve, with image-guided surgery and tissue engineering offering promising solutions for complex cases. The future of bone grafting lies in the continued exploration of innovative materials and technologies, ensuring the best possible outcomes for patients.

How is this Bone Grafts And Substitutes Industry segmented?

The bone grafts and substitutes industry research report provides comprehensive data (region-wise segment analysis), with forecasts and estimates in "USD million" for the period 2024-2028, as well as historical data from 2018-2022 for the following segments.

  • Product
    • Xenografts
    • Allografts
    • Synthetic bone grafts
    • DBM
  • Application
    • Spinal fusion
    • Trauma
    • Craniomaxillofacial
    • Joint reconstruction
    • Dental bone grafting
  • End-User
    • Hospitals
    • Orthopedic Clinics
    • Ambulatory Surgical Centers
    • Dental Clinics
  • Material
    • Autologous Bone
    • Ceramic-Based
    • Polymer-Based
    • Growth Factor-Based
  • Geography
    • North America
      • US
    • Europe
      • Germany
      • UK
    • APAC
      • China
      • Japan
    • Rest of World (ROW)

By Product Insights

The xenografts segment is estimated to witness significant growth during the forecast period.

Xenografts, derived from transplants between closely related species, function as biological dressings for wound healing. They offer protection against bacterial and physical trauma, alleviate pain, and enhance moisture and heat retention. In the market, xenografts hold the largest share due to the rising prevalence of knee and hip injuries, technological advancements such as 3D-printed implants, and new product introductions from key players. In dentistry, xenografts are predominantly porcine and bovine, sourced from pig and cow tissues. Thoroughly cleaned, sterilized, and prepared for implantation, these grafts contribute significantly to the field of regenerative medicine. Advancements in tissue engineering, bioactive glass, stem cells, and antimicrobial coatings further bolster the market's growth.

Clinical trials, craniofacial and dental applications, minimally invasive surgery, long-term stability, and infection rates are crucial factors influencing market dynamics. Synthetic bone grafts, calcium phosphate cements, and bone substitutes also play essential roles in bone regeneration. Regulatory approvals, patient outcomes, and pre-clinical testing are integral components of the market's evolution.

Bone Grafts And Substitutes Market Size

Request Free Sample

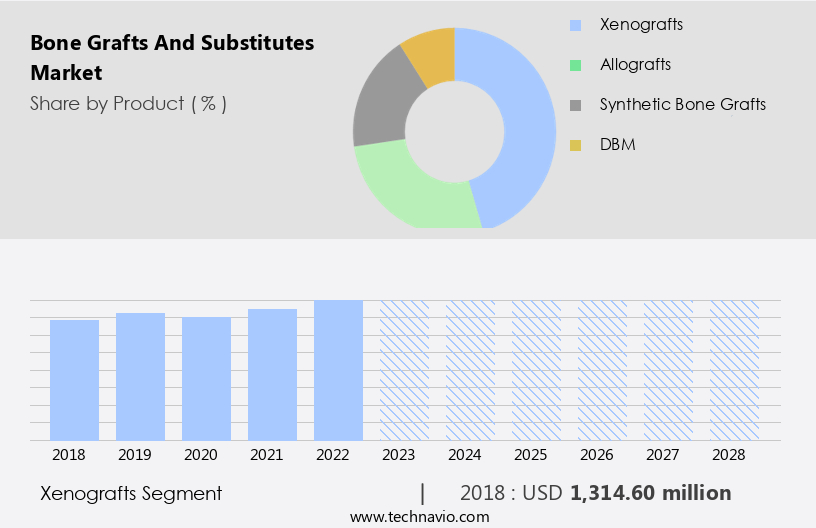
The Xenografts segment was valued at USD 1.31 billion in 2018 and showed a gradual increase during the forecast period.

Regional Analysis

North America is estimated to contribute 41% to the growth of the global market during the forecast period.Technavio's analysts have elaborately explained the regional trends and drivers that shape the market during the forecast period.

Bone Grafts And Substitutes Market Share by Geography

 Request Free Sample

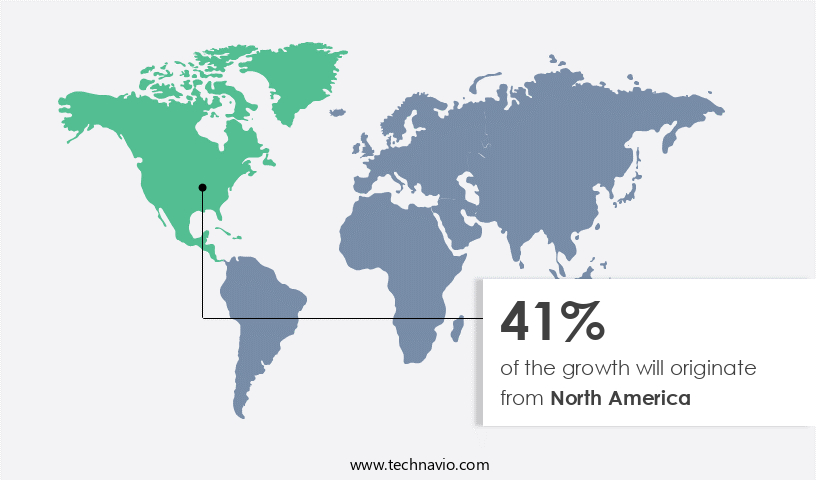
The market in North America is experiencing steady growth, driven by the increasing prevalence of orthopedic conditions, advancements in technology, and regulatory approvals. Tricalcium phosphate, a popular bone substitute, is gaining traction due to its biocompatibility and osteoconductive properties, enhancing bone regeneration. Tissue engineering and 3D printing technologies are revolutionizing bone grafting procedures, offering minimally invasive options and customized implants. Clinical trials are underway for novel bone grafting solutions, such as stem cell-based therapies and bioactive glass, which promise improved mechanical strength and long-term stability. Infection rates remain a concern, leading to the development of antimicrobial coatings and drug delivery systems.

Synthetic bone grafts, calcium phosphate cements, and scaffolding materials are increasingly being used in reconstructive, oncology, and trauma surgeries. Pre-clinical testing and patient outcomes are crucial factors influencing market trends. Regulatory approvals and surgical techniques continue to evolve, ensuring the safety and efficacy of bone grafts and substitutes. Bioresorbable materials are also gaining attention for their ability to promote bone remodeling and minimize implant failure.

Market Dynamics

Our researchers analyzed the data with 2023 as the base year, along with the key drivers, trends, and challenges. A holistic analysis of drivers will help companies refine their marketing strategies to gain a competitive advantage.

The global bone grafts and substitutes market size and forecast projects growth, driven by bone grafts market trends 2024-2028. B2B bone graft solutions leverage advanced biomaterial technologies for efficacy. Bone grafts market growth opportunities 2025 include grafts for orthopedic surgery and synthetic bone substitutes, meeting demand. Bone graft supply chain software optimizes operations, while bone grafts market competitive analysis highlights key manufacturers. Sustainable biomaterial practices align with eco-friendly medical trends. Bone grafts regulations 2024-2028 shapes bone graft demand in North America 2025. Bioactive graft solutions and premium bone graft insights boost adoption. Grafts for dental surgery and customized graft designs target niches. Bone grafts market challenges and solutions address biocompatibility, with direct procurement strategies for grafts and bone graft pricing optimization enhancing profitability. Data-driven bone graft analytics and regenerative medicine trends drive innovation.

What are the key market drivers leading to the rise in the adoption of Bone Grafts And Substitutes Industry?

  • The orthopedic market is primarily driven by the increasing prevalence of orthopedic conditions necessitating surgical interventions. Bone grafts and substitutes have gained significant attention in the medical field due to their role in promoting bone regeneration and tissue engineering. These materials are essential for the treatment of various orthopedic conditions, including fractures and degenerative joint diseases. Tricalcium phosphate, bioactive glass, and stem cells are some of the commonly used bone graft substitutes. Wound healing is accelerated through these materials, reducing the recovery time and healthcare costs. Advancements in technology have led to the development of antimicrobial coatings and tissue engineering techniques to prevent infection and enhance bone growth. Clinical trials are ongoing to evaluate the safety and efficacy of these innovative solutions.
  • Craniofacial and dental applications are the primary markets for bone grafts and substitutes. The increasing prevalence of bone disorders and the growing number of surgeries, particularly in ambulatory surgical centers, are expected to fuel the demand for these products. In summary, bone grafts and substitutes play a crucial role in the treatment of bone injuries and diseases. With advancements in technology and ongoing research, these materials offer promising solutions for improving bone regeneration and reducing healthcare costs. Clinical trials and innovations in tissue engineering and antimicrobial coatings are expected to further expand the applications and market potential of bone grafts and substitutes.

What are the market trends shaping the Bone Grafts And Substitutes Industry?

  • The increasing preference for minimally invasive surgeries represents a significant market trend. This surgical approach, characterized by smaller incisions and reduced trauma to the body, is gaining widespread adoption among healthcare professionals and patients alike.
  • Minimally invasive bone grafting procedures are gaining popularity in orthopedics due to their numerous advantages over traditional open surgeries. These advantages include less pain and discomfort, lower infection and bleeding rates, shorter hospital stays, smaller scars, and quicker recovery times. This novel technique, which requires a smaller incision, is used in various orthopedic procedures such as arthroscopy, knee and hip replacement, and spine fusion. It is particularly preferred for treating sports-related injuries. Synthetic bone grafts and scaffolding materials, including those produced through 3D printing, are increasingly being used in bone grafting procedures. These alternatives to bone harvesting offer long-term stability and reduced risk of complications.
  • Infection rates are a significant concern in bone grafting, and the use of synthetic materials can help mitigate this risk. The orthopedic industry is continually innovating to improve bone grafting techniques and materials, ensuring better outcomes for patients. Minimally invasive surgery and synthetic bone grafts are expected to continue driving growth in this field.

What challenges does the Bone Grafts And Substitutes Industry face during its growth?

  • The escalating costs related to implant procedures are a significant challenge impeding the growth of the industry, requiring continuous efforts to mitigate these expenses and ensure affordability for patients. 
  • The market faces a significant challenge due to the high cost of bone grafting procedures. Orthopedic implants are essential for treating various conditions related to joints, spine, and maxillofacial injuries. The cost of these bone grafts and substitutes varies based on applications and features. For instance, the average cost of dental grafting procedures ranges from USD2,500 to USD3,500. Mechanical strength, a crucial factor in bone grafts and substitutes, influences their cost. Bone substitutes, such as calcium phosphate cements, offer an alternative to traditional bone grafts. However, regulatory approvals and the development of advanced bone substitutes with improved drug delivery systems and bone regeneration capabilities continue to drive market growth.
  • Implant failure is a concern in bone grafting procedures, leading to increased demand for superior bone grafts and substitutes. Reconstructive surgery using bone grafts and substitutes is an immersive and harmonious process that requires a robust value chain. The cost of bone grafting increases by 130%-150% across the value chain. Despite the challenges, the market for bone grafts and substitutes remains a vital area of research and development, with a focus on creating cost-effective and efficient solutions.

Exclusive Customer Landscape

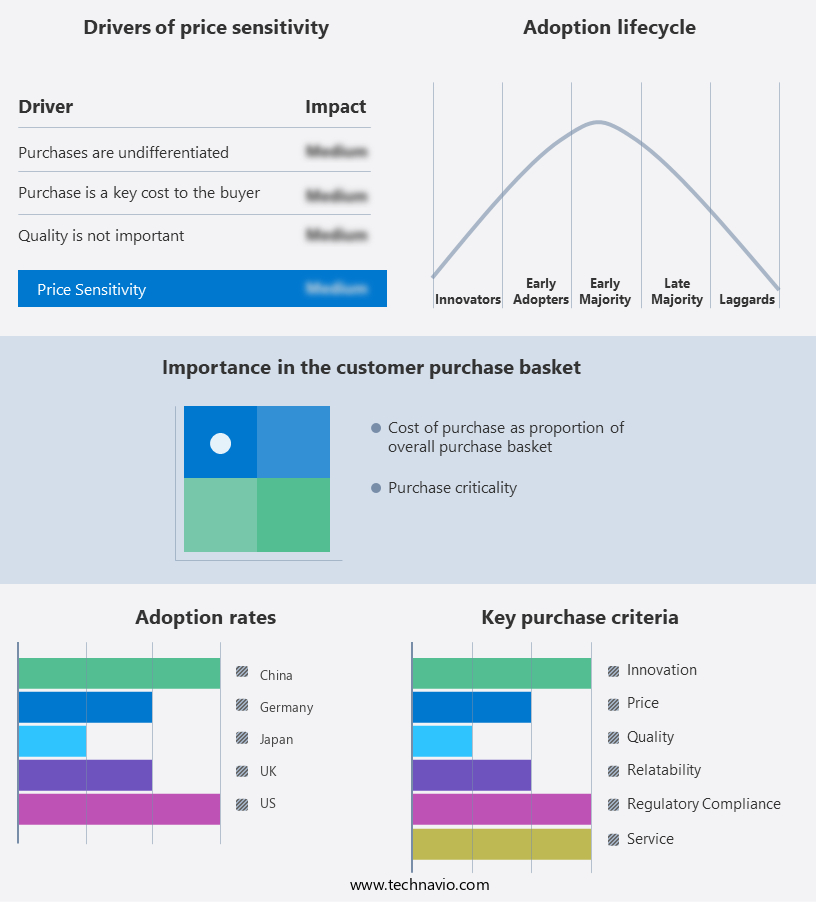
The bone grafts and substitutes market forecasting report includes the adoption lifecycle of the market, covering from the innovator's stage to the laggard's stage. It focuses on adoption rates in different regions based on penetration. Furthermore, the bone grafts and substitutes market report also includes key purchase criteria and drivers of price sensitivity to help companies evaluate and develop their market growth analysis strategies.

Bone Grafts And Substitutes Market Share by Geography

 Customer Landscape

Key Companies & Market Insights

Companies are implementing various strategies, such as strategic alliances, bone grafts and substitutes market forecast, partnerships, mergers and acquisitions, geographical expansion, and product/service launches, to enhance their presence in the industry.

AlloSource - This company specializes in bone graft and substitute innovations, featuring demineralized bone matrix in a reverse-phase medium. Their offerings aim to address bone regeneration needs, enhancing surgical efficacy and patient outcomes.

The industry research and growth report includes detailed analyses of the competitive landscape of the market and information about key companies, including:

  • AlloSource
  • Arthrex Inc.
  • Baxter International Inc.
  • Bioventus LLC
  • Ed. Geistlich Sohne AG
  • Institut Straumann AG
  • Integra Lifesciences Corp.
  • Johnson and Johnson Services Inc.
  • Medtronic Plc
  • MTF Biologics
  • NovaBone Products LLC
  • Nuvasive Inc.
  • Orthofix Medical Inc.
  • OST Laboratories
  • RTI Surgical Inc.
  • Smith and Nephew plc
  • Stryker Corp.
  • TBF TISSUE ENGINEERING
  • Xtant Medical Holdings Inc.
  • Zimmer Biomet Holdings Inc.

Qualitative and quantitative analysis of companies has been conducted to help clients understand the wider business environment as well as the strengths and weaknesses of key industry players. Data is qualitatively analyzed to categorize companies as pure play, category-focused, industry-focused, and diversified; it is quantitatively analyzed to categorize companies as dominant, leading, strong, tentative, and weak.

Recent Development and News in Bone Grafts And Substitutes Market

  • In January 2024, Stryker Corporation, a leading medical technology company, announced the FDA approval of its new bone graft substitute, Reef™ DBM Putty Plus with Antibiotic. This innovative product, which incorporates antibiotic technology, aims to reduce the risk of infection during bone grafting procedures (Stryker Corporation, 2024).
  • In March 2024, Medtronic plc and Orthofix Medical Inc. Entered into a strategic partnership to expand their offerings in the bone graft substitutes market. The collaboration combines Medtronic's spinal and orthopedic expertise with Orthofix's bone graft substitutes and biologics portfolio, aiming to provide comprehensive solutions for healthcare providers (Medtronic plc, 2024).
  • In May 2024, Smith & Nephew, a global medical technology business, completed the acquisition of Osiris Therapeutics, a leading regenerative medicine company. The acquisition adds Osiris' extensive portfolio of bone graft substitutes and cell therapies to Smith & Nephew's product offerings, enhancing their presence in the regenerative medicine market (Smith & Nephew, 2024).
  • In April 2025, the European Commission granted marketing authorization for Integra LifeSciences Holdings Corporation's Bone Substitute, BMP-2 Infuse Eluting Implant. This approval marks a significant milestone for Integra, expanding its product offerings in Europe and further strengthening its position in the global bone graft substitutes market (Integra LifeSciences Holdings Corporation, 2025).

Research Analyst Overview

  • The market encompasses various types of grafts, including autologous bone marrow and allogeneic and xenogeneic grafts. In vivo and in vitro studies are crucial in evaluating the inflammation response, mechanical properties, and degradation kinetics of these grafts. Storage conditions, such as temperature and humidity, significantly impact the shelf life and tensile strength of bone grafts. Cytotoxicity testing and histological analysis are essential for assessing the safety and bioactivity of bone grafts. Surface coatings and modifications, like platelet-rich plasma (PRP), improve graft integration and enhance mechanical properties, such as compressive strength and fatigue resistance. Quality control and sterilization methods play a vital role in ensuring the safety and efficacy of bone grafts.
  • Market access and reimbursement policies also influence the adoption of bone grafts, particularly in the context of cancellous and cortical bone applications. In vitro studies on xenogeneic bone grafts reveal promising results in terms of mechanical properties and bioactivity assays. Surface coatings and cell seeding techniques further enhance their potential. However, concerns regarding cytotoxicity and degradation kinetics persist, necessitating rigorous testing and quality control measures. Allogeneic bone grafts offer advantages in terms of availability and eliminating the need for a second surgical site. However, challenges related to immunogenic response and shelf life remain. Innovations in surface modification, such as bioactive peptides, aim to address these challenges and expand the application scope of allogeneic bone grafts.
  • The market continues to evolve, driven by advancements in material science, biotechnology, and regulatory frameworks. Understanding the interplay between these factors is crucial for stakeholders seeking to capitalize on the market's growth potential.

Dive into Technavio's robust research methodology, blending expert interviews, extensive data synthesis, and validated models for unparalleled Bone Grafts And Substitutes Market insights. See full methodology.

Market Scope

Report Coverage

Details

Page number

183

Base year

2023

Historic period

2018-2022

Forecast period

2024-2028

Growth momentum & CAGR

Accelerate at a CAGR of 9.45%

Market growth 2024-2028

USD 1719.4 million

Market structure

Fragmented

YoY growth 2023-2024(%)

8.42

Key countries

US, Germany, UK, China, and Japan

Competitive landscape

Leading Companies, Market Positioning of Companies, Competitive Strategies, and Industry Risks

Request Free Sample

What are the Key Data Covered in this Bone Grafts And Substitutes Market Research and Growth Report?

  • CAGR of the Bone Grafts And Substitutes industry during the forecast period
  • Detailed information on factors that will drive the growth and forecasting between 2024 and 2028
  • Precise estimation of the size of the market and its contribution of the industry in focus to the parent market
  • Accurate predictions about upcoming growth and trends and changes in consumer behaviour
  • Growth of the market across North America, Europe, Asia, and Rest of World (ROW)
  • Thorough analysis of the market's competitive landscape and detailed information about companies
  • Comprehensive analysis of factors that will challenge the bone grafts and substitutes market growth of industry companies

We can help! Our analysts can customize this bone grafts and substitutes market research report to meet your requirements.

Get in touch

1 Executive Summary

  • 1.1 Market overview
    • Executive Summary - Chart on Market Overview
    • Executive Summary - Data Table on Market Overview
    • Executive Summary - Chart on Global Market Characteristics
    • Executive Summary - Chart on Market by Geography
    • Executive Summary - Chart on Market Segmentation by Product
    • Executive Summary - Chart on Market Segmentation by Application
    • Executive Summary - Chart on Incremental Growth
    • Executive Summary - Data Table on Incremental Growth
    • Executive Summary - Chart on Company Market Positioning

2 Market Landscape

  • 2.1 Market ecosystem
    • Parent Market
    • Data Table on - Parent Market
  • 2.2 Market characteristics
    • Market characteristics analysis
  • 2.3 Value chain analysis
    • Value Chain Analysis

3 Market Sizing

  • 3.1 Market definition
    • Offerings of companies included in the market definition
  • 3.2 Market segment analysis
    • Market segments
  • 3.3 Market size 2023
    • 3.4 Market outlook: Forecast for 2023-2028
      • Chart on Global - Market size and forecast 2023-2028 ($ million)
      • Data Table on Global - Market size and forecast 2023-2028 ($ million)
      • Chart on Global Market: Year-over-year growth 2023-2028 (%)
      • Data Table on Global Market: Year-over-year growth 2023-2028 (%)

    4 Historic Market Size

    • 4.1 Global Bone Grafts And Substitutes Market 2018 - 2022
      • Historic Market Size - Data Table on Global Bone Grafts And Substitutes Market 2018 - 2022 ($ million)
    • 4.2 Product segment analysis 2018 - 2022
      • Historic Market Size - Product Segment 2018 - 2022 ($ million)
    • 4.3 Application segment analysis 2018 - 2022
      • Historic Market Size - Application Segment 2018 - 2022 ($ million)
    • 4.4 Geography segment analysis 2018 - 2022
      • Historic Market Size - Geography Segment 2018 - 2022 ($ million)
    • 4.5 Country segment analysis 2018 - 2022
      • Historic Market Size - Country Segment 2018 - 2022 ($ million)

    5 Five Forces Analysis

    • 5.1 Five forces summary
      • Five forces analysis - Comparison between 2023 and 2028
    • 5.2 Bargaining power of buyers
      • Bargaining power of buyers - Impact of key factors 2023 and 2028
    • 5.3 Bargaining power of suppliers
      • Bargaining power of suppliers - Impact of key factors in 2023 and 2028
    • 5.4 Threat of new entrants
      • Threat of new entrants - Impact of key factors in 2023 and 2028
    • 5.5 Threat of substitutes
      • Threat of substitutes - Impact of key factors in 2023 and 2028
    • 5.6 Threat of rivalry
      • Threat of rivalry - Impact of key factors in 2023 and 2028
    • 5.7 Market condition
      • Chart on Market condition - Five forces 2023 and 2028

    6 Market Segmentation by Product

    • 6.1 Market segments
      • Chart on Product - Market share 2023-2028 (%)
      • Data Table on Product - Market share 2023-2028 (%)
    • 6.2 Comparison by Product
      • Chart on Comparison by Product
      • Data Table on Comparison by Product
    • 6.3 Xenografts - Market size and forecast 2023-2028
      • Chart on Xenografts - Market size and forecast 2023-2028 ($ million)
      • Data Table on Xenografts - Market size and forecast 2023-2028 ($ million)
      • Chart on Xenografts - Year-over-year growth 2023-2028 (%)
      • Data Table on Xenografts - Year-over-year growth 2023-2028 (%)
    • 6.4 Allografts - Market size and forecast 2023-2028
      • Chart on Allografts - Market size and forecast 2023-2028 ($ million)
      • Data Table on Allografts - Market size and forecast 2023-2028 ($ million)
      • Chart on Allografts - Year-over-year growth 2023-2028 (%)
      • Data Table on Allografts - Year-over-year growth 2023-2028 (%)
    • 6.5 Synthetic bone grafts - Market size and forecast 2023-2028
      • Chart on Synthetic bone grafts - Market size and forecast 2023-2028 ($ million)
      • Data Table on Synthetic bone grafts - Market size and forecast 2023-2028 ($ million)
      • Chart on Synthetic bone grafts - Year-over-year growth 2023-2028 (%)
      • Data Table on Synthetic bone grafts - Year-over-year growth 2023-2028 (%)
    • 6.6 DBM - Market size and forecast 2023-2028
      • Chart on DBM - Market size and forecast 2023-2028 ($ million)
      • Data Table on DBM - Market size and forecast 2023-2028 ($ million)
      • Chart on DBM - Year-over-year growth 2023-2028 (%)
      • Data Table on DBM - Year-over-year growth 2023-2028 (%)
    • 6.7 Market opportunity by Product
      • Market opportunity by Product ($ million)
      • Data Table on Market opportunity by Product ($ million)

    7 Market Segmentation by Application

    • 7.1 Market segments
      • Chart on Application - Market share 2023-2028 (%)
      • Data Table on Application - Market share 2023-2028 (%)
    • 7.2 Comparison by Application
      • Chart on Comparison by Application
      • Data Table on Comparison by Application
    • 7.3 Spinal fusion - Market size and forecast 2023-2028
      • Chart on Spinal fusion - Market size and forecast 2023-2028 ($ million)
      • Data Table on Spinal fusion - Market size and forecast 2023-2028 ($ million)
      • Chart on Spinal fusion - Year-over-year growth 2023-2028 (%)
      • Data Table on Spinal fusion - Year-over-year growth 2023-2028 (%)
    • 7.4 Trauma - Market size and forecast 2023-2028
      • Chart on Trauma - Market size and forecast 2023-2028 ($ million)
      • Data Table on Trauma - Market size and forecast 2023-2028 ($ million)
      • Chart on Trauma - Year-over-year growth 2023-2028 (%)
      • Data Table on Trauma - Year-over-year growth 2023-2028 (%)
    • 7.5 Craniomaxillofacial - Market size and forecast 2023-2028
      • Chart on Craniomaxillofacial - Market size and forecast 2023-2028 ($ million)
      • Data Table on Craniomaxillofacial - Market size and forecast 2023-2028 ($ million)
      • Chart on Craniomaxillofacial - Year-over-year growth 2023-2028 (%)
      • Data Table on Craniomaxillofacial - Year-over-year growth 2023-2028 (%)
    • 7.6 Joint reconstruction - Market size and forecast 2023-2028
      • Chart on Joint reconstruction - Market size and forecast 2023-2028 ($ million)
      • Data Table on Joint reconstruction - Market size and forecast 2023-2028 ($ million)
      • Chart on Joint reconstruction - Year-over-year growth 2023-2028 (%)
      • Data Table on Joint reconstruction - Year-over-year growth 2023-2028 (%)
    • 7.7 Dental bone grafting - Market size and forecast 2023-2028
      • Chart on Dental bone grafting - Market size and forecast 2023-2028 ($ million)
      • Data Table on Dental bone grafting - Market size and forecast 2023-2028 ($ million)
      • Chart on Dental bone grafting - Year-over-year growth 2023-2028 (%)
      • Data Table on Dental bone grafting - Year-over-year growth 2023-2028 (%)
    • 7.8 Market opportunity by Application
      • Market opportunity by Application ($ million)
      • Data Table on Market opportunity by Application ($ million)

    8 Customer Landscape

    • 8.1 Customer landscape overview
      • Analysis of price sensitivity, lifecycle, customer purchase basket, adoption rates, and purchase criteria

    9 Geographic Landscape

    • 9.1 Geographic segmentation
      • Chart on Market share by geography 2023-2028 (%)
      • Data Table on Market share by geography 2023-2028 (%)
    • 9.2 Geographic comparison
      • Chart on Geographic comparison
      • Data Table on Geographic comparison
    • 9.3 North America - Market size and forecast 2023-2028
      • Chart on North America - Market size and forecast 2023-2028 ($ million)
      • Data Table on North America - Market size and forecast 2023-2028 ($ million)
      • Chart on North America - Year-over-year growth 2023-2028 (%)
      • Data Table on North America - Year-over-year growth 2023-2028 (%)
    • 9.4 Europe - Market size and forecast 2023-2028
      • Chart on Europe - Market size and forecast 2023-2028 ($ million)
      • Data Table on Europe - Market size and forecast 2023-2028 ($ million)
      • Chart on Europe - Year-over-year growth 2023-2028 (%)
      • Data Table on Europe - Year-over-year growth 2023-2028 (%)
    • 9.5 Asia - Market size and forecast 2023-2028
      • Chart on Asia - Market size and forecast 2023-2028 ($ million)
      • Data Table on Asia - Market size and forecast 2023-2028 ($ million)
      • Chart on Asia - Year-over-year growth 2023-2028 (%)
      • Data Table on Asia - Year-over-year growth 2023-2028 (%)
    • 9.6 Rest of World (ROW) - Market size and forecast 2023-2028
      • Chart on Rest of World (ROW) - Market size and forecast 2023-2028 ($ million)
      • Data Table on Rest of World (ROW) - Market size and forecast 2023-2028 ($ million)
      • Chart on Rest of World (ROW) - Year-over-year growth 2023-2028 (%)
      • Data Table on Rest of World (ROW) - Year-over-year growth 2023-2028 (%)
    • 9.7 US - Market size and forecast 2023-2028
      • Chart on US - Market size and forecast 2023-2028 ($ million)
      • Data Table on US - Market size and forecast 2023-2028 ($ million)
      • Chart on US - Year-over-year growth 2023-2028 (%)
      • Data Table on US - Year-over-year growth 2023-2028 (%)
    • 9.8 Germany - Market size and forecast 2023-2028
      • Chart on Germany - Market size and forecast 2023-2028 ($ million)
      • Data Table on Germany - Market size and forecast 2023-2028 ($ million)
      • Chart on Germany - Year-over-year growth 2023-2028 (%)
      • Data Table on Germany - Year-over-year growth 2023-2028 (%)
    • 9.9 UK - Market size and forecast 2023-2028
      • Chart on UK - Market size and forecast 2023-2028 ($ million)
      • Data Table on UK - Market size and forecast 2023-2028 ($ million)
      • Chart on UK - Year-over-year growth 2023-2028 (%)
      • Data Table on UK - Year-over-year growth 2023-2028 (%)
    • 9.10 China - Market size and forecast 2023-2028
      • Chart on China - Market size and forecast 2023-2028 ($ million)
      • Data Table on China - Market size and forecast 2023-2028 ($ million)
      • Chart on China - Year-over-year growth 2023-2028 (%)
      • Data Table on China - Year-over-year growth 2023-2028 (%)
    • 9.11 Japan - Market size and forecast 2023-2028
      • Chart on Japan - Market size and forecast 2023-2028 ($ million)
      • Data Table on Japan - Market size and forecast 2023-2028 ($ million)
      • Chart on Japan - Year-over-year growth 2023-2028 (%)
      • Data Table on Japan - Year-over-year growth 2023-2028 (%)
    • 9.12 Market opportunity by geography
      • Market opportunity by geography ($ million)
      • Data Tables on Market opportunity by geography ($ million)

    10 Drivers, Challenges, and Opportunity/Restraints

    • 10.1 Market drivers
      • 10.2 Market challenges
        • 10.3 Impact of drivers and challenges
          • Impact of drivers and challenges in 2023 and 2028
        • 10.4 Market opportunities/restraints

          11 Competitive Landscape

          • 11.1 Overview
            • 11.2 Competitive Landscape
              • Overview on criticality of inputs and factors of differentiation
            • 11.3 Landscape disruption
              • Overview on factors of disruption
            • 11.4 Industry risks
              • Impact of key risks on business

            12 Competitive Analysis

            • 12.1 Companies profiled
              • Companies covered
            • 12.2 Market positioning of companies
              • Matrix on companies position and classification
            • 12.3 AlloSource
              • AlloSource - Overview
              • AlloSource - Product / Service
              • AlloSource - Key offerings
            • 12.4 Arthrex Inc.
              • Arthrex Inc. - Overview
              • Arthrex Inc. - Product / Service
              • Arthrex Inc. - Key offerings
            • 12.5 Baxter International Inc.
              • Baxter International Inc. - Overview
              • Baxter International Inc. - Business segments
              • Baxter International Inc. - Key news
              • Baxter International Inc. - Key offerings
              • Baxter International Inc. - Segment focus
            • 12.6 Bioventus LLC
              • Bioventus LLC - Overview
              • Bioventus LLC - Business segments
              • Bioventus LLC - Key news
              • Bioventus LLC - Key offerings
              • Bioventus LLC - Segment focus
            • 12.7 Ed. Geistlich Sohne AG
              • Ed. Geistlich Sohne AG - Overview
              • Ed. Geistlich Sohne AG - Product / Service
              • Ed. Geistlich Sohne AG - Key offerings
            • 12.8 Integra Lifesciences Corp.
              • Integra Lifesciences Corp. - Overview
              • Integra Lifesciences Corp. - Business segments
              • Integra Lifesciences Corp. - Key news
              • Integra Lifesciences Corp. - Key offerings
              • Integra Lifesciences Corp. - Segment focus
            • 12.9 Johnson and Johnson Services Inc.
              • Johnson and Johnson Services Inc. - Overview
              • Johnson and Johnson Services Inc. - Business segments
              • Johnson and Johnson Services Inc. - Key news
              • Johnson and Johnson Services Inc. - Key offerings
              • Johnson and Johnson Services Inc. - Segment focus
            • 12.10 Medtronic Plc
              • Medtronic Plc - Overview
              • Medtronic Plc - Business segments
              • Medtronic Plc - Key news
              • Medtronic Plc - Key offerings
              • Medtronic Plc - Segment focus
            • 12.11 MTF Biologics
              • MTF Biologics - Overview
              • MTF Biologics - Product / Service
              • MTF Biologics - Key offerings
            • 12.12 NovaBone Products LLC
              • NovaBone Products LLC - Overview
              • NovaBone Products LLC - Product / Service
              • NovaBone Products LLC - Key offerings
            • 12.13 Nuvasive Inc.
              • Nuvasive Inc. - Overview
              • Nuvasive Inc. - Business segments
              • Nuvasive Inc. - Key news
              • Nuvasive Inc. - Key offerings
              • Nuvasive Inc. - Segment focus
            • 12.14 Orthofix Medical Inc.
              • Orthofix Medical Inc. - Overview
              • Orthofix Medical Inc. - Business segments
              • Orthofix Medical Inc. - Key news
              • Orthofix Medical Inc. - Key offerings
              • Orthofix Medical Inc. - Segment focus
            • 12.15 OST Laboratories
              • OST Laboratories - Overview
              • OST Laboratories - Product / Service
              • OST Laboratories - Key offerings
            • 12.16 Smith and Nephew plc
              • Smith and Nephew plc - Overview
              • Smith and Nephew plc - Business segments
              • Smith and Nephew plc - Key news
              • Smith and Nephew plc - Key offerings
              • Smith and Nephew plc - Segment focus
            • 12.17 Stryker Corp.
              • Stryker Corp. - Overview
              • Stryker Corp. - Business segments
              • Stryker Corp. - Key news
              • Stryker Corp. - Key offerings
              • Stryker Corp. - Segment focus

            13 Appendix

            • 13.1 Scope of the report
              • 13.2 Inclusions and exclusions checklist
                • Inclusions checklist
                • Exclusions checklist
              • 13.3 Currency conversion rates for US$
                • Currency conversion rates for US$
              • 13.4 Research methodology
                • Research methodology
              • 13.5 Data procurement
                • Information sources
              • 13.6 Data validation
                • Data validation
              • 13.7 Validation techniques employed for market sizing
                • Validation techniques employed for market sizing
              • 13.8 Data synthesis
                • Data synthesis
              • 13.9 360 degree market analysis
                • 360 degree market analysis
              • 13.10 List of abbreviations
                • List of abbreviations

              Research Methodology

              Technavio presents a detailed picture of the market by way of study, synthesis, and summation of data from multiple sources. The analysts have presented the various facets of the market with a particular focus on identifying the key industry influencers. The data thus presented is comprehensive, reliable, and the result of extensive research, both primary and secondary.

              INFORMATION SOURCES

              Primary sources

              • Manufacturers and suppliers
              • Channel partners
              • Industry experts
              • Strategic decision makers

              Secondary sources

              • Industry journals and periodicals
              • Government data
              • Financial reports of key industry players
              • Historical data
              • Press releases

              DATA ANALYSIS

              Data Synthesis

              • Collation of data
              • Estimation of key figures
              • Analysis of derived insights

              Data Validation

              • Triangulation with data models
              • Reference against proprietary databases
              • Corroboration with industry experts

              REPORT WRITING

              Qualitative

              • Market drivers
              • Market challenges
              • Market trends
              • Five forces analysis

              Quantitative

              • Market size and forecast
              • Market segmentation
              • Geographical insights
              • Competitive landscape

              Interested in this report?

              Get your sample now to see our research methodology and insights!

              Download Now

              Frequently Asked Questions

              Bone Grafts And Substitutes market growth will increase by $ 1719.4 mn during 2024-2028 .

              The Bone Grafts And Substitutes market is expected to grow at a CAGR of 9.45% during 2024-2028 .

              Bone Grafts And Substitutes market is segmented by Product( Xenografts, Allografts, Synthetic bone grafts, DBM) Application( Spinal fusion, Trauma, Craniomaxillofacial, Joint reconstruction, Dental bone grafting)

              AlloSource, Arthrex Inc., Baxter International Inc., Bioventus LLC, Ed. Geistlich Sohne AG, Institut Straumann AG, Integra Lifesciences Corp., Johnson and Johnson Services Inc., Medtronic Plc, MTF Biologics, NovaBone Products LLC, Nuvasive Inc., Orthofix Medical Inc., OST Laboratories, RTI Surgical Inc., Smith and Nephew plc, Stryker Corp., TBF TISSUE ENGINEERING, Xtant Medical Holdings Inc., Zimmer Biomet Holdings Inc. are a few of the key vendors in the Bone Grafts And Substitutes market.

              North America will register the highest growth rate of 41% among the other regions. Therefore, the Bone Grafts And Substitutes market in North America is expected to garner significant business opportunities for the vendors during the forecast period.

              US, Germany, UK, China, Japan

              • Growing orthopedic conditions and surgical casesEvery year 37.3 million severe accidents occur that require medical attention globally. The total medical costs for fatal and non-fatal accidents are more than $50 billion every year in the US. Fractured bones take a long time to heal. According to Arthritis Foundation is the driving factor this market.
              • degenerative joint disease disorders such as osteoarthritis will affect around 130 million people globally by 2050. Thus is the driving factor this market.
              • bone growth stimulation devices are used to stimulate bone healing. Surgery is required to treat orthopedic conditions. Many patients that require surgery opt for ambulatory surgical centers (ASCs) is the driving factor this market.
              • which are day surgical centers. Such healthcare infrastructure can help to save costs associated with a hospital stay. However is the driving factor this market.
              • a few patients opt for inpatient departments is the driving factor this market.
              • depending on the type of orthopedic condition. Other patients prefer to undergo constant observation by healthcare providers for fast recovery. Fractures and dislocation of the lower extremity is the driving factor this market.
              • total and partial hip replacements and spinal fusions are some of the major orthopedic conditions that require the use of bone grafts and substitutes. Bone growth stimulation devices are used for spinal fusion following cervical and lumbar spine surgeries. The devices deliver low-intensity electrical signals to stimulate the natural bone healing process. Various companies are offering bone growth stimulation devices. For instance is the driving factor this market.
              • Orthofix Medical Inc. developed Physio-Stim for hip fractures. The device is an external device used for the treatment of nonunion fractures. Many companies are developing external bone growth stimulation devices due to the increasing number of hip replacement surgeries. Therefore is the driving factor this market.
              • the increasing prevalence of injury and the wide range of products offered by vendors is expected to drive the global bone grafts and substitutes market during the forecast period. is the driving factor this market.

              The Bone Grafts And Substitutes market vendors should focus on grabbing business opportunities from the Xenografts segment as it accounted for the largest market share in the base year.