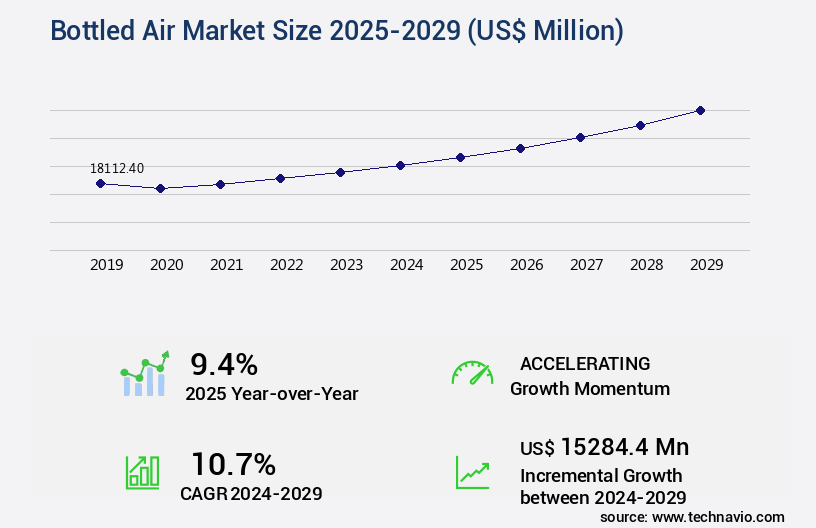
Bottled Air Market Size 2025-2029
The bottled air market size is valued to increase by USD 15.28 billion, at a CAGR of 10.7% from 2024 to 2029. Expanding tourism and leisure industries will drive the bottled air market.
Major Market Trends & Insights
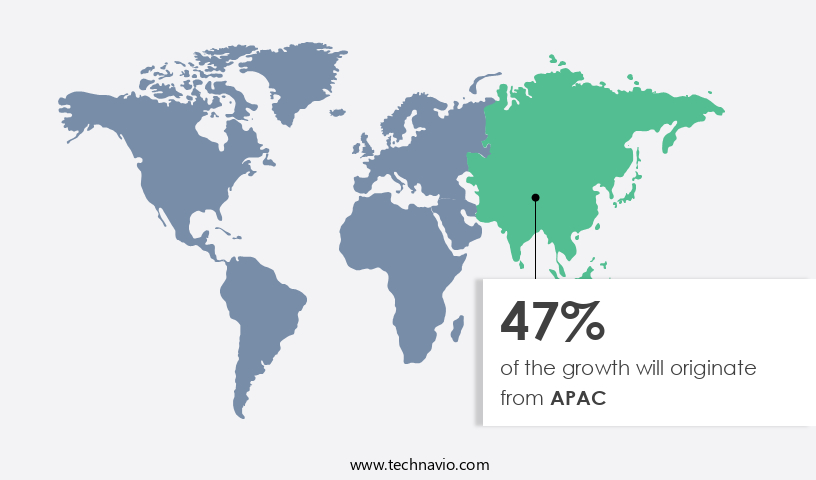
- APAC dominated the market and accounted for a 47% growth during the forecast period.
- By Type - Nitrogen segment was valued at USD 7.18 billion in 2023
- By Application - Pharmaceuticals or healthcare segment accounted for the largest market revenue share in 2023
Market Size & Forecast
- Market Opportunities: USD 111.94 million
- Market Future Opportunities: USD 15284.40 million
- CAGR from 2024 to 2029 : 10.7%
Market Summary
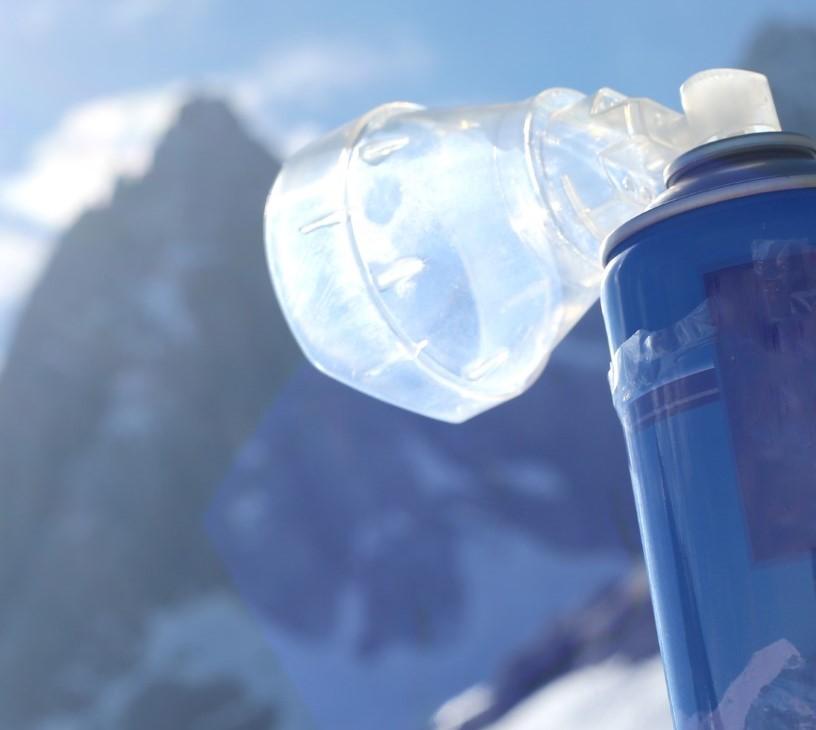
- The market has experienced significant growth, with global sales reaching an estimated USD50 million in 2020. This expansion is driven by the expanding tourism and leisure industries, where consumers seek unique experiences and solutions to combat air pollution and allergens. Subscription-based models have emerged, offering regular deliveries of bottled air to consumers. However, the environmental impact of bottling and transporting air remains a challenge. Despite this, the market's future direction remains promising, as technological advancements continue to improve the efficiency and sustainability of production and distribution processes.
- The bottled air industry's potential lies in its ability to cater to the growing demand for clean air solutions, particularly in densely populated urban areas and industries with high air pollution levels. As the market matures, it will likely face increased competition and regulatory scrutiny, necessitating strategic partnerships and innovative solutions to maintain its growth trajectory.
What will be the Size of the Bottled Air Market during the forecast period?
Get Key Insights on Market Forecast (PDF) Request Free Sample
How is the Bottled Air Market Segmented ?
The bottled air industry research report provides comprehensive data (region-wise segment analysis), with forecasts and estimates in "USD million" for the period 2025-2029, as well as historical data from 2019-2023 for the following segments.
- Type
- Nitrogen
- Oxygen
- Carbon-di-oxide
- Helium
- Others
- Application
- Pharmaceuticals or healthcare
- Food and beverages
- Chemical
- Others
- Packaging
- Aluminum cans
- Plastic bottles
- Glass bottles
- Custom packaged solutions
- Geography
- North America
- US
- Canada
- Europe
- France
- Germany
- UK
- APAC
- Australia
- China
- India
- Japan
- South Korea
- Rest of World (ROW)
- North America
By Type Insights
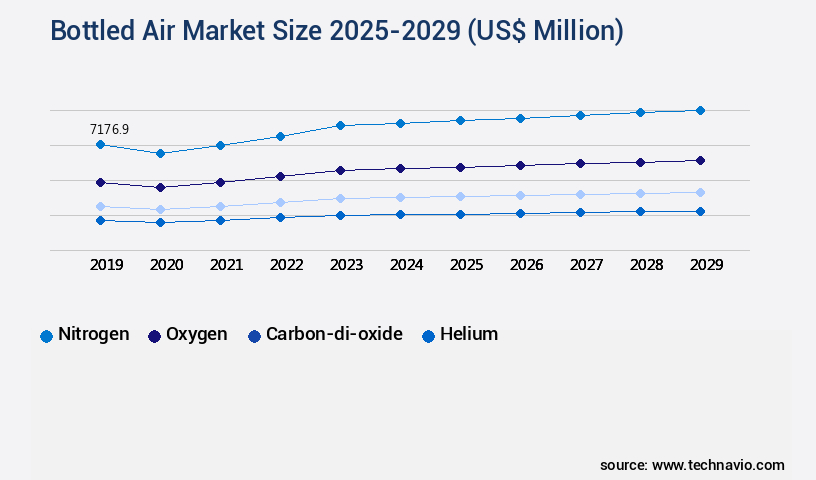
The nitrogen segment is estimated to witness significant growth during the forecast period.
In the dynamic and expanding the market, nitrogen plays a pivotal role, accounting for a significant portion of various product formulations. With its colorless, odorless nature, nitrogen's inert properties make it an indispensable element in numerous applications. In pharmaceutical packaging, nitrogen ensures product stability and integrity by preventing oxidation and degradation, extending shelf life and preserving efficacy. The food and beverage sector also heavily relies on nitrogen, particularly in modified atmosphere packaging (MAP), where it maintains optimal gas composition and controls humidity to enhance food freshness and prolong shelf life. The bottling process involves intricate systems, such as air compressor efficiency, microbial contamination control, humidity control systems, and gas composition analysis, ensuring the highest air purity.
Pressure regulation valves, air filtration systems, and particle size distribution analysis are crucial components in maintaining optimal oxygen concentration levels and eliminating contaminants. The environmental impact assessment, supply chain logistics, and recycling processes are continuously evolving, with a focus on waste reduction strategies and energy consumption metrics. Quality control protocols, including air purification technology, pressure regulation, and leak detection methods, are integral to maintaining product consistency and safety. The distribution network optimization and canister design are essential aspects of the market, with an emphasis on product traceability systems and aerosol dispensing systems. The industry's ongoing advancements in air quality monitoring, container sterilization, and quality assurance testing, such as gas chromatography, further solidify its role in various industries.
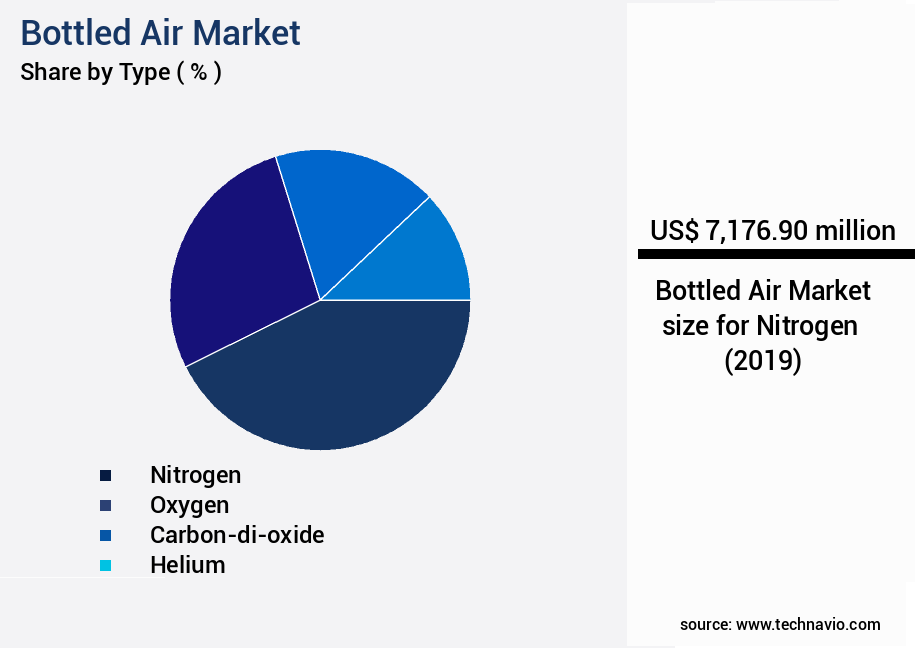
The Nitrogen segment was valued at USD 7.18 billion in 2019 and showed a gradual increase during the forecast period.
Regional Analysis
APAC is estimated to contribute 47% to the growth of the global market during the forecast period.Technavio's analysts have elaborately explained the regional trends and drivers that shape the market during the forecast period.
See How Bottled Air Market Demand is Rising in APAC Request Free Sample
The Asia-Pacific (APAC) region is experiencing a notable expansion in The market, fueled by a confluence of economic, industrial, and environmental factors. With a burgeoning population and rapid urbanization, countries such as China, India, Japan, and South Korea are witnessing substantial demand for compressed air solutions, including bottled air. This demand is particularly pronounced in densely populated urban areas, where concerns over air pollution are driving the preference for cleaner alternatives. Beyond industrial and residential applications, the healthcare sector in APAC is a significant contributor to bottled air demand. The region's expanding healthcare infrastructure, coupled with increasing awareness of respiratory health issues, is propelling the adoption of medical gases and compressed air solutions.
These applications encompass pharmaceutical packaging and respiratory therapies, underscoring the market's diverse scope and potential for growth. The APAC the market is poised to capitalize on these trends, with market research firms projecting robust expansion in the coming years.
Market Dynamics
Our researchers analyzed the data with 2024 as the base year, along with the key drivers, trends, and challenges. A holistic analysis of drivers will help companies refine their marketing strategies to gain a competitive advantage.
The market is a niche industry that caters to consumers seeking portable solutions for ensuring high-quality, breathable air. This market encompasses the production, packaging, and distribution of air in containers using various technologies, including portable air filtration devices. Measuring oxygen levels in air is a critical aspect of the bottled air industry, ensuring the delivered air meets specifications and maintains optimal purity. The impact of packaging on air quality is another essential consideration, with regulations in place to minimize contamination during the bottling process. Advanced air purification methods, such as HEPA filtration and activated carbon adsorption, are employed to remove impurities and maintain air quality throughout the supply chain. Different types of air quality monitoring sensors are used to assess the effectiveness of these methods and ensure regulatory compliance. Testing for microbial contamination in canned air is a crucial step in the production process to maintain consumer safety and trust. Analysis of various packaging materials, such as PET and aluminum, is essential to optimize energy usage in the air bottling lines and reduce the carbon footprint of bottled air. Designing efficient air bottling lines and evaluating consumer perception of air quality are essential to remain competitive in the market. Improving supply chain sustainability and assessing the environmental impact of compressed air are also becoming increasingly important considerations for companies in the bottled air industry. Methodologies for reducing waste in air packaging, such as using recycled materials and optimizing container sizes, are being explored to minimize the environmental impact of this niche market. Overall, the market requires a multidisciplinary approach, combining expertise in air filtration, packaging, and regulatory compliance to deliver high-quality, sustainable air solutions to consumers.
What are the key market drivers leading to the rise in the adoption of Bottled Air Industry?
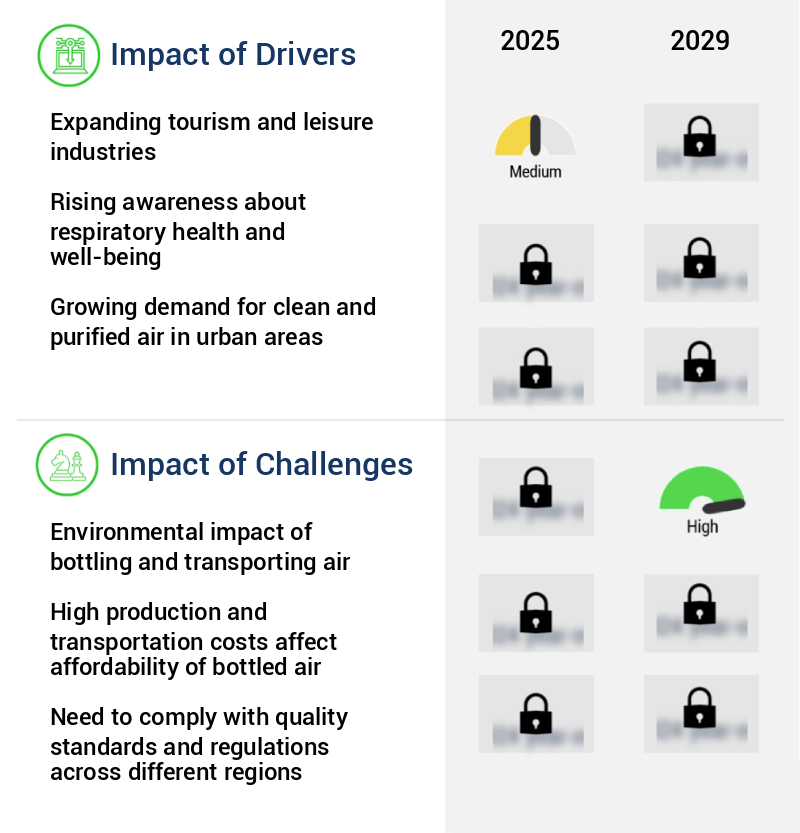
- The expansion of tourism and leisure industries serves as the primary catalyst for market growth. These sectors, which include travel, hospitality, and recreation, significantly contribute to economic development and job creation, making them crucial drivers for market progression.
- The market is experiencing a surge in demand, particularly in the expanding tourism and leisure industries. Bottled air, or compressed air products, play a crucial role in various recreational activities and tourism destinations worldwide. Outdoor pursuits such as scuba diving, snorkeling, mountain climbing, and skiing necessitate clean and breathable air for tourist safety and enjoyment. Moreover, indoor leisure facilities, including amusement parks, gaming arcades, and recreational centers, rely on bottled air for maintaining optimal air quality and ventilation systems.
- The market's growth can be attributed to the increasing popularity of these industries and the essential role bottled air plays in ensuring safety and comfort for tourists and visitors. With the number of tourists worldwide projected to reach 1.8 billion by 2030, the demand for bottled air is poised to grow significantly. Bottled air's versatility and importance in various sectors make it an indispensable commodity in today's market.
What are the market trends shaping the Bottled Air Industry?
- Subscription models are gaining popularity in the market for the regular delivery of bottled air to consumers. This trend is mandatory for businesses seeking to cater to the evolving needs of consumers.
- The market is experiencing a surge in demand for subscription-based models, with companies like Vitality Air leading the way. These services offer customers scheduled deliveries of bottled air, addressing the need for consistent air supply without the inconvenience of manual reordering. Vitality Air, for instance, provides a subscription service for canned clean air from various worldwide locations. This model caters to the increasing demand for good quality air in urban environments, promoting health and wellness benefits.
- The convenience of subscription-based bottled air delivery is a notable trend, reflecting a robust market growth. Companies are capitalizing on this trend to cater to the evolving needs of consumers.
What challenges does the Bottled Air Industry face during its growth?
- The environmental consequences of bottling and transporting air, a resource that is naturally abundant and intangible, pose a significant challenge to the growth of the industry.
- The market has seen significant growth and diversification in recent years, expanding beyond its traditional applications in personal use and emergency situations. This market's evolution is evident in its increasing presence in various sectors, including healthcare, hospitality, and industrial processes. However, the environmental impact of bottled air production and transportation is a pressing concern. The process involves energy-intensive activities like air purification, compression, and packaging, contributing to greenhouse gas emissions and environmental pollution. Furthermore, the use of materials for manufacturing canisters and cylinders adds to resource depletion and habitat destruction.
- Transportation of bottled air necessitates vehicles, leading to carbon dioxide emissions and other pollutants. The logistics of long-distance transport exacerbate these issues, with implications for fuel consumption, road congestion, and noise pollution. Despite these challenges, the market continues to expand, underscoring the demand for clean air solutions.
Exclusive Technavio Analysis on Customer Landscape
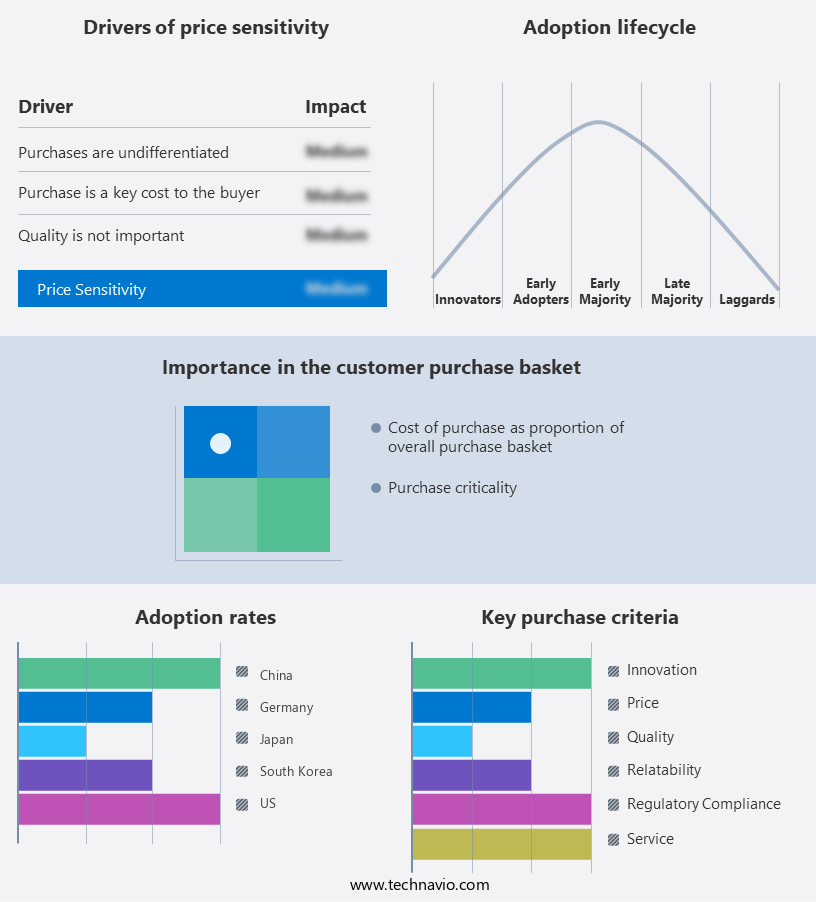
The bottled air market forecasting report includes the adoption lifecycle of the market, covering from the innovator's stage to the laggard's stage. It focuses on adoption rates in different regions based on penetration. Furthermore, the bottled air market report also includes key purchase criteria and drivers of price sensitivity to help companies evaluate and develop their market growth analysis strategies.
Customer Landscape of Bottled Air Industry
Competitive Landscape
Companies are implementing various strategies, such as strategic alliances, bottled air market forecast, partnerships, mergers and acquisitions, geographical expansion, and product/service launches, to enhance their presence in the industry.
Air Liquide SA - A subsidiary of the company, Airgas, Inc., provides medical-grade bottled air solutions, including USP Medical Grade Air, housed in high-pressure steel cylinders. This product adheres to the United States Pharmacopeia standards, ensuring quality and safety for various medical applications.
The industry research and growth report includes detailed analyses of the competitive landscape of the market and information about key companies, including:
- Air Liquide SA
- Air Products and Chemicals Inc.
- AIR WATER INC.
- Boost Oxygen LLC.
- Gulfcryo
- Linde Plc
- Messer SE and Co. KGaA
- Mitsubishi Corp.
- Nikkiso Co. Ltd.
- Nucor Corp.
- RealGaz
- Sulzer Ltd.
- Vitality Air
- Yingde Gas Group Co. Ltd.
Qualitative and quantitative analysis of companies has been conducted to help clients understand the wider business environment as well as the strengths and weaknesses of key industry players. Data is qualitatively analyzed to categorize companies as pure play, category-focused, industry-focused, and diversified; it is quantitatively analyzed to categorize companies as dominant, leading, strong, tentative, and weak.
Recent Development and News in Bottled Air Market
- In January 2024, Pure Water and Air, a leading bottled water company, announced the launch of its new product line, "PureBreeze," which includes bottled air infused with essential oils and minerals. The company's press release stated that this innovative offering aims to cater to the growing demand for healthier lifestyle choices and improved air quality (Pure Water and Air, 2024).
- In March 2024, Air Products and Chemicals, a global leader in industrial gases, entered into a strategic partnership with Green Bottle, a start-up specializing in biodegradable plastic bottles for the market. This collaboration aimed to reduce the environmental impact of bottled air production and distribution (Air Products and Chemicals, 2024).
- In May 2024, Air Liquide, a major player in the industrial gases sector, acquired a minority stake in OxyFresh, a bottled air company focusing on oxygen-enriched air products. The investment was reported to be €50 million, and the partnership aimed to expand OxyFresh's product offerings and global reach (Air Liquide, 2024).
- In April 2025, the European Union approved new regulations on bottled air labeling and quality standards. The new rules require companies to disclose the source and composition of the air, as well as the presence of any additives or contaminants (European Commission, 2025). This regulatory development aims to ensure transparency and consumer protection in the market.
Dive into Technavio's robust research methodology, blending expert interviews, extensive data synthesis, and validated models for unparalleled Bottled Air Market insights. See full methodology.
|
Market Scope |
|
|
Report Coverage |
Details |
|
Page number |
217 |
|
Base year |
2024 |
|
Historic period |
2019-2023 |
|
Forecast period |
2025-2029 |
|
Growth momentum & CAGR |
Accelerate at a CAGR of 10.7% |
|
Market growth 2025-2029 |
USD 15284.4 million |
|
Market structure |
Concentrated |
|
YoY growth 2024-2025(%) |
9.4 |
|
Key countries |
China, US, Canada, Japan, South Korea, Germany, India, UK, France, and Australia |
|
Competitive landscape |
Leading Companies, Market Positioning of Companies, Competitive Strategies, and Industry Risks |
Research Analyst Overview
- The market continues to evolve, driven by increasing demand for high-quality, clean air across various sectors. Air compressor efficiency plays a crucial role in minimizing energy consumption and reducing operational costs. Microbial contamination is a significant concern, necessitating rigorous air purity testing and container sterilization. Bottling line efficiency and humidity control systems ensure consistent product quality and shelf life extension. Gas composition analysis, particle size distribution, and pressure regulation valves are essential components of air filtration systems, ensuring optimal air quality. Environmental impact assessments and recycling processes are becoming increasingly important in the industry.
- Carbon dioxide removal and air filtration systems are key technologies for producing beverage-grade air. Energy consumption metrics and quality control protocols are essential for optimizing production and distribution network efficiency. Leak detection methods and air purification technology are critical for maintaining air quality and extending product shelf life. One example of market dynamics at play is a leading bottled air supplier implementing filling line optimization and oxygen concentration level monitoring, resulting in a 15% increase in production capacity and a 10% reduction in waste. Industry growth is expected to reach double-digit percentages in the coming years, driven by expanding applications in healthcare, food and beverage, and industrial sectors.
- Packaging materials, product traceability systems, aerosol dispensing systems, canister design, and waste reduction strategies are among the ongoing areas of innovation in the market. Air quality monitoring and regulatory compliance are essential for maintaining customer trust and market competitiveness.
What are the Key Data Covered in this Bottled Air Market Research and Growth Report?
-
What is the expected growth of the Bottled Air Market between 2025 and 2029?
-
USD 15.28 billion, at a CAGR of 10.7%
-
-
What segmentation does the market report cover?
-
The report is segmented by Type (Nitrogen, Oxygen, Carbon-di-oxide, Helium, and Others), Application (Pharmaceuticals or healthcare, Food and beverages, Chemical, and Others), Packaging (Aluminum cans, Plastic bottles, Glass bottles, and Custom packaged solutions), and Geography (APAC, North America, Europe, Middle East and Africa, and South America)
-
-
Which regions are analyzed in the report?
-
APAC, North America, Europe, Middle East and Africa, and South America
-
-
What are the key growth drivers and market challenges?
-
Expanding tourism and leisure industries, Environmental impact of bottling and transporting air
-
-
Who are the major players in the Bottled Air Market?
-
Air Liquide SA, Air Products and Chemicals Inc., AIR WATER INC., Boost Oxygen LLC., Gulfcryo, Linde Plc, Messer SE and Co. KGaA, Mitsubishi Corp., Nikkiso Co. Ltd., Nucor Corp., RealGaz, Sulzer Ltd., Vitality Air, and Yingde Gas Group Co. Ltd.
-
Market Research Insights
- The market for bottled air, also known as inert gas packaging, is a continuously evolving industry that caters to various sectors requiring pure, clean, and inert gases. Two significant data points highlight the market's growth and dynamics. First, the global inert gas packaging market is projected to expand at a steady rate, with industry analysts estimating a growth of around 4% annually. Second, a notable example of market activity comes from the semiconductor industry, where the adoption of inert gas packaging in production processes has led to a substantial increase in product yield, resulting in significant cost savings for manufacturers.
- This trend underscores the importance of inert gas packaging in ensuring product sterility assurance, contamination control, and quality control checks in various industries. Additionally, the industry focuses on energy efficiency improvements, waste management systems, and production line automation to enhance sustainability and reduce costs. Environmental sustainability and consumer perception are also crucial factors, with an increasing emphasis on data analysis techniques, supply chain transparency, and product lifecycle assessment.
We can help! Our analysts can customize this bottled air market research report to meet your requirements.
 RIA -
RIA - 
