Bowling Centers Market Analysis, Size, and Forecast 2026-2030: North America (US, Canada, and Mexico), Europe (Germany, UK, and France), APAC (Japan, China, and Australia), South America (Brazil and Argentina), Middle East and Africa (UAE, Saudi Arabia, and South Africa), and Rest of World (ROW)

Bowling Centers Market Analysis, Size, and Forecast 2026-2030:
North America (US, Canada, and Mexico), Europe (Germany, UK, and France), APAC (Japan, China, and Australia), South America (Brazil and Argentina), Middle East and Africa (UAE, Saudi Arabia, and South Africa), and Rest of World (ROW)

Published: Apr 2026 284 Pages SKU: IRTNTR72674

Market Overview at a Glance

$3.58 B
Market Opportunity
4.6%
CAGR 2025 - 2030
51.7%
North America Growth
$6.47 B
Synthetic lane segment 2024

Bowling Centers Market Size 2026-2030

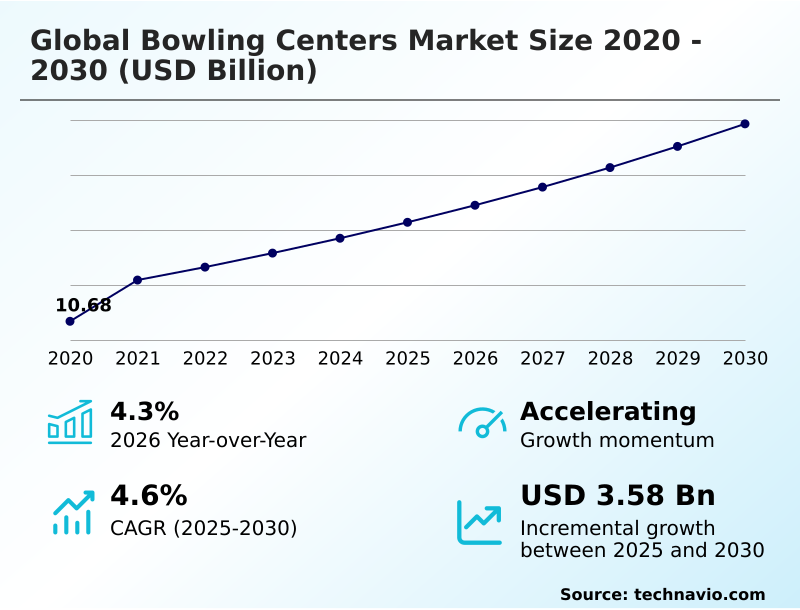
The bowling centers market size is valued to increase by USD 3.58 billion, at a CAGR of 4.6% from 2025 to 2030. Strategic diversification into multi modal entertainment complexes will drive the bowling centers market.

Major Market Trends & Insights

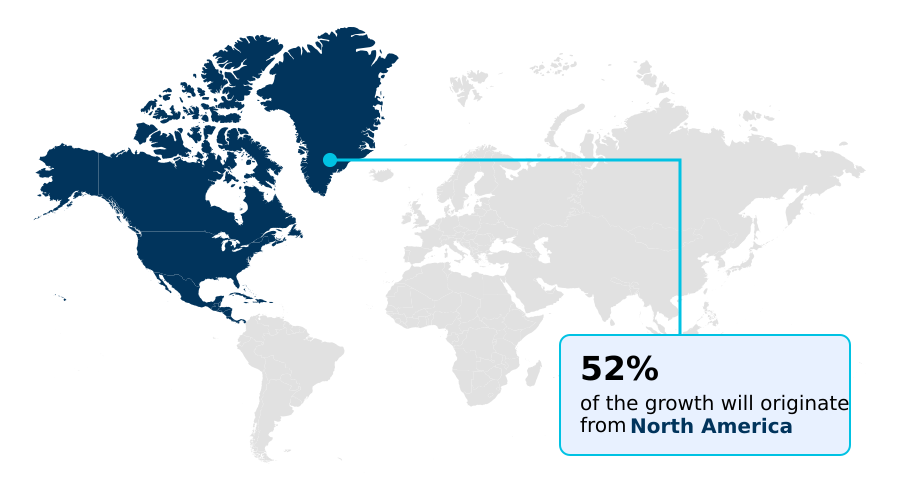
  • North America dominated the market and accounted for a 51.7% growth during the forecast period.
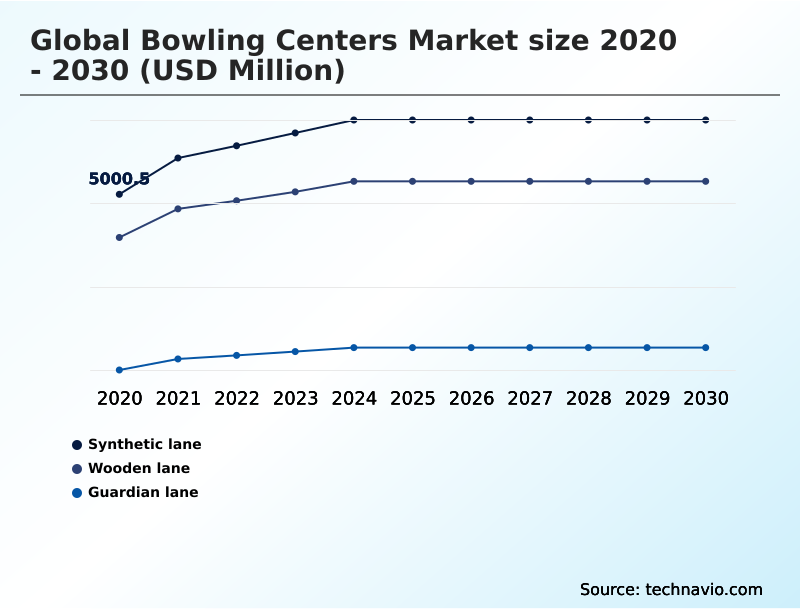
  • By Material - Synthetic lane segment was valued at USD 6.47 billion in 2024
  • By Type - Shopping malls segment accounted for the largest market revenue share in 2024

Market Size & Forecast

  • Market Opportunities: USD 7.17 billion
  • Market Future Opportunities: USD 3.58 billion
  • CAGR from 2025 to 2030 : 4.6%

Market Summary

  • The bowling centers market is undergoing a transformative shift, evolving from traditional sports facilities into sophisticated social entertainment hubs. This evolution is driven by the widespread adoption of the family entertainment center (FEC) model and the rise of competitive socializing, which broadens the market's appeal beyond league bowlers to corporate clients and casual social groups.
  • A key trend is the gamification of lane experience through technologies like augmented reality lane projections and interactive projection mapping, creating an immersive digital hybrid activity that resonates with younger, tech-savvy demographics. This digital convergence extends to operational aspects, with cloud-based scoring systems and mobile ordering systems enhancing the guest journey.
  • For instance, a facility can optimize its high-margin food and beverage program by analyzing traffic data from its booking platform, aligning staffing and inventory with peak demand for corporate hospitality events. However, operators face challenges from escalating real estate costs and competition from high-fidelity home gaming systems.
  • Success hinges on delivering a unique out-of-home entertainment experience by blending sport with high-quality hospitality and cutting-edge technology, such as smart ball systems and biometric sensors, to foster a data-driven approach to bowling.

What will be the Size of the Bowling Centers Market during the forecast period?

Get Key Insights on Market Forecast (PDF) Request Free Sample

How is the Bowling Centers Market Segmented?

The bowling centers industry research report provides comprehensive data (region-wise segment analysis), with forecasts and estimates in "USD million" for the period 2026-2030, as well as historical data from 2020-2024 for the following segments.

  • Material
    • Synthetic lane
    • Wooden lane
    • Guardian lane
  • Type
    • Shopping malls
    • Theme parks
  • End-user
    • Above 18 years
    • Below 18 years
  • Geography
    • North America
      • US
      • Canada
      • Mexico
    • Europe
      • Germany
      • UK
      • France
    • APAC
      • Japan
      • China
      • Australia
    • South America
      • Brazil
      • Argentina
    • Middle East and Africa
      • UAE
      • Saudi Arabia
      • South Africa
    • Rest of World (ROW)

By Material Insights

The synthetic lane segment is estimated to witness significant growth during the forecast period.

Synthetic lane surfaces dominate the global bowling centers market, valued for their exceptional durability and low maintenance. Constructed from materials like high-pressure phenolic laminates, these lanes offer consistent performance crucial for both competitive and recreational play.

Their resilience allows for the seamless integration of modern technologies that drive edutainment and gamification elements, such as glow effects for cosmic bowling sessions.

These surfaces are a key component of a modernized facility, working in tandem with automated pinsetters, electronic scoring systems, and efficient ball return mechanisms. For operators, the long-term cost benefits are significant, as they eliminate the need for periodic resurfacing.

The adoption of these lanes has shown to reduce maintenance downtime by over 70% compared to traditional wood, ensuring higher throughput and profitability in the competitive out-of-home entertainment landscape.

Request Free Sample

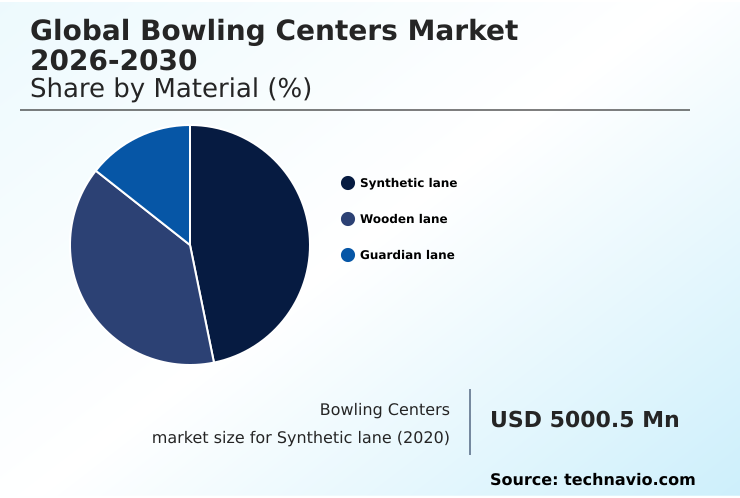
The Synthetic lane segment was valued at USD 6.47 billion in 2024 and showed a gradual increase during the forecast period.

Request Free Sample

Regional Analysis

North America is estimated to contribute 51.7% to the growth of the global market during the forecast period.Technavio’s analysts have elaborately explained the regional trends and drivers that shape the market during the forecast period.

See How Bowling Centers Market Demand is Rising in North America Request Free Sample

The geographic landscape is led by North America, which accounts for over 51% of the market's incremental growth, driven by a mature market focused on holistic guest experiences and the eatertainment concept.

European centers are rapidly adopting sustainable technologies like high-efficiency LED lighting, while APAC is the fastest-growing region, integrating bowling into massive retail-tainment complexes. In the Middle East, luxury is paramount, with venues offering premium high-end gastronomy and ancillary amusements.

This global push towards enriched, tech-driven experiences for group-based socializing is supported by systems using high-speed tracking cameras, biometric sensors, and the BES X scoring ecosystem.

The integrated artificial intelligence engine in these systems can enhance player engagement by 20%, showing the value of tech investment.

Market Dynamics

Our researchers analyzed the data with 2025 as the base year, along with the key drivers, trends, and challenges. A holistic analysis of drivers will help companies refine their marketing strategies to gain a competitive advantage.

  • Achieving superior bowling center operational efficiency is a primary focus for operators navigating a competitive landscape. This involves integrating bowling center technology services to streamline everything from lane management to procurement of essential bowling equipment. The most successful venues have moved beyond simple lane rentals, curating immersive digital entertainment experiences and establishing robust premium food and beverage programs.
  • This strategy is central to creating a model based on integrated hospitality and competitive play, which significantly increases ancillary revenue streams. Revenue diversification in bowling centers is further achieved by designing multi-functional event spaces perfect for hosting lucrative corporate team building events.
  • Venues that effectively combine social connectivity and digital experiences report guest dwell times that are, on average, double those of traditional facilities. This is driven by gamified sessions for tech-savvy youth and dedicated youth development programs in bowling that build long-term loyalty.
  • Strategic facility design, focused on optimizing square footage with social zones and creating high-throughput operational models, is critical, especially when facing competition from high-yield retail and residential developers.
  • Ultimately, success relies on a blend of data-driven guest engagement and retention, the adoption of sustainable infrastructure for bowling centers, and the development of small-footprint boutique models with diverse ancillary revenue streams for bowling to thrive despite the challenges of procuring specialized machinery for bowling alleys.

What are the key market drivers leading to the rise in the adoption of Bowling Centers Industry?

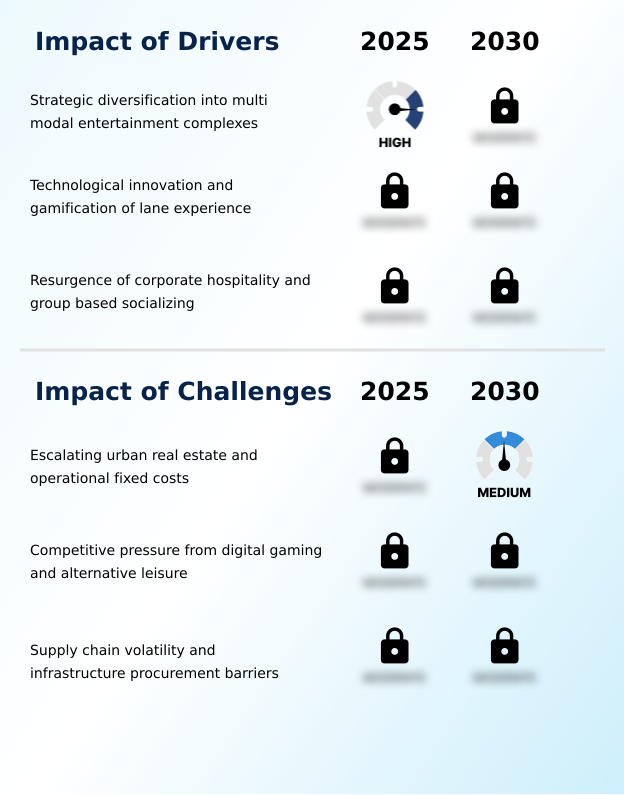
  • Strategic diversification into multimodal entertainment complexes serves as a key driver, expanding the appeal of bowling centers beyond traditional sport.

  • A primary driver is the adoption of the family entertainment center (FEC) model, which positions venues as social entertainment hubs and supports the retail-tainment trend. This strategy expands appeal to include corporate hospitality and other multi-modal entertainment complexes.
  • The gamification of lane experience is another key catalyst, supported by technology like string pinsetter technology and cloud-based scoring systems. These systems, combined with high-efficiency LED lighting, reduce operational costs significantly.
  • The transition from traditional wooden lanes to modern surfaces, sometimes using guardian lane overlays, is accelerating. In fact, string pinsetters can lower energy consumption by up to 60%, a crucial metric for profitability.
  • This strategic focus is often championed by executives, including the Head of Media, to enhance brand visibility.

What are the market trends shaping the Bowling Centers Industry?

  • The proliferation of boutique and social entertainment center hybrid models marks a defining market trend. This evolution transforms traditional alleys into upscale social hubs that prioritize high-end guest experiences.

  • The market is defined by a transition to upscale boutique venues and lounge-style seating, catering to demand for aesthetic experiences. This digital convergence is creating multi-sensory experience options for patrons seeking experiential leisure activities. The adoption of advanced technology is a key part of this trend, with innovations like the SmartBowler 360 and the BES NV scoring system reshaping gameplay.
  • Interactive projection mapping transforms the lane into a dynamic digital canvas, boosting engagement among younger demographics by over 25%. Further integration of smart ball systems allows for detailed performance tracking. The focus on high-quality Pro Lane series lanes and strategic brand consolidation reflects a market-wide push for premium offerings, a priority often discussed at the Group CFO level.

What challenges does the Bowling Centers Industry face during its growth?

  • Escalating urban real estate costs and high operational fixed expenses present a significant challenge to the profitability and expansion of bowling centers.

  • Key challenges include intense competition from e-sports lounges and high-fidelity home gaming systems, forcing operators to invest in unique boutique bowling environments to stay relevant. These multi-attraction venues face escalating real estate costs, which have risen by over 20% in some urban centers.
  • Supply chain volatility also affects the procurement of materials like phenolic laminates for lanes and components for high-performance bowling balls. The maintenance of legacy infrastructure, requiring specialized oiling for wooden lanes made of hard rock maple and southern yellow pine, adds to operational strain.
  • The market for reactive resin bowling balls and high-pressure phenolic laminates is controlled by a few suppliers, a challenge addressed by some through a unified management partnership to improve purchasing power, a strategy endorsed by bodies like the Professional Bowlers Association.

Exclusive Technavio Analysis on Customer Landscape

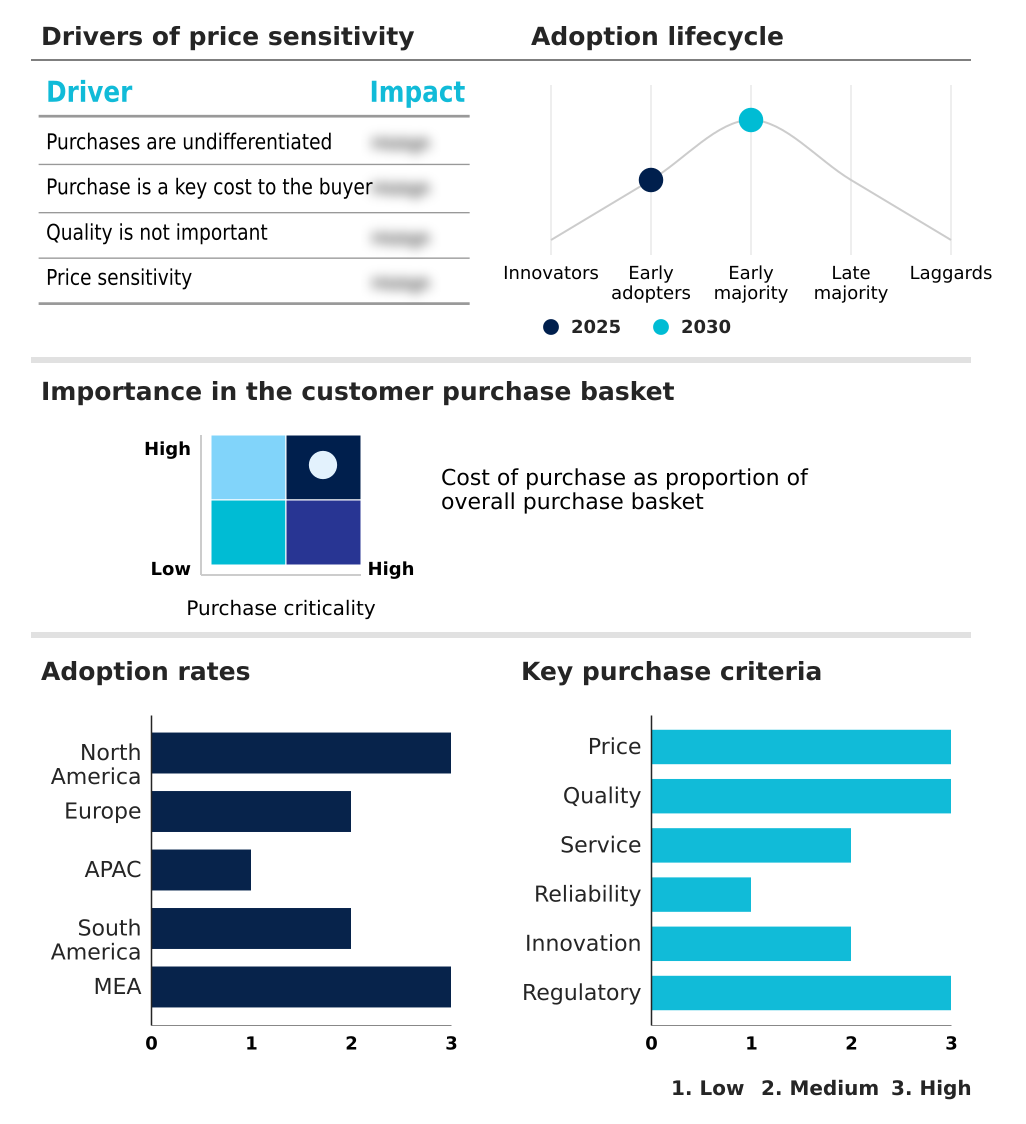
The bowling centers market forecasting report includes the adoption lifecycle of the market, covering from the innovator’s stage to the laggard’s stage. It focuses on adoption rates in different regions based on penetration. Furthermore, the bowling centers market report also includes key purchase criteria and drivers of price sensitivity to help companies evaluate and develop their market growth analysis strategies.

Customer Landscape of Bowling Centers Industry

Competitive Landscape

Companies are implementing various strategies, such as strategic alliances, bowling centers market forecast, partnerships, mergers and acquisitions, geographical expansion, and product/service launches, to enhance their presence in the industry.

All Star Lanes Ltd - Delivers comprehensive bowling equipment and systems, from advanced scoring to innovative mini-bowling products, driving facility modernization and elevating the guest experience.

The industry research and growth report includes detailed analyses of the competitive landscape of the market and information about key companies, including:

  • All Star Lanes Ltd
  • Bowling Center Esslingen
  • Brunswick Bowling Products LLC
  • Dave and Busters Entertainment
  • Hollywood Bowl Group plc
  • Main Event Entertainment Inc.
  • Ozone Bowling Centers
  • QubicaAMF Europe spa
  • REVS Bowling and Entertainment
  • Round1 Entertainment Inc.
  • Smaaash Entertainment Pvt. Ltd.
  • South Point Hotel and Casino
  • Steltronic SRL
  • Strike N Spare Lanes
  • Strikes and Spares Entertaiment
  • Switch Bowling Dubai
  • TEEG Australia Pty Ltd.
  • Tenpin Entertainment Ltd.
  • Tsogo Sun
  • Twelve Strike

Qualitative and quantitative analysis of companies has been conducted to help clients understand the wider business environment as well as the strengths and weaknesses of key industry players. Data is qualitatively analyzed to categorize companies as pure play, category-focused, industry-focused, and diversified; it is quantitatively analyzed to categorize companies as dominant, leading, strong, tentative, and weak.

Recent Development and News in Bowling centers market

  • In March 2025, QubicaAMF unveiled its latest BES X scoring ecosystem, featuring an integrated AI engine that provides personalized coaching tips and dynamic game suggestions based on player skill.
  • In February 2025, Lucky Strike Entertainment, a subsidiary of Bowlero Corporation, announced an aggressive brand consolidation and expansion initiative aimed at reaching 200 premium locations by the end of 2026.
  • In January 2025, Brunswick Bowling Products streamlined its international operations by consolidating six of its major brands under a unified management partnership in Japan to optimize its supply chain and product availability.
  • In April 2025, Brunswick Bowling Products introduced a new high-density wear layer for its Pro Lane series of synthetic lanes, designed to withstand the increased friction from modern high-performance reactive resin bowling balls.

Dive into Technavio’s robust research methodology, blending expert interviews, extensive data synthesis, and validated models for unparalleled Bowling Centers Market insights. See full methodology.

Market Scope
Page number 284
Base year 2025
Historic period 2020-2024
Forecast period 2026-2030
Growth momentum & CAGR Accelerate at a CAGR of 4.6%
Market growth 2026-2030 USD 3579.5 million
Market structure Fragmented
YoY growth 2025-2026(%) 4.3%
Key countries US, Canada, Mexico, Germany, UK, France, The Netherlands, Sweden, Italy, Japan, China, Australia, South Korea, India, Indonesia, Brazil, Argentina, Chile, UAE, Saudi Arabia, South Africa, Egypt and Nigeria
Competitive landscape Leading Companies, Market Positioning of Companies, Competitive Strategies, and Industry Risks

Request Free Sample

Research Analyst Overview

  • The bowling centers market is defined by a rapid technological evolution, compelling operators to modernize infrastructure with synthetic lane surfaces, string pinsetter technology, and augmented reality lane projections. Boardroom decisions now center on capital investment in systems like cloud-based scoring systems and automated pinsetters to enhance the guest experience and improve efficiency.
  • The integration of string pinsetters alone has demonstrated up to a 60% reduction in energy consumption, a critical factor for budgeting. Facilities are upgrading with high-efficiency LED lighting and often use recycled synthetic lane surfaces to meet sustainability goals. The guest journey is being streamlined via digital kiosks and mobile ordering systems.
  • While some centers maintain traditional wooden lanes requiring specialized oiling, the market standard is shifting. Even the core equipment, from the ball return mechanisms to high-performance bowling balls, is becoming smarter. Lanes are now complex systems of phenolic laminates and high-pressure phenolic laminates, sometimes with guardian lane overlays, designed to interact perfectly with modern reactive resin bowling balls.
  • This technical landscape, featuring hard rock maple and southern yellow pine in legacy lanes, requires constant innovation.

What are the Key Data Covered in this Bowling Centers Market Research and Growth Report?

  • What is the expected growth of the Bowling Centers Market between 2026 and 2030?

    • USD 3.58 billion, at a CAGR of 4.6%

  • What segmentation does the market report cover?

    • The report is segmented by Material (Synthetic lane, Wooden lane, and Guardian lane), Type (Shopping malls, and Theme parks), End-user (Above 18 years, and Below 18 years) and Geography (North America, Europe, APAC, South America, Middle East and Africa)

  • Which regions are analyzed in the report?

    • North America, Europe, APAC, South America and Middle East and Africa

  • What are the key growth drivers and market challenges?

    • Strategic diversification into multi modal entertainment complexes, Escalating urban real estate and operational fixed costs

  • Who are the major players in the Bowling Centers Market?

    • All Star Lanes Ltd, Bowling Center Esslingen, Brunswick Bowling Products LLC, Dave and Busters Entertainment, Hollywood Bowl Group plc, Main Event Entertainment Inc., Ozone Bowling Centers, QubicaAMF Europe spa, REVS Bowling and Entertainment, Round1 Entertainment Inc., Smaaash Entertainment Pvt. Ltd., South Point Hotel and Casino, Steltronic SRL, Strike N Spare Lanes, Strikes and Spares Entertaiment, Switch Bowling Dubai, TEEG Australia Pty Ltd., Tenpin Entertainment Ltd., Tsogo Sun and Twelve Strike

Market Research Insights

  • The market is dynamically shifting toward multi-modal entertainment complexes that prioritize holistic guest experiences. The adoption of the family entertainment center (FEC) model is pivotal, with such venues reporting up to a 40% higher per-capita spend compared to traditional alleys, primarily through high-margin food and beverage sales and ancillary amusements.
  • This eatertainment concept is central to the resurgence of corporate hospitality, as businesses seek engaging environments for group-based socializing. The move to upscale boutique venues that offer curated aesthetic experiences attracts a premium demographic, boosting profitability.
  • Centers that fully embrace the retail-tainment trend by integrating within larger commercial hubs see a 20% greater foot traffic during off-peak hours, demonstrating the model's effectiveness in creating versatile social entertainment hubs.

We can help! Our analysts can customize this bowling centers market research report to meet your requirements.

Get in touch

1. Executive Summary

1.1 Market overview

Executive Summary - Chart on Market Overview
Executive Summary - Data Table on Market Overview
Executive Summary - Chart on Global Market Characteristics
Executive Summary - Chart on Market by Geography
Executive Summary - Chart on Market Segmentation by Material
Executive Summary - Chart on Market Segmentation by Type
Executive Summary - Chart on Market Segmentation by End-user
Executive Summary - Chart on Incremental Growth
Executive Summary - Data Table on Incremental Growth
Executive Summary - Chart on Company Market Positioning

2. Technavio Analysis

2.1 Analysis of price sensitivity, lifecycle, customer purchase basket, adoption rates, and purchase criteria

2.2 Criticality of inputs and Factors of differentiation

Chart on Overview on criticality of inputs and factors of differentiation

2.3 Factors of disruption

Chart on Overview on factors of disruption

2.4 Impact of drivers and challenges

Chart on Impact of drivers and challenges in 2025 and 2030

3. Market Landscape

3.1 Market ecosystem

Chart on Parent Market
Data Table on - Parent Market

3.2 Market characteristics

Chart on Market characteristics analysis

3.3 Value chain analysis

Chart on Value chain analysis

4. Market Sizing

4.1 Market definition

Data Table on Offerings of companies included in the market definition

4.2 Market segment analysis

Market segments

4.3 Market size 2025

4.4 Market outlook: Forecast for 2025-2030

Chart on Global - Market size and forecast 2025-2030 ($ million)
Data Table on Global - Market size and forecast 2025-2030 ($ million)
Chart on Global Market: Year-over-year growth 2025-2030 (%)
Data Table on Global Market: Year-over-year growth 2025-2030 (%)

5. Historic Market Size

5.1 Global Bowling Centers Market 2020 - 2024

Historic Market Size - Data Table on Global Bowling Centers Market 2020 - 2024 ($ million)

5.2 Material segment analysis 2020 - 2024

Historic Market Size - Material Segment 2020 - 2024 ($ million)

5.3 Type segment analysis 2020 - 2024

Historic Market Size - Type Segment 2020 - 2024 ($ million)

5.4 End-user segment analysis 2020 - 2024

Historic Market Size - End-user Segment 2020 - 2024 ($ million)

5.5 Geography segment analysis 2020 - 2024

Historic Market Size - Geography Segment 2020 - 2024 ($ million)

5.6 Country segment analysis 2020 - 2024

Historic Market Size - Country Segment 2020 - 2024 ($ million)

6. Qualitative Analysis

6.1 Impact of AI on global bowling centers market

6.2 Impact of geopolitical conflict on global bowling centers market

7. Five Forces Analysis

7.1 Five forces summary

Five forces analysis - Comparison between 2025 and 2030

7.2 Bargaining power of buyers

Bargaining power of buyers - Impact of key factors 2025 and 2030

7.3 Bargaining power of suppliers

Bargaining power of suppliers - Impact of key factors in 2025 and 2030

7.4 Threat of new entrants

Threat of new entrants - Impact of key factors in 2025 and 2030

7.5 Threat of substitutes

Threat of substitutes - Impact of key factors in 2025 and 2030

7.6 Threat of rivalry

Threat of rivalry - Impact of key factors in 2025 and 2030

7.7 Market condition

Chart on Market condition - Five forces 2025 and 2030

8. Market Segmentation by Material

8.1 Market segments

Chart on Material - Market share 2025-2030 (%)
Data Table on Material - Market share 2025-2030 (%)

8.2 Comparison by Material

Chart on Comparison by Material
Data Table on Comparison by Material

8.3 Synthetic lane - Market size and forecast 2025-2030

Chart on Synthetic lane - Market size and forecast 2025-2030 ($ million)
Data Table on Synthetic lane - Market size and forecast 2025-2030 ($ million)
Chart on Synthetic lane - Year-over-year growth 2025-2030 (%)
Data Table on Synthetic lane - Year-over-year growth 2025-2030 (%)

8.4 Wooden lane - Market size and forecast 2025-2030

Chart on Wooden lane - Market size and forecast 2025-2030 ($ million)
Data Table on Wooden lane - Market size and forecast 2025-2030 ($ million)
Chart on Wooden lane - Year-over-year growth 2025-2030 (%)
Data Table on Wooden lane - Year-over-year growth 2025-2030 (%)

8.5 Guardian lane - Market size and forecast 2025-2030

Chart on Guardian lane - Market size and forecast 2025-2030 ($ million)
Data Table on Guardian lane - Market size and forecast 2025-2030 ($ million)
Chart on Guardian lane - Year-over-year growth 2025-2030 (%)
Data Table on Guardian lane - Year-over-year growth 2025-2030 (%)

8.6 Market opportunity by Material

Market opportunity by Material ($ million)
Data Table on Market opportunity by Material ($ million)

9. Market Segmentation by Type

9.1 Market segments

Chart on Type - Market share 2025-2030 (%)
Data Table on Type - Market share 2025-2030 (%)

9.2 Comparison by Type

Chart on Comparison by Type
Data Table on Comparison by Type

9.3 Shopping malls - Market size and forecast 2025-2030

Chart on Shopping malls - Market size and forecast 2025-2030 ($ million)
Data Table on Shopping malls - Market size and forecast 2025-2030 ($ million)
Chart on Shopping malls - Year-over-year growth 2025-2030 (%)
Data Table on Shopping malls - Year-over-year growth 2025-2030 (%)

9.4 Theme parks - Market size and forecast 2025-2030

Chart on Theme parks - Market size and forecast 2025-2030 ($ million)
Data Table on Theme parks - Market size and forecast 2025-2030 ($ million)
Chart on Theme parks - Year-over-year growth 2025-2030 (%)
Data Table on Theme parks - Year-over-year growth 2025-2030 (%)

9.5 Market opportunity by Type

Market opportunity by Type ($ million)
Data Table on Market opportunity by Type ($ million)

10. Market Segmentation by End-user

10.1 Market segments

Chart on End-user - Market share 2025-2030 (%)
Data Table on End-user - Market share 2025-2030 (%)

10.2 Comparison by End-user

Chart on Comparison by End-user
Data Table on Comparison by End-user

10.3 Above 18 years - Market size and forecast 2025-2030

Chart on Above 18 years - Market size and forecast 2025-2030 ($ million)
Data Table on Above 18 years - Market size and forecast 2025-2030 ($ million)
Chart on Above 18 years - Year-over-year growth 2025-2030 (%)
Data Table on Above 18 years - Year-over-year growth 2025-2030 (%)

10.4 Below 18 years - Market size and forecast 2025-2030

Chart on Below 18 years - Market size and forecast 2025-2030 ($ million)
Data Table on Below 18 years - Market size and forecast 2025-2030 ($ million)
Chart on Below 18 years - Year-over-year growth 2025-2030 (%)
Data Table on Below 18 years - Year-over-year growth 2025-2030 (%)

10.5 Market opportunity by End-user

Market opportunity by End-user ($ million)
Data Table on Market opportunity by End-user ($ million)

11. Customer Landscape

11.1 Customer landscape overview

Analysis of price sensitivity, lifecycle, customer purchase basket, adoption rates, and purchase criteria

12. Geographic Landscape

12.1 Geographic segmentation

Chart on Market share by geography 2025-2030 (%)
Data Table on Market share by geography 2025-2030 (%)

12.2 Geographic comparison

Chart on Geographic comparison
Data Table on Geographic comparison

12.3 North America - Market size and forecast 2025-2030

Chart on North America - Market size and forecast 2025-2030 ($ million)
Data Table on North America - Market size and forecast 2025-2030 ($ million)
Chart on North America - Year-over-year growth 2025-2030 (%)
Data Table on North America - Year-over-year growth 2025-2030 (%)
Chart on Regional Comparison - North America
Data Table on Regional Comparison - North America

12.3.1 US - Market size and forecast 2025-2030

Chart on US - Market size and forecast 2025-2030 ($ million)
Data Table on US - Market size and forecast 2025-2030 ($ million)
Chart on US - Year-over-year growth 2025-2030 (%)
Data Table on US - Year-over-year growth 2025-2030 (%)

12.3.2 Canada - Market size and forecast 2025-2030

Chart on Canada - Market size and forecast 2025-2030 ($ million)
Data Table on Canada - Market size and forecast 2025-2030 ($ million)
Chart on Canada - Year-over-year growth 2025-2030 (%)
Data Table on Canada - Year-over-year growth 2025-2030 (%)

12.3.3 Mexico - Market size and forecast 2025-2030

Chart on Mexico - Market size and forecast 2025-2030 ($ million)
Data Table on Mexico - Market size and forecast 2025-2030 ($ million)
Chart on Mexico - Year-over-year growth 2025-2030 (%)
Data Table on Mexico - Year-over-year growth 2025-2030 (%)

12.4 Europe - Market size and forecast 2025-2030

Chart on Europe - Market size and forecast 2025-2030 ($ million)
Data Table on Europe - Market size and forecast 2025-2030 ($ million)
Chart on Europe - Year-over-year growth 2025-2030 (%)
Data Table on Europe - Year-over-year growth 2025-2030 (%)
Chart on Regional Comparison - Europe
Data Table on Regional Comparison - Europe

12.4.1 Germany - Market size and forecast 2025-2030

Chart on Germany - Market size and forecast 2025-2030 ($ million)
Data Table on Germany - Market size and forecast 2025-2030 ($ million)
Chart on Germany - Year-over-year growth 2025-2030 (%)
Data Table on Germany - Year-over-year growth 2025-2030 (%)

12.4.2 UK - Market size and forecast 2025-2030

Chart on UK - Market size and forecast 2025-2030 ($ million)
Data Table on UK - Market size and forecast 2025-2030 ($ million)
Chart on UK - Year-over-year growth 2025-2030 (%)
Data Table on UK - Year-over-year growth 2025-2030 (%)

12.4.3 France - Market size and forecast 2025-2030

Chart on France - Market size and forecast 2025-2030 ($ million)
Data Table on France - Market size and forecast 2025-2030 ($ million)
Chart on France - Year-over-year growth 2025-2030 (%)
Data Table on France - Year-over-year growth 2025-2030 (%)

12.4.4 The Netherlands - Market size and forecast 2025-2030

Chart on The Netherlands - Market size and forecast 2025-2030 ($ million)
Data Table on The Netherlands - Market size and forecast 2025-2030 ($ million)
Chart on The Netherlands - Year-over-year growth 2025-2030 (%)
Data Table on The Netherlands - Year-over-year growth 2025-2030 (%)

12.4.5 Sweden - Market size and forecast 2025-2030

Chart on Sweden - Market size and forecast 2025-2030 ($ million)
Data Table on Sweden - Market size and forecast 2025-2030 ($ million)
Chart on Sweden - Year-over-year growth 2025-2030 (%)
Data Table on Sweden - Year-over-year growth 2025-2030 (%)

12.4.6 Italy - Market size and forecast 2025-2030

Chart on Italy - Market size and forecast 2025-2030 ($ million)
Data Table on Italy - Market size and forecast 2025-2030 ($ million)
Chart on Italy - Year-over-year growth 2025-2030 (%)
Data Table on Italy - Year-over-year growth 2025-2030 (%)

12.5 APAC - Market size and forecast 2025-2030

Chart on APAC - Market size and forecast 2025-2030 ($ million)
Data Table on APAC - Market size and forecast 2025-2030 ($ million)
Chart on APAC - Year-over-year growth 2025-2030 (%)
Data Table on APAC - Year-over-year growth 2025-2030 (%)
Chart on Regional Comparison - APAC
Data Table on Regional Comparison - APAC

12.5.1 Japan - Market size and forecast 2025-2030

Chart on Japan - Market size and forecast 2025-2030 ($ million)
Data Table on Japan - Market size and forecast 2025-2030 ($ million)
Chart on Japan - Year-over-year growth 2025-2030 (%)
Data Table on Japan - Year-over-year growth 2025-2030 (%)

12.5.2 China - Market size and forecast 2025-2030

Chart on China - Market size and forecast 2025-2030 ($ million)
Data Table on China - Market size and forecast 2025-2030 ($ million)
Chart on China - Year-over-year growth 2025-2030 (%)
Data Table on China - Year-over-year growth 2025-2030 (%)

12.5.3 Australia - Market size and forecast 2025-2030

Chart on Australia - Market size and forecast 2025-2030 ($ million)
Data Table on Australia - Market size and forecast 2025-2030 ($ million)
Chart on Australia - Year-over-year growth 2025-2030 (%)
Data Table on Australia - Year-over-year growth 2025-2030 (%)

12.5.4 South Korea - Market size and forecast 2025-2030

Chart on South Korea - Market size and forecast 2025-2030 ($ million)
Data Table on South Korea - Market size and forecast 2025-2030 ($ million)
Chart on South Korea - Year-over-year growth 2025-2030 (%)
Data Table on South Korea - Year-over-year growth 2025-2030 (%)

12.5.5 India - Market size and forecast 2025-2030

Chart on India - Market size and forecast 2025-2030 ($ million)
Data Table on India - Market size and forecast 2025-2030 ($ million)
Chart on India - Year-over-year growth 2025-2030 (%)
Data Table on India - Year-over-year growth 2025-2030 (%)

12.5.6 Indonesia - Market size and forecast 2025-2030

Chart on Indonesia - Market size and forecast 2025-2030 ($ million)
Data Table on Indonesia - Market size and forecast 2025-2030 ($ million)
Chart on Indonesia - Year-over-year growth 2025-2030 (%)
Data Table on Indonesia - Year-over-year growth 2025-2030 (%)

12.6 South America - Market size and forecast 2025-2030

Chart on South America - Market size and forecast 2025-2030 ($ million)
Data Table on South America - Market size and forecast 2025-2030 ($ million)
Chart on South America - Year-over-year growth 2025-2030 (%)
Data Table on South America - Year-over-year growth 2025-2030 (%)
Chart on Regional Comparison - South America
Data Table on Regional Comparison - South America

12.6.1 Brazil - Market size and forecast 2025-2030

Chart on Brazil - Market size and forecast 2025-2030 ($ million)
Data Table on Brazil - Market size and forecast 2025-2030 ($ million)
Chart on Brazil - Year-over-year growth 2025-2030 (%)
Data Table on Brazil - Year-over-year growth 2025-2030 (%)

12.6.2 Argentina - Market size and forecast 2025-2030

Chart on Argentina - Market size and forecast 2025-2030 ($ million)
Data Table on Argentina - Market size and forecast 2025-2030 ($ million)
Chart on Argentina - Year-over-year growth 2025-2030 (%)
Data Table on Argentina - Year-over-year growth 2025-2030 (%)

12.6.3 Chile - Market size and forecast 2025-2030

Chart on Chile - Market size and forecast 2025-2030 ($ million)
Data Table on Chile - Market size and forecast 2025-2030 ($ million)
Chart on Chile - Year-over-year growth 2025-2030 (%)
Data Table on Chile - Year-over-year growth 2025-2030 (%)

12.7 Middle East and Africa - Market size and forecast 2025-2030

Chart on Middle East and Africa - Market size and forecast 2025-2030 ($ million)
Data Table on Middle East and Africa - Market size and forecast 2025-2030 ($ million)
Chart on Middle East and Africa - Year-over-year growth 2025-2030 (%)
Data Table on Middle East and Africa - Year-over-year growth 2025-2030 (%)
Chart on Regional Comparison - Middle East and Africa
Data Table on Regional Comparison - Middle East and Africa

12.7.1 UAE - Market size and forecast 2025-2030

Chart on UAE - Market size and forecast 2025-2030 ($ million)
Data Table on UAE - Market size and forecast 2025-2030 ($ million)
Chart on UAE - Year-over-year growth 2025-2030 (%)
Data Table on UAE - Year-over-year growth 2025-2030 (%)

12.7.2 Saudi Arabia - Market size and forecast 2025-2030

Chart on Saudi Arabia - Market size and forecast 2025-2030 ($ million)
Data Table on Saudi Arabia - Market size and forecast 2025-2030 ($ million)
Chart on Saudi Arabia - Year-over-year growth 2025-2030 (%)
Data Table on Saudi Arabia - Year-over-year growth 2025-2030 (%)

12.7.3 South Africa - Market size and forecast 2025-2030

Chart on South Africa - Market size and forecast 2025-2030 ($ million)
Data Table on South Africa - Market size and forecast 2025-2030 ($ million)
Chart on South Africa - Year-over-year growth 2025-2030 (%)
Data Table on South Africa - Year-over-year growth 2025-2030 (%)

12.7.4 Egypt - Market size and forecast 2025-2030

Chart on Egypt - Market size and forecast 2025-2030 ($ million)
Data Table on Egypt - Market size and forecast 2025-2030 ($ million)
Chart on Egypt - Year-over-year growth 2025-2030 (%)
Data Table on Egypt - Year-over-year growth 2025-2030 (%)

12.7.5 Nigeria - Market size and forecast 2025-2030

Chart on Nigeria - Market size and forecast 2025-2030 ($ million)
Data Table on Nigeria - Market size and forecast 2025-2030 ($ million)
Chart on Nigeria - Year-over-year growth 2025-2030 (%)
Data Table on Nigeria - Year-over-year growth 2025-2030 (%)

12.8 Market opportunity by geography

Market opportunity by geography ($ million)
Data Tables on Market opportunity by geography ($ million)

13. Drivers, Challenges, and Opportunity

13.1 Market drivers

Strategic diversification into multi modal entertainment complexes
Technological innovation and gamification of lane experience
Resurgence of corporate hospitality and group based socializing

13.2 Market challenges

Escalating urban real estate and operational fixed costs
Competitive pressure from digital gaming and alternative leisure
Supply chain volatility and infrastructure procurement barriers

13.3 Impact of drivers and challenges

Impact of drivers and challenges in 2025 and 2030

13.4 Market opportunities

Proliferation of boutique and social entertainment center hybrid models
Technological convergence and gamification of gameplay
Strategic emphasis on sustainability and operational efficiency

14. Competitive Landscape

14.1 Overview

14.2

Overview on criticality of inputs and factors of differentiation

14.3 Landscape disruption

Overview on factors of disruption

14.4 Industry risks

Impact of key risks on business

15. Competitive Analysis

15.1 Companies profiled

Companies covered

15.2 Company ranking index

15.3 Market positioning of companies

Matrix on companies position and classification

15.4 All Star Lanes Ltd

All Star Lanes Ltd - Overview
All Star Lanes Ltd - Product / Service
All Star Lanes Ltd - Key offerings
SWOT

15.5 Bowling Center Esslingen

Bowling Center Esslingen - Overview
Bowling Center Esslingen - Product / Service
Bowling Center Esslingen - Key offerings
SWOT

15.6 Brunswick Bowling Products LLC

Brunswick Bowling Products LLC - Overview
Brunswick Bowling Products LLC - Product / Service
Brunswick Bowling Products LLC - Key offerings
SWOT

15.7 Dave and Busters Entertainment

Dave and Busters Entertainment - Overview
Dave and Busters Entertainment - Product / Service
Dave and Busters Entertainment - Key offerings
SWOT

15.8 Hollywood Bowl Group plc

Hollywood Bowl Group plc - Overview
Hollywood Bowl Group plc - Product / Service
Hollywood Bowl Group plc - Key offerings
SWOT

15.9 Main Event Entertainment Inc.

Main Event Entertainment Inc. - Overview
Main Event Entertainment Inc. - Product / Service
Main Event Entertainment Inc. - Key offerings
SWOT

15.10 Ozone Bowling Centers

Ozone Bowling Centers - Overview
Ozone Bowling Centers - Product / Service
Ozone Bowling Centers - Key offerings
SWOT

15.11 QubicaAMF Europe spa

QubicaAMF Europe spa - Overview
QubicaAMF Europe spa - Product / Service
QubicaAMF Europe spa - Key offerings
SWOT

15.12 REVS Bowling and Entertainment

REVS Bowling and Entertainment - Overview
REVS Bowling and Entertainment - Product / Service
REVS Bowling and Entertainment - Key offerings
SWOT

15.13 Round1 Entertainment Inc.

Round1 Entertainment Inc. - Overview
Round1 Entertainment Inc. - Product / Service
Round1 Entertainment Inc. - Key offerings
SWOT

15.14 South Point Hotel and Casino

South Point Hotel and Casino - Overview
South Point Hotel and Casino - Product / Service
South Point Hotel and Casino - Key offerings
SWOT

15.15 Steltronic SRL

Steltronic SRL - Overview
Steltronic SRL - Product / Service
Steltronic SRL - Key offerings
SWOT

15.16 Switch Bowling Dubai

Switch Bowling Dubai - Overview
Switch Bowling Dubai - Product / Service
Switch Bowling Dubai - Key offerings
SWOT

15.17 TEEG Australia Pty Ltd.

TEEG Australia Pty Ltd. - Overview
TEEG Australia Pty Ltd. - Product / Service
TEEG Australia Pty Ltd. - Key offerings
SWOT

15.18 Tsogo Sun

Tsogo Sun - Overview
Tsogo Sun - Product / Service
Tsogo Sun - Key offerings
SWOT

16. Appendix

16.1 Scope of the report

Market definition
Objectives
Notes and caveats

16.2 Inclusions and exclusions checklist

Inclusions checklist
Exclusions checklist

16.3 Currency conversion rates for US$

16.4 Research methodology

16.5 Data procurement

Information sources

16.6 Data validation

16.7 Validation techniques employed for market sizing

16.8 Data synthesis

16.9 360 degree market analysis

16.10 List of abbreviations

Research Methodology

Technavio presents a detailed picture of the market by way of study, synthesis, and summation of data from multiple sources. The analysts have presented the various facets of the market with a particular focus on identifying the key industry influencers. The data thus presented is comprehensive, reliable, and the result of extensive research, both primary and secondary.

INFORMATION SOURCES

Primary sources

  • Manufacturers and suppliers
  • Channel partners
  • Industry experts
  • Strategic decision makers

Secondary sources

  • Industry journals and periodicals
  • Government data
  • Financial reports of key industry players
  • Historical data
  • Press releases

DATA ANALYSIS

Data Synthesis

  • Collation of data
  • Estimation of key figures
  • Analysis of derived insights

Data Validation

  • Triangulation with data models
  • Reference against proprietary databases
  • Corroboration with industry experts

REPORT WRITING

Qualitative

  • Market drivers
  • Market challenges
  • Market trends
  • Five forces analysis

Quantitative

  • Market size and forecast
  • Market segmentation
  • Geographical insights
  • Competitive landscape

Interested in this report?

Get your sample now to see our research methodology and insights!

Download Now

Frequently Asked Questions

Bowling Centers market growth will increase by USD 3579.5 million during 2026-2030.

The Bowling Centers market is expected to grow at a CAGR of 4.6% during 2026-2030.

Bowling Centers market is segmented by Material (Synthetic lane, Wooden lane, Guardian lane) Type (Shopping malls, Theme parks) End-user (Above 18 years, Below 18 years)

All Star Lanes Ltd, Bowling Center Esslingen, Brunswick Bowling Products LLC, Dave and Busters Entertainment, Hollywood Bowl Group plc, Main Event Entertainment Inc., Ozone Bowling Centers, QubicaAMF Europe spa, REVS Bowling and Entertainment, Round1 Entertainment Inc., Smaaash Entertainment Pvt. Ltd., South Point Hotel and Casino, Steltronic SRL, Strike N Spare Lanes, Strikes and Spares Entertaiment, Switch Bowling Dubai, TEEG Australia Pty Ltd., Tenpin Entertainment Ltd., Tsogo Sun, Twelve Strike are a few of the key vendors in the Bowling Centers market.

North America will register the highest growth rate of 51.7% among the other regions. Therefore, the Bowling Centers market in North America is expected to garner significant business opportunities for the vendors during the forecast period.

US, Canada, Mexico, Germany, UK, France, The Netherlands, Sweden, Italy, Japan, China, Australia, South Korea, India, Indonesia, Brazil, Argentina, Chile, UAE, Saudi Arabia, South Africa, Egypt, Nigeria

  • Strategic diversification into multi modal entertainment complexes is the driving factor this market.

The Bowling Centers market vendors should focus on grabbing business opportunities from the Material segment as it accounted for the largest market share in the base year.
RIA - Research AI Assistant
Ask RIA