Trail Mixes Market Size 2025-2029
The trail mixes market size is forecast to increase by USD 9.4 billion at a CAGR of 7.4% between 2024 and 2029.
- The market is experiencing significant growth due to the increasing demand for healthy and on-the-go snacking options. Consumers' preference for natural, nutrient-dense foods is driving the market, with organic and gluten-free trail mixes gaining popularity. However, regulatory hurdles impact adoption, as stringent food safety regulations necessitate compliance with various standards, increasing production costs. Additionally, supply chain inconsistencies temper growth potential due to the reliance on raw materials sourced from various regions, which can lead to fluctuations in availability and quality.
- Companies seeking to capitalize on market opportunities must focus on ensuring regulatory compliance and establishing robust supply chain management systems. Strategic partnerships with organic farmers and suppliers can help mitigate supply chain risks and provide a competitive edge. Furthermore, innovation in flavor profiles and ingredient combinations can differentiate offerings and cater to diverse consumer preferences.
What will be the Size of the Trail Mixes Market during the forecast period?

- The trail mixes market exhibits dynamic consumer preferences, with demographics increasingly seeking healthy options. Ancient grains and high-protein content are popular trends, catering to the active lifestyle of modern consumers. Limited edition blends, infused with seasonal flavors, attract a niche market. Brands differentiate themselves through ingredient quality, traceability, and fair trade. Healthy fats, fiber, and calorie count are key considerations for health-conscious buyers. Social media marketing and influencer collaborations drive consumer insights, shaping brand perception. Sustainable sourcing and sugar content are critical factors influencing purchasing decisions. Distribution challenges and cold storage requirements pose significant obstacles. Efficient logistics networks and advanced cold chain infrastructure are essential to ensure product availability and maintain quality.
- Market research indicates a growing demand for nut-free options, addressing dietary restrictions. Brand ambassadors and online reviews contribute to product differentiation, fostering consumer trust. Shelf stability and nutritional value are essential for long-term market success. Ingredient transparency and fiber content are essential for catering to the evolving needs of the target audience.
How is this Trail Mixes Industry segmented?
The trail mixes industry research report provides comprehensive data (region-wise segment analysis), with forecasts and estimates in "USD million" for the period 2025-2029, as well as historical data from 2019-2023 for the following segments.
- Distribution Channel
- Offline
- Online
- Product
- Inorganic trail mixes
- Organic trail mixes
- End-user
- Household consumption
- Travel and outdoor activities
- Sports and fitness nutrition
- Institutional
- Type Of Packaging
- Single-serve packs
- Multi-serve bags
- Bulk packaging
- Eco-friendly or compostable packaging
- Geography
- North America
- US
- Canada
- Europe
- France
- Germany
- Italy
- Spain
- UK
- APAC
- China
- India
- Japan
- Rest of World (ROW)
- North America
By Distribution Channel Insights
The offline segment is estimated to witness significant growth during the forecast period. Trail mixes continue to be a popular choice for consumers seeking convenient, nutritious, and delicious snacks. In 2024, offline distribution channels remain crucial in catering to a broad consumer base. Grocery stores and supermarkets serve as primary retail points, offering a diverse selection of trail mixes that cater to various tastes and dietary preferences, including vegan, organic, and sports nutrition options. Convenience stores, spread across urban and suburban areas, provide on-the-go snacking solutions, making trail mixes readily available for busy individuals. Specialty food stores, such as health food shops and organic markets, offer curated selections of trail mixes, ensuring health-conscious buyers have access to specific varieties.
Marketing campaigns and brand awareness play significant roles in driving consumer preferences. Customizable blends, single-serve packs, and bulk packaging cater to various consumer needs. Production processes prioritize food safety regulations and quality control to meet consumer expectations. Pricing strategies vary, with some brands focusing on affordability, while others offer premium ingredients and unique flavors. Trail mix ingredients include a wide range of nuts, seeds, dried fruits, pretzel pieces, and chocolate chunks, providing diverse taste profiles and textures. Travel snacks, hiking snacks, and fitness snacks are popular applications for trail mixes. Snack bars and energy bars are alternative formats that incorporate trail mix ingredients for added nutrition and convenience.
Subscription services and online retailers offer increased accessibility and flexibility for consumers, while retail distribution channels expand to include natural food stores and convenience stores. Product innovation continues to drive the market, with new flavor profiles, ingredient sourcing strategies, and packaging designs capturing consumer attention. Supply chain management and shelf life considerations are essential aspects of the production process. Overall, the trail mix market remains dynamic, with a focus on meeting diverse consumer needs and preferences.
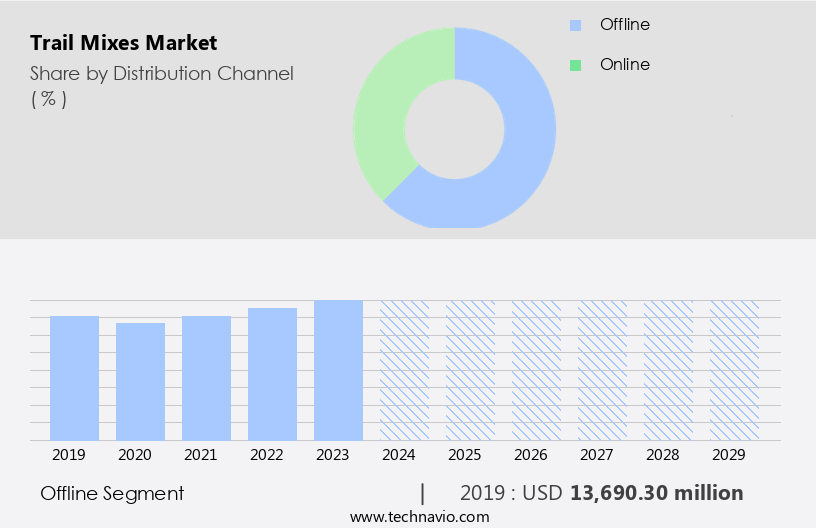
The Offline segment was valued at USD 13.69 billion in 2019 and showed a gradual increase during the forecast period.
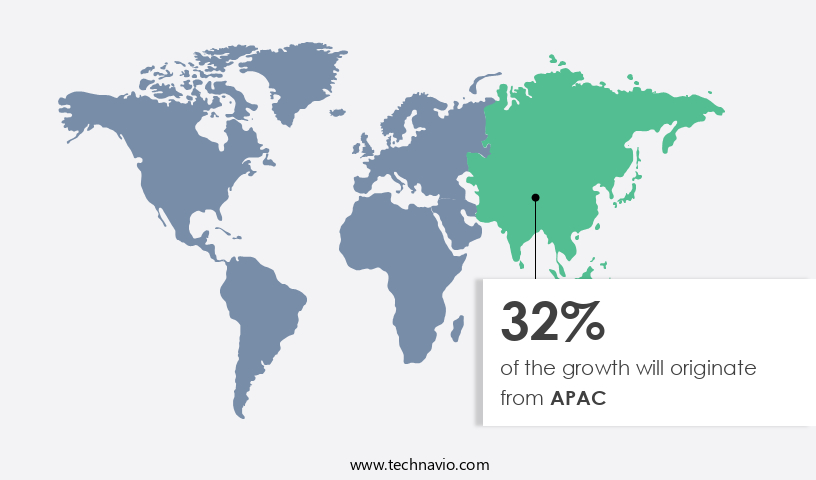
Regional Analysis
APAC is estimated to contribute 32% to the growth of the global market during the forecast period. Technavio's analysts have elaborately explained the regional trends and drivers that shape the market during the forecast period.
Trail mixes have become a preferred snack option in the Americas, specifically in the US and Canada, as consumers seek convenient and nutritious alternatives. The market's evolution includes the introduction of innovative nut, dried fruit, seed, and grain blends to cater to shifting consumer tastes. Busy lifestyles fuel demand for portable, energy-giving snacks rich in essential nutrients. Health-conscious consumers influence the market with their preference for high-protein, fiber-rich, and natural ingredient-based products. In response, brands offer organic, gluten-free, and plant-based trail mixes, reflecting the growing trend towards clean-label products. Marketing campaigns promote these offerings through various channels, including natural food stores, grocery stores, convenience stores, online retailers, and sports nutrition outlets. Frozen desserts, fruits, and pizza remain popular choices, aligning with lifestyle trends and consumer preferences.
Single-serve packs and customizable blends cater to individual preferences, while bulk packaging and long shelf life ensure convenience. Pricing strategies vary, with some brands focusing on affordability, while others offer premium quality and unique flavors. Ingredient sourcing and production processes prioritize food safety regulations and sustainable practices. Trail mixes serve as camping snacks, hiking snacks, travel snacks, and fitness snacks, making them versatile options for various occasions. Additionally, vegan and vegan-friendly options, chocolate chunks, pretzel pieces, and seed mixes cater to diverse consumer preferences. Subscription services and retail distribution networks ensure consistent availability and accessibility. The market's taste profiles continue to evolve, with new flavor combinations and product innovations emerging regularly.
Market Dynamics
Our researchers analyzed the data with 2024 as the base year, along with the key drivers, trends, and challenges. A holistic analysis of drivers will help companies refine their marketing strategies to gain a competitive advantage.
What are the Trail Mixes market drivers leading to the rise in the adoption of Industry?
- The market is fuelled forward by the growing demand for convenient and nutritious snack options. Trail mixes have gained significant popularity in the market due to the increasing preference for convenience foods and health-conscious eating habits. These snacks offer a balanced combination of nuts, seeds, grains, chocolates, and dried fruits, making them a nutritious option for consumers seeking smaller, in-between meals. Trail mixes cater to various dietary needs, including vegan options, and are suitable for camping trips and outdoor activities. The snack's natural ingredients, rich in heart-healthy components, low in fat and calories, and containing low glycemic carbohydrates, make trail mix an ideal choice for maintaining a healthy lifestyle. The convenience factor and customizable blends also contribute to customer loyalty, with many opting for bulk packaging for added savings.
- The market for trail mixes continues to grow as consumers seek nutritious, on-the-go snack alternatives. Packaging design plays a crucial role in the trail mix market, ensuring the product remains fresh and appealing to consumers. The industry offers a wide range of options, including resealable bags, stand-up pouches, and jars, to cater to various consumer preferences and needs. Trail mixes are not only popular among individuals but also among sports nutrition enthusiasts and those seeking a quick energy boost. Overall, the trail mix market is expected to continue its growth trajectory, driven by increasing health consciousness and the demand for convenient, nutritious snack options.
What are the Trail Mixes market trends shaping the Industry?
- The trend in the market is shifting towards organic and gluten-free trail mixes due to rising consumer demand. Two distinct market trends are emerging: a preference for organic products and a growing number of individuals with gluten intolerance or sensitivity. The trail mix market in the US is witnessing significant growth due to the increasing preference for convenient, on-the-go snacking options that cater to health-conscious consumers. Both organic and gluten-free trail mixes are gaining popularity as individuals prioritize natural and certified food products. Organic trail mixes, free from artificial additives and genetically modified organisms (GMOs), are in high demand due to their nutritional benefits and appealing taste profiles. Manufacturers are responding to this trend by expanding their offerings with diverse flavors and ingredient combinations. Gluten-free trail mixes, though a smaller segment of the market, are experiencing rapid growth due to the increasing awareness of gluten intolerance and dietary preferences.
- These mixes cater to the specific needs of consumers who require gluten-free options, ensuring they maintain a healthy lifestyle without compromising taste. The production processes for trail mixes prioritize food safety regulations to ensure the highest quality and longest shelf life possible. Grocery stores and convenience stores are the primary retail distribution channels for trail mixes, making them easily accessible to consumers for their daily snacking needs. Brand awareness and consumer trust are essential factors in the trail mix market. Manufacturers focus on maintaining transparency in their production processes and labeling to build trust with consumers and differentiate themselves from competitors. Overall, the trail mix market is expected to continue growing as consumers prioritize health and convenience in their snacking choices.
How does Trail Mixes market faces challenges during its growth?
- Product recalls, which have become a significant concern due to their potential impact on industry growth, pose a major challenge for the industry. The trail mix market faces challenges related to quality control, as food contamination poses significant health and safety risks to consumers. Manufacturing and packaging processes must be rigorously managed to prevent recalls and maintain brand reputation. In 2024, several high-profile recalls underscored these concerns. For instance, Truly Good Foods recalled its Grabeez Big Cheese Snack Mix due to undeclared nuts, while Suntree Snack Foods issued a voluntary recall of its roasted salted cashew halves and pieces, along with trail mixes containing these cashews, due to the potential presence of glass fragments. Subscription services, offering regular deliveries of portable, healthy snacks, have gained popularity in the health food sector.
- Trail mixes, with their dried fruit combinations, are a popular choice due to their convenience and nutritional benefits. Product innovation, including the introduction of energy bars and unique flavor profiles, further expands the market. Effective supply chain management is crucial for meeting consumer demand and maintaining product quality. Online retailers have become essential intermediaries, providing consumers with a wide range of options and ensuring timely delivery. As the market continues to evolve, manufacturers must prioritize quality control and product innovation to meet consumer expectations and stay competitive.
Exclusive Customer Landscape
The trail mixes market forecasting report includes the adoption lifecycle of the market, covering from the innovator's stage to the laggard's stage. It focuses on adoption rates in different regions based on penetration. Furthermore, the trail mixes market report also includes key purchase criteria and drivers of price sensitivity to help companies evaluate and develop their market growth analysis strategies.
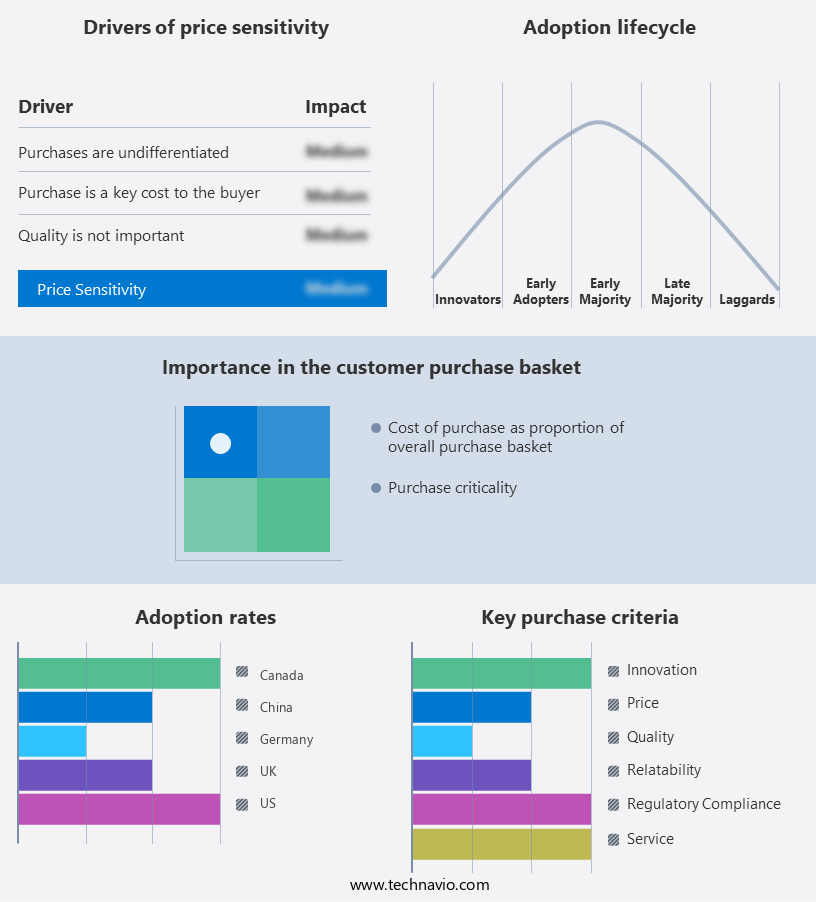
Customer Landscape
Key Companies & Market Insights
Companies are implementing various strategies, such as strategic alliances, trail mixes market forecast, partnerships, mergers and acquisitions, geographical expansion, and product/service launches, to enhance their presence in the industry.
Aldi Stores Ltd. - This company specializes in providing an assortment of trail mixes, featuring savory, sweet, and crunchy components reminiscent of traditional mixes for hiking or trekking.
The industry research and growth report includes detailed analyses of the competitive landscape of the market and information about key companies, including:
- Aldi Stores Ltd.
- Eat This Much Inc.
- General Mills Inc.
- Gourmet Nut
- Happilo International Pvt. Ltd.
- Jerrys Nut House
- Kellogg Co.
- Lehi Valley Trading Co.
- Mars Inc.
- Omay Foods
- PepsiCo Inc.
- Premium Brands Holdings Corp.
- Setton International Foods Inc.
- Shemade Gourmet Foods Pvt Ltd
- Sowparnika Retail Pvt. Ltd.
- The J.M. Smucker Co.
- The Kraft Heinz Co.
Qualitative and quantitative analysis of companies has been conducted to help clients understand the wider business environment as well as the strengths and weaknesses of key industry players. Data is qualitatively analyzed to categorize companies as pure play, category-focused, industry-focused, and diversified; it is quantitatively analyzed to categorize companies as dominant, leading, strong, tentative, and weak.
Recent Development and News in Trail Mixes Market
- In February 2024, Quaker Oats, a leading food manufacturing company, introduced a new line of trail mixes infused with ancient grains, such as quinoa and farro, to cater to the growing consumer demand for healthier snack options (Quaker Oats press release).
- In July 2024, KIND Snacks, another major player in the trail mix market, announced a strategic partnership with The Nature's Bakehouse to expand its product offerings and reach a wider customer base ( KIND Snacks press release).
- In March 2025, General Mills, a global food company, acquired the trail mix brand EPIC Provisions for an undisclosed amount, aiming to strengthen its presence in the premium snack market and tap into the growing consumer preference for clean-label, protein-rich products (General Mills press release).
Research Analyst Overview
The market continues to evolve, reflecting the dynamic needs and preferences of consumers across various sectors. From grocery stores to convenience stores, this versatile snack category caters to diverse demographics, including those seeking fitness snacks, hiking essentials, and on-the-go energy boosters. Seed mixes, nut blends, and dried fruit combinations are popular choices for health-conscious consumers, while chocolate chunks and pretzel pieces add indulgent twists. Fitness enthusiasts opt for protein-rich snack bars and energy bars, often fortified with organic ingredients and vegan options. Production processes have evolved to accommodate customizable blends and single-serve packs, catering to consumer preferences and convenience. These store brands account for a significant market share, particularly in sectors beyond ice cream, which represents only a quarter of the category in convenience stores.
Retail distribution channels have expanded, with natural food stores, sports nutrition outlets, and online retailers offering a wide range of trail mixes and related products. Brand awareness and customer loyalty are crucial factors, with companies investing in marketing campaigns and innovative packaging designs to stand out in a competitive market. Food safety regulations ensure the highest standards, while supply chain management and quality control maintain the shelf life and freshness of these tasty treats. The market continues to unfold, with new product innovations, pricing strategies, and taste profiles emerging to meet the evolving needs of consumers. Frozen vegetables, fruits, and meals are increasingly popular choices for health-conscious consumers, while frozen meat and seafood offerings prioritize food safety and quality control. Whether for hiking, camping, or everyday snacking, trail mixes remain a popular and dynamic category in the world of convenient, portable, and healthful snacks.
Dive into Technavio's strong research methodology, blending expert interviews, extensive data synthesis, and validated models for unparalleled Trail Mixes Market insights. See full methodology.
|
Market Scope |
|
|
Report Coverage |
Details |
|
Page number |
242 |
|
Base year |
2024 |
|
Historic period |
2019-2023 |
|
Forecast period |
2025-2029 |
|
Growth momentum & CAGR |
Accelerate at a CAGR of 7.4% |
|
Market growth 2025-2029 |
USD 9.4 billion |
|
Market structure |
Fragmented |
|
YoY growth 2024-2025(%) |
6.8 |
|
Key countries |
US, Germany, Canada, China, UK, France, Japan, India, Italy, and Spain |
|
Competitive landscape |
Leading Companies, Market Positioning of Companies, Competitive Strategies, and Industry Risks |
What are the Key Data Covered in this Trail Mixes Market Research and Growth Report?
- CAGR of the Trail Mixes industry during the forecast period
- Detailed information on factors that will drive the growth and forecasting between 2025 and 2029
- Precise estimation of the size of the market and its contribution of the industry in focus to the parent market
- Accurate predictions about upcoming growth and trends and changes in consumer behaviour
- Growth of the market across North America, Europe, APAC, Middle East and Africa, and South America
- Thorough analysis of the market's competitive landscape and detailed information about companies
- Comprehensive analysis of factors that will challenge the trail mixes market growth of industry companies
We can help! Our analysts can customize this trail mixes market research report to meet your requirements.
 RIA -
RIA - 
