Breakfast Food Market Analysis, Size, and Forecast 2026-2030: North America (US, Canada, and Mexico), Europe (Germany, UK, and France), APAC (China, India, and Japan), Middle East and Africa (Saudi Arabia, UAE, and South Africa), South America (Brazil and Argentina), and Rest of World (ROW)

Breakfast Food Market Analysis, Size, and Forecast 2026-2030:
North America (US, Canada, and Mexico), Europe (Germany, UK, and France), APAC (China, India, and Japan), Middle East and Africa (Saudi Arabia, UAE, and South Africa), South America (Brazil and Argentina), and Rest of World (ROW)

Published: Mar 2026 299 Pages SKU: IRTNTR75514

Market Overview at a Glance

$115.61 B
Market Opportunity
4.4%
CAGR 2025 - 2030
33.4%
APAC Growth
$336.99 B
Offline segment 2024

Breakfast Food Market Size 2026-2030

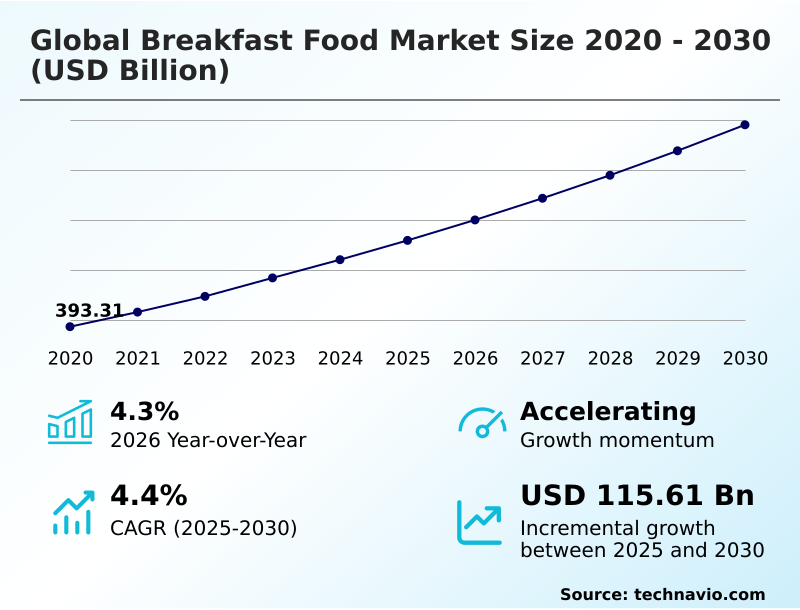
The breakfast food market size is valued to increase by USD 115.61 billion, at a CAGR of 4.4% from 2025 to 2030. Mainstreaming of functional convenience and industrialization of on-the-go nutritive solutions will drive the breakfast food market.

Major Market Trends & Insights

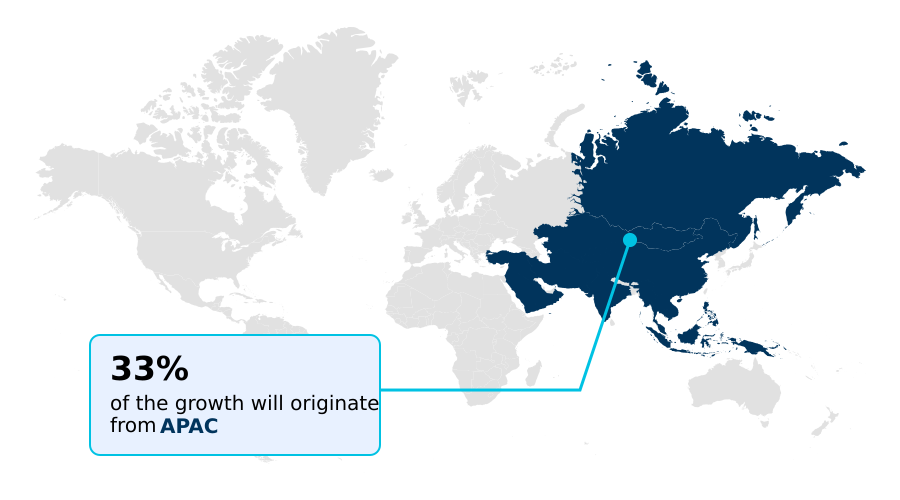
  • APAC dominated the market and accounted for a 33.4% growth during the forecast period.
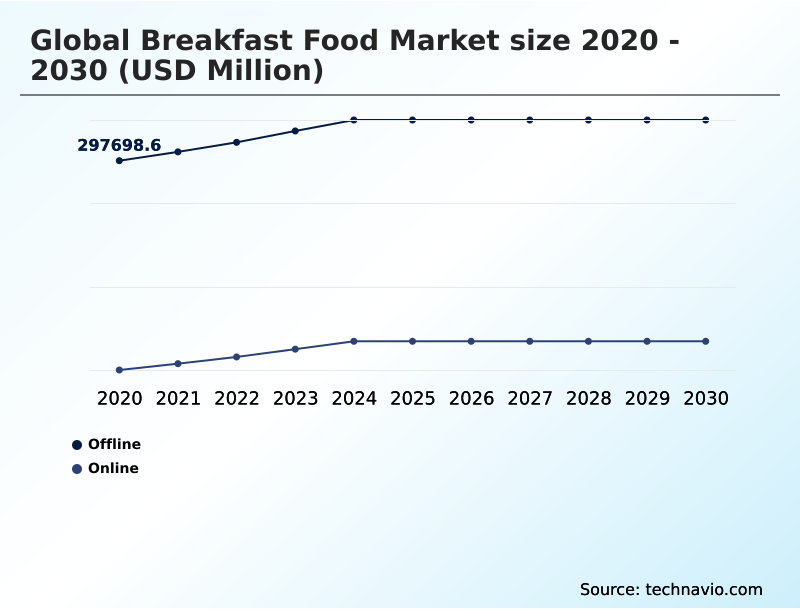
  • By Distribution Channel - Offline segment was valued at USD 336.99 billion in 2024
  • By Type - Bakery products segment accounted for the largest market revenue share in 2024

Market Size & Forecast

  • Market Opportunities: USD 201.91 billion
  • Market Future Opportunities: USD 115.61 billion
  • CAGR from 2025 to 2030 : 4.4%

Market Summary

  • The breakfast food market is undergoing a significant transformation, driven by a consumer shift towards health and wellness. This evolution is compelling manufacturers to move beyond traditional formulations and embrace nutrient-dense formats and clean-label ingredients. The demand for functional convenience has spurred innovation in ready-to-eat cereals and on-the-go nutritive solutions, designed for busy lifestyles.
  • Technologies such as high-pressure processing (HPP) and advanced extrusion for cereal texture are crucial in preserving the organoleptic properties and nutritional value of products. A key business scenario involves the strategic recipe reformulation of a legacy product line to comply with new front-of-package labeling requirements.
  • This requires balancing the reduction of high glycemic indices with maintaining taste and shelf-life, often through the integration of high-potency sweeteners and plant-based proteins. Success in this landscape depends on aligning product development with ethical sourcing standards and the growing consumer preference for foods that support metabolic stability and overall well-being.
  • This shift is not just about ingredients but also about processing and packaging innovations that ensure product integrity and consumer appeal.

What will be the Size of the Breakfast Food Market during the forecast period?

Get Key Insights on Market Forecast (PDF) Request Free Sample

How is the Breakfast Food Market Segmented?

The breakfast food industry research report provides comprehensive data (region-wise segment analysis), with forecasts and estimates in "USD million" for the period 2026-2030, as well as historical data from 2020-2024 for the following segments.

  • Distribution channel
    • Offline
    • Online
  • Type
    • Bakery products
    • Ready meals
    • Cereals
    • Snack bars
    • Others
  • Product
    • RTE
    • RTC
  • Geography
    • North America
      • US
      • Canada
      • Mexico
    • Europe
      • Germany
      • UK
      • France
    • APAC
      • China
      • India
      • Japan
    • Middle East and Africa
      • Saudi Arabia
      • UAE
      • South Africa
    • South America
      • Brazil
      • Argentina
    • Rest of World (ROW)

By Distribution Channel Insights

The offline segment is estimated to witness significant growth during the forecast period.

The offline segment remains the foundational pillar of the breakfast food market, driven by the immediate availability of perishable staples and a high degree of consumer trust in physical product inspection.

Supermarkets and hypermarkets utilize sophisticated shelf-management strategies and in-store promotions, which influence a significant portion of impulse purchasing decisions for new product lines. This channel is evolving through the integration of click-and-collect models, blending digital convenience with local inventory.

The demand for artisanal breakfast products is supported by the tactile and sensory shopping environment of high-end grocers.

As retailers invest in automation, the offline channel provides the essential infrastructure for both daily household replenishment and the distribution of specialized items like savory porridges and probiotic-rich yogurts, addressing consumer demand for both convenience and high-potency sweeteners in their choices.

Request Free Sample

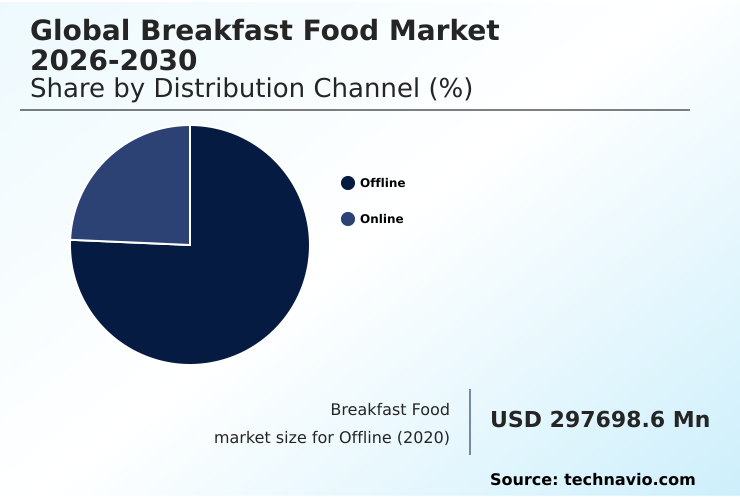
The Offline segment was valued at USD 336.99 billion in 2024 and showed a gradual increase during the forecast period.

Request Free Sample

Regional Analysis

APAC is estimated to contribute 33.4% to the growth of the global market during the forecast period.Technavio’s analysts have elaborately explained the regional trends and drivers that shape the market during the forecast period.

See How Breakfast Food Market Demand is Rising in APAC Request Free Sample

The geographic landscape of the breakfast food market is shifting, with APAC emerging as the primary growth engine, projected to contribute 33.4% of incremental growth.

The region's expansion, with a 5.5% CAGR, significantly outpaces mature markets like North America, which is growing at 3.9%.

This growth is fueled by rising disposable incomes and the rapid adoption of Western breakfast habits, including a demand for high-protein functionalism and nutrient-dense formats.

In contrast, North America and Europe are focused on the premiumization of existing categories, with an emphasis on performance-oriented formats and hyper-convenient hybrid meal kits.

Manufacturers are tailoring products to regional tastes, introducing savory porridges in Asia while focusing on fortified vitamins and minerals in Western markets to meet diverse consumer health objectives and preferences.

Market Dynamics

Our researchers analyzed the data with 2025 as the base year, along with the key drivers, trends, and challenges. A holistic analysis of drivers will help companies refine their marketing strategies to gain a competitive advantage.

  • The global breakfast food market 2026-2030 is increasingly defined by consumer demand for products that align with specific health goals, such as breakfast food for metabolic stability and managing blood sugar with breakfast. This has accelerated the trend of high-protein functionalism in ready meals and the development of clean-label ancient grain formulations.
  • Manufacturers are focused on creating on-the-go nutritive solutions that do not compromise on nutritional value. Central to this is the advancement of plant-based breakfast ecosystem development, which addresses both health and ethical sourcing in breakfast food. However, the industry faces significant hurdles, including the operational impact of nutri-score on cereals and the overarching challenge of supply chain fragility breakfast foods.
  • In this competitive environment, the rise of private label competition breakfast bars forces established brands to innovate continuously. Technological advancements are key, with extrusion technology for cereal texture and high-pressure processing for breakfast meals enabling the creation of superior products. Innovations in packaging, like resealable pouches for breakfast snacks, enhance consumer convenience and extend shelf life.
  • Companies that effectively manage the organoleptic properties of frozen breakfast products while ensuring their offerings are rich in fortified vitamins in ready-to-eat cereals are better positioned for success. Firms leveraging advanced analytics for supply chain planning have reported a 25% reduction in waste compared to those using traditional methods, highlighting the importance of operational efficiency.

What are the key market drivers leading to the rise in the adoption of Breakfast Food Industry?

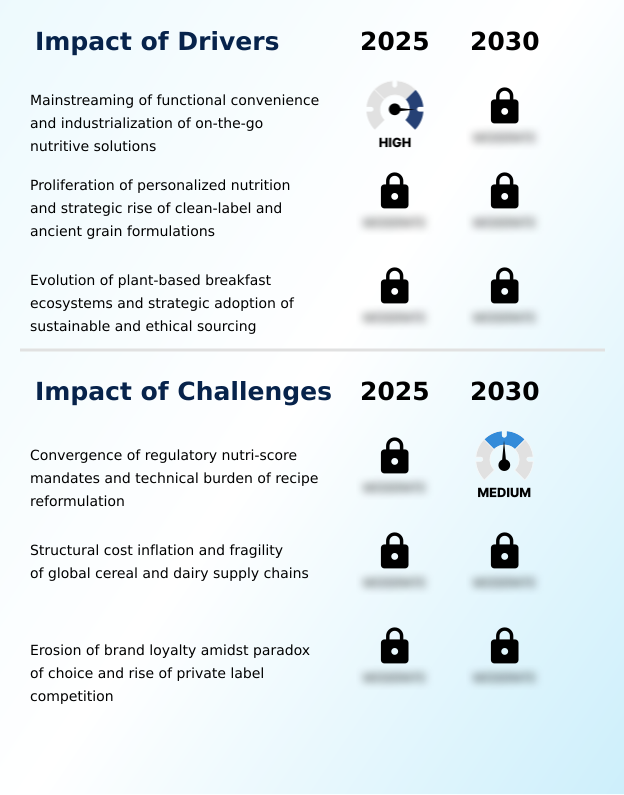
  • The market's primary growth driver is the mainstreaming of functional convenience, underscored by the industrialization of on-the-go nutritive solutions for time-constrained consumers.

  • Market growth is primarily propelled by the mainstreaming of functional convenience and the industrialization of on-the-go nutritive solutions.
  • The convenience factor is now a primary purchase driver for over 60% of consumers in metropolitan areas, fueling demand for products like ready-to-eat cereals and breakfast bars.
  • This is supported by the expansion of direct-to-consumer digital channels, through which firms report a 20% increase in customer lifetime value.
  • The strategic adoption of sustainable and ethical sourcing is also becoming a significant driver, appealing to a growing base of conscious consumers.
  • As the focus on metabolic stability and long-term satiety intensifies, manufacturers are innovating with high-protein and fiber-rich formulations, creating high-value growth opportunities and increasing household penetration.

What are the market trends shaping the Breakfast Food Industry?

  • The institutionalization of high-protein functionalism and the proliferation of performance-oriented formats are defining market evolution. This shift prioritizes nutrient density to meet consumer demands for foods that support metabolic stability and long-term satiety.

  • Key trends are reshaping the breakfast food market, with a strong emphasis on functional and sustainable options. The integration of ancient grain formulations is becoming mainstream as consumers seek nutrient-dense alternatives to traditional grains. This shift is complemented by the development of climate-resilient cereal ecosystems, which has enabled some producers to reduce water usage by up to 15%.
  • There is also a notable proliferation of hyper-convenient hybrid meal kits, which have seen a 25% year-over-year growth in adoption among urban demographics. This trend reflects a broader move toward performance-oriented formats that align with busy, health-conscious lifestyles.
  • The focus on personalized nutrition is also gaining traction, as consumers look for products tailored to their specific dietary needs, driving innovation across all product segments.

What challenges does the Breakfast Food Industry face during its growth?

  • A key market challenge arises from the convergence of stringent regulatory mandates, such as the nutri-score system, and the significant technical burden of recipe reformulation.

  • The market faces considerable challenges, led by the technical burden of recipe reformulation to meet evolving regulatory standards like the nutri-score system. Structural cost inflation across global cereal and dairy supply chains has compressed margins by up to 8% for manufacturers unable to pass on increased costs.
  • This pressure is compounded by intense private label competition, which has captured an additional 5% market share in the last two years, leading to brand loyalty erosion. The paradox of choice in a crowded marketplace further complicates consumer purchasing decisions.
  • Successfully navigating these challenges requires significant investment in R&D to develop cost-effective, compliant, and appealing products while reinforcing brand value against lower-priced alternatives.

Exclusive Technavio Analysis on Customer Landscape

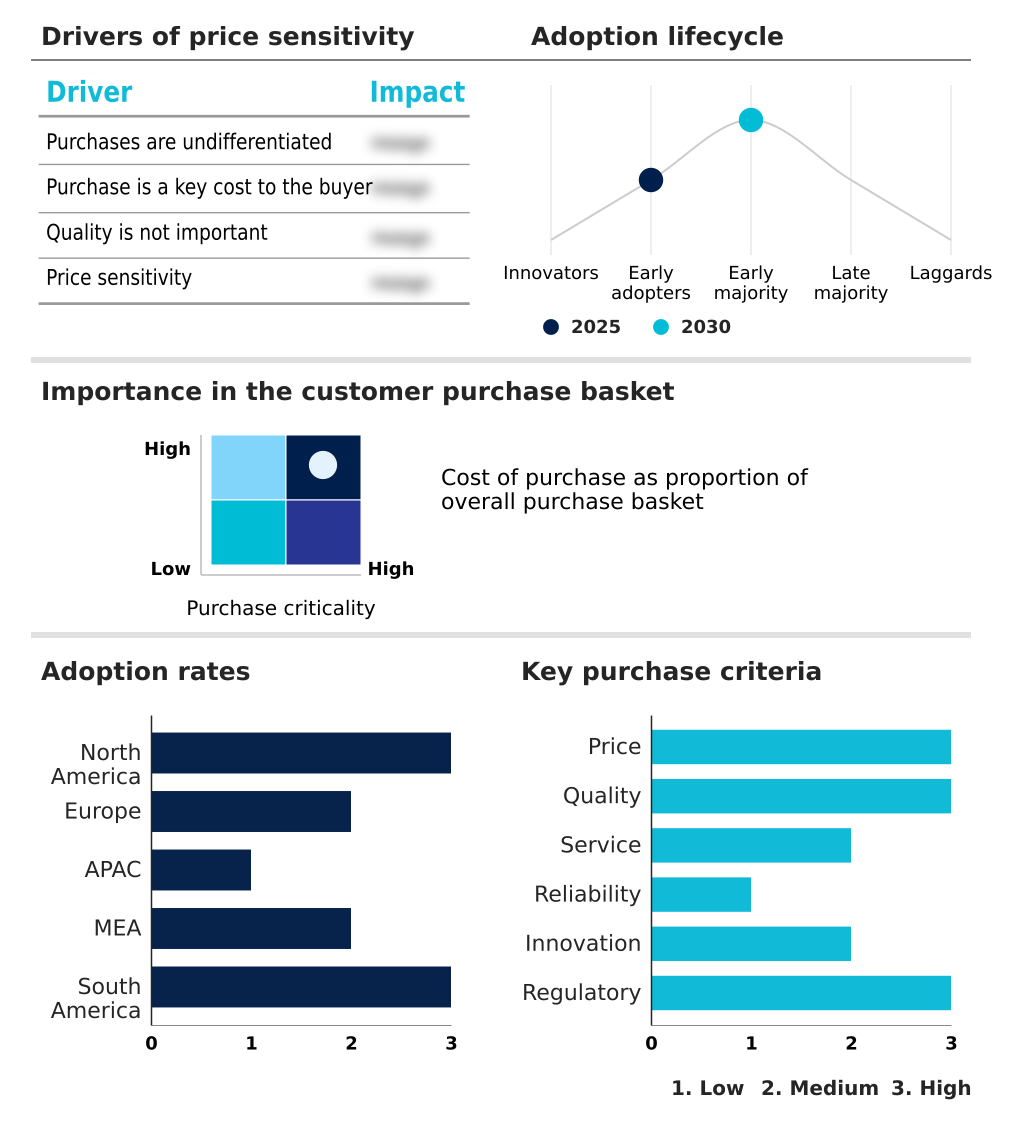
The breakfast food market forecasting report includes the adoption lifecycle of the market, covering from the innovator’s stage to the laggard’s stage. It focuses on adoption rates in different regions based on penetration. Furthermore, the breakfast food market report also includes key purchase criteria and drivers of price sensitivity to help companies evaluate and develop their market growth analysis strategies.

Customer Landscape of Breakfast Food Industry

Competitive Landscape

Companies are implementing various strategies, such as strategic alliances, breakfast food market forecast, partnerships, mergers and acquisitions, geographical expansion, and product/service launches, to enhance their presence in the industry.

Alimento Agro Foods Pvt ltd - Offers a strategic portfolio of breakfast foods, including cereals and baked goods, designed for diverse global retail channels and consumer segments.

The industry research and growth report includes detailed analyses of the competitive landscape of the market and information about key companies, including:

  • Alimento Agro Foods Pvt ltd
  • Associated British Foods Plc
  • Aussee Oats Milling Pvt Ltd
  • B and G Foods Inc.
  • Bobs Red Mill Natural Foods
  • Conagra Brands Inc.
  • Del Monte Foods Inc.
  • Dr. August Oetker KG
  • General Mills Inc.
  • Happy Egg Co. USA.
  • Hormel Foods Corp.
  • ITC Ltd.
  • Kellanova
  • Mars Inc.
  • Nestle SA
  • PepsiCo Inc.
  • pladis Foods Ltd.
  • The Campbell Co
  • The Hain Celestial Group
  • The Kraft Heinz Co.
  • Unilever PLC

Qualitative and quantitative analysis of companies has been conducted to help clients understand the wider business environment as well as the strengths and weaknesses of key industry players. Data is qualitatively analyzed to categorize companies as pure play, category-focused, industry-focused, and diversified; it is quantitatively analyzed to categorize companies as dominant, leading, strong, tentative, and weak.

Recent Development and News in Breakfast food market

  • In February, 2025, the United States Food and Drug Administration issued an updated final rule regarding the 'healthy' claim on food packaging, establishing stricter thresholds for added sugars, sodium, and saturated fats, impacting a majority of the ready-to-eat cereal and bakery segments.
  • In October, 2024, a leading multinational food corporation announced its acquisition of a high-growth startup specializing in plant-based, ready-to-eat breakfast bowls for an estimated $250 million, signaling a strategic push into the vegan market segment.
  • In January, 2025, a major CPG company partnered with a food-tech firm to integrate blockchain technology into its supply chain, aiming to provide consumers with transparent sourcing information for its organic and ancient grain cereal lines.
  • In April, 2025, a European food giant launched a new line of hyper-convenient hybrid meal kits across the UK and Germany, featuring par-baked goods and portioned ingredients designed for quick, high-quality home breakfast preparation.

Dive into Technavio’s robust research methodology, blending expert interviews, extensive data synthesis, and validated models for unparalleled Breakfast Food Market insights. See full methodology.

Market Scope
Page number 299
Base year 2025
Historic period 2020-2024
Forecast period 2026-2030
Growth momentum & CAGR Accelerate at a CAGR of 4.4%
Market growth 2026-2030 USD 115608.7 million
Market structure Fragmented
YoY growth 2025-2026(%) 4.3%
Key countries US, Canada, Mexico, Germany, UK, France, Italy, Spain, The Netherlands, China, India, Japan, South Korea, Australia, Indonesia, Saudi Arabia, UAE, South Africa, Turkey, Israel, Brazil, Argentina and Chile
Competitive landscape Leading Companies, Market Positioning of Companies, Competitive Strategies, and Industry Risks

Request Free Sample

Research Analyst Overview

  • The breakfast food market's evolution is fundamentally a technical one, driven by the convergence of food science, consumer health demands, and regulatory pressures. The industry is moving decisively toward high-protein functionalism, necessitating sophisticated recipe reformulation to incorporate nutrient-dense formats without compromising taste or texture.
  • Key technologies enabling this shift include advanced extrusion for cereal texture, which creates appealing product structures, and high-pressure processing (HPP) to preserve the integrity of clean-label ingredients. The challenge of reducing high glycemic indices in products like shelf-stable pastries is being met with innovations in high-potency sweeteners.
  • Firms are also investing in rapid-freezing techniques, which have demonstrated a 40% improvement in maintaining the organoleptic properties of products over extended periods. This focus on technical excellence extends to packaging, with resealable pouches and single-serve trays becoming standard for on-the-go nutritive solutions.
  • The market's direction is clear: success hinges on the ability to deliver functional convenience through scientifically advanced, ethically sourced, and appealingly packaged products, from ready-to-eat cereals to probiotic-rich yogurts and soy-based yogurt alternatives.

What are the Key Data Covered in this Breakfast Food Market Research and Growth Report?

  • What is the expected growth of the Breakfast Food Market between 2026 and 2030?

    • USD 115.61 billion, at a CAGR of 4.4%

  • What segmentation does the market report cover?

    • The report is segmented by Distribution Channel (Offline, and Online), Type (Bakery products, Ready meals, Cereals, Snack bars, and Others), Product (RTE, and RTC) and Geography (North America, Europe, APAC, Middle East and Africa, South America)

  • Which regions are analyzed in the report?

    • North America, Europe, APAC, Middle East and Africa and South America

  • What are the key growth drivers and market challenges?

    • Mainstreaming of functional convenience and industrialization of on-the-go nutritive solutions, Convergence of regulatory nutri-score mandates and technical burden of recipe reformulation

  • Who are the major players in the Breakfast Food Market?

    • Alimento Agro Foods Pvt ltd, Associated British Foods Plc, Aussee Oats Milling Pvt Ltd, B and G Foods Inc., Bobs Red Mill Natural Foods, Conagra Brands Inc., Del Monte Foods Inc., Dr. August Oetker KG, General Mills Inc., Happy Egg Co. USA., Hormel Foods Corp., ITC Ltd., Kellanova, Mars Inc., Nestle SA, PepsiCo Inc., pladis Foods Ltd., The Campbell Co, The Hain Celestial Group, The Kraft Heinz Co. and Unilever PLC

Market Research Insights

  • Market dynamics are increasingly shaped by the erosion of brand loyalty amidst a paradox of choice, compelling incumbents to innovate beyond legacy products. The rise of private label competition, which now accounts for over 20% of shelf space in key categories, has intensified price pressures and forced a greater emphasis on differentiation through personalized nutrition.
  • Brands that successfully leverage direct-to-consumer digital channels see a 15% higher customer retention rate compared to those relying solely on traditional retail. The convenience factor remains paramount, but it is now coupled with demands for sustainable supply chains and functional benefits.
  • This complex environment requires a strategic approach to managing global cereal and dairy supply chains while navigating structural cost inflation and evolving consumer preferences for performance-oriented formats.

We can help! Our analysts can customize this breakfast food market research report to meet your requirements.

Get in touch

1. Executive Summary

1.1 Market overview

Executive Summary - Chart on Market Overview
Executive Summary - Data Table on Market Overview
Executive Summary - Chart on Global Market Characteristics
Executive Summary - Chart on Market by Geography
Executive Summary - Chart on Market Segmentation by Distribution Channel
Executive Summary - Chart on Market Segmentation by Type
Executive Summary - Chart on Market Segmentation by Product
Executive Summary - Chart on Incremental Growth
Executive Summary - Data Table on Incremental Growth
Executive Summary - Chart on Company Market Positioning

2. Technavio Analysis

2.1 Analysis of price sensitivity, lifecycle, customer purchase basket, adoption rates, and purchase criteria

2.2 Criticality of inputs and Factors of differentiation

Chart on Overview on criticality of inputs and factors of differentiation

2.3 Factors of disruption

Chart on Overview on factors of disruption

2.4 Impact of drivers and challenges

Chart on Impact of drivers and challenges in 2025 and 2030

3. Market Landscape

3.1 Market ecosystem

Chart on Parent Market
Data Table on - Parent Market

3.2 Market characteristics

Chart on Market characteristics analysis

3.3 Value chain analysis

Chart on Value chain analysis

4. Market Sizing

4.1 Market definition

Data Table on Offerings of companies included in the market definition

4.2 Market segment analysis

Market segments

4.3 Market size 2025

4.4 Market outlook: Forecast for 2025-2030

Chart on Global - Market size and forecast 2025-2030 ($ million)
Data Table on Global - Market size and forecast 2025-2030 ($ million)
Chart on Global Market: Year-over-year growth 2025-2030 (%)
Data Table on Global Market: Year-over-year growth 2025-2030 (%)

5. Historic Market Size

5.1 Global Breakfast Food Market 2020 - 2024

Historic Market Size - Data Table on Global Breakfast Food Market 2020 - 2024 ($ million)

5.2 Distribution Channel segment analysis 2020 - 2024

Historic Market Size - Distribution Channel Segment 2020 - 2024 ($ million)

5.3 Type segment analysis 2020 - 2024

Historic Market Size - Type Segment 2020 - 2024 ($ million)

5.4 Product segment analysis 2020 - 2024

Historic Market Size - Product Segment 2020 - 2024 ($ million)

5.5 Geography segment analysis 2020 - 2024

Historic Market Size - Geography Segment 2020 - 2024 ($ million)

5.6 Country segment analysis 2020 - 2024

Historic Market Size - Country Segment 2020 - 2024 ($ million)

6. Qualitative Analysis

6.1 Impact of AI in global breakfast food market

6.2 Impact of geopolitical conflict for global breakfast food market

7. Five Forces Analysis

7.1 Five forces summary

Five forces analysis - Comparison between 2025 and 2030

7.2 Bargaining power of buyers

Bargaining power of buyers - Impact of key factors 2025 and 2030

7.3 Bargaining power of suppliers

Bargaining power of suppliers - Impact of key factors in 2025 and 2030

7.4 Threat of new entrants

Threat of new entrants - Impact of key factors in 2025 and 2030

7.5 Threat of substitutes

Threat of substitutes - Impact of key factors in 2025 and 2030

7.6 Threat of rivalry

Threat of rivalry - Impact of key factors in 2025 and 2030

7.7 Market condition

Chart on Market condition - Five forces 2025 and 2030

8. Market Segmentation by Distribution Channel

8.1 Market segments

Chart on Distribution Channel - Market share 2025-2030 (%)
Data Table on Distribution Channel - Market share 2025-2030 (%)

8.2 Comparison by Distribution Channel

Chart on Comparison by Distribution Channel
Data Table on Comparison by Distribution Channel

8.3 Offline - Market size and forecast 2025-2030

Chart on Offline - Market size and forecast 2025-2030 ($ million)
Data Table on Offline - Market size and forecast 2025-2030 ($ million)
Chart on Offline - Year-over-year growth 2025-2030 (%)
Data Table on Offline - Year-over-year growth 2025-2030 (%)

8.4 Online - Market size and forecast 2025-2030

Chart on Online - Market size and forecast 2025-2030 ($ million)
Data Table on Online - Market size and forecast 2025-2030 ($ million)
Chart on Online - Year-over-year growth 2025-2030 (%)
Data Table on Online - Year-over-year growth 2025-2030 (%)

8.5 Market opportunity by Distribution Channel

Market opportunity by Distribution Channel ($ million)
Data Table on Market opportunity by Distribution Channel ($ million)

9. Market Segmentation by Type

9.1 Market segments

Chart on Type - Market share 2025-2030 (%)
Data Table on Type - Market share 2025-2030 (%)

9.2 Comparison by Type

Chart on Comparison by Type
Data Table on Comparison by Type

9.3 Bakery products - Market size and forecast 2025-2030

Chart on Bakery products - Market size and forecast 2025-2030 ($ million)
Data Table on Bakery products - Market size and forecast 2025-2030 ($ million)
Chart on Bakery products - Year-over-year growth 2025-2030 (%)
Data Table on Bakery products - Year-over-year growth 2025-2030 (%)

9.4 Ready meals - Market size and forecast 2025-2030

Chart on Ready meals - Market size and forecast 2025-2030 ($ million)
Data Table on Ready meals - Market size and forecast 2025-2030 ($ million)
Chart on Ready meals - Year-over-year growth 2025-2030 (%)
Data Table on Ready meals - Year-over-year growth 2025-2030 (%)

9.5 Cereals - Market size and forecast 2025-2030

Chart on Cereals - Market size and forecast 2025-2030 ($ million)
Data Table on Cereals - Market size and forecast 2025-2030 ($ million)
Chart on Cereals - Year-over-year growth 2025-2030 (%)
Data Table on Cereals - Year-over-year growth 2025-2030 (%)

9.6 Snack bars - Market size and forecast 2025-2030

Chart on Snack bars - Market size and forecast 2025-2030 ($ million)
Data Table on Snack bars - Market size and forecast 2025-2030 ($ million)
Chart on Snack bars - Year-over-year growth 2025-2030 (%)
Data Table on Snack bars - Year-over-year growth 2025-2030 (%)

9.7 Others - Market size and forecast 2025-2030

Chart on Others - Market size and forecast 2025-2030 ($ million)
Data Table on Others - Market size and forecast 2025-2030 ($ million)
Chart on Others - Year-over-year growth 2025-2030 (%)
Data Table on Others - Year-over-year growth 2025-2030 (%)

9.8 Market opportunity by Type

Market opportunity by Type ($ million)
Data Table on Market opportunity by Type ($ million)

10. Market Segmentation by Product

10.1 Market segments

Chart on Product - Market share 2025-2030 (%)
Data Table on Product - Market share 2025-2030 (%)

10.2 Comparison by Product

Chart on Comparison by Product
Data Table on Comparison by Product

10.3 RTE - Market size and forecast 2025-2030

Chart on RTE - Market size and forecast 2025-2030 ($ million)
Data Table on RTE - Market size and forecast 2025-2030 ($ million)
Chart on RTE - Year-over-year growth 2025-2030 (%)
Data Table on RTE - Year-over-year growth 2025-2030 (%)

10.4 RTC - Market size and forecast 2025-2030

Chart on RTC - Market size and forecast 2025-2030 ($ million)
Data Table on RTC - Market size and forecast 2025-2030 ($ million)
Chart on RTC - Year-over-year growth 2025-2030 (%)
Data Table on RTC - Year-over-year growth 2025-2030 (%)

10.5 Market opportunity by Product

Market opportunity by Product ($ million)
Data Table on Market opportunity by Product ($ million)

11. Customer Landscape

11.1 Customer landscape overview

Analysis of price sensitivity, lifecycle, customer purchase basket, adoption rates, and purchase criteria

12. Geographic Landscape

12.1 Geographic segmentation

Chart on Market share by geography 2025-2030 (%)
Data Table on Market share by geography 2025-2030 (%)

12.2 Geographic comparison

Chart on Geographic comparison
Data Table on Geographic comparison

12.3 North America - Market size and forecast 2025-2030

Chart on North America - Market size and forecast 2025-2030 ($ million)
Data Table on North America - Market size and forecast 2025-2030 ($ million)
Chart on North America - Year-over-year growth 2025-2030 (%)
Data Table on North America - Year-over-year growth 2025-2030 (%)
Chart on Regional Comparison - North America
Data Table on Regional Comparison - North America

12.3.1 US - Market size and forecast 2025-2030

Chart on US - Market size and forecast 2025-2030 ($ million)
Data Table on US - Market size and forecast 2025-2030 ($ million)
Chart on US - Year-over-year growth 2025-2030 (%)
Data Table on US - Year-over-year growth 2025-2030 (%)

12.3.2 Canada - Market size and forecast 2025-2030

Chart on Canada - Market size and forecast 2025-2030 ($ million)
Data Table on Canada - Market size and forecast 2025-2030 ($ million)
Chart on Canada - Year-over-year growth 2025-2030 (%)
Data Table on Canada - Year-over-year growth 2025-2030 (%)

12.3.3 Mexico - Market size and forecast 2025-2030

Chart on Mexico - Market size and forecast 2025-2030 ($ million)
Data Table on Mexico - Market size and forecast 2025-2030 ($ million)
Chart on Mexico - Year-over-year growth 2025-2030 (%)
Data Table on Mexico - Year-over-year growth 2025-2030 (%)

12.4 Europe - Market size and forecast 2025-2030

Chart on Europe - Market size and forecast 2025-2030 ($ million)
Data Table on Europe - Market size and forecast 2025-2030 ($ million)
Chart on Europe - Year-over-year growth 2025-2030 (%)
Data Table on Europe - Year-over-year growth 2025-2030 (%)
Chart on Regional Comparison - Europe
Data Table on Regional Comparison - Europe

12.4.1 Germany - Market size and forecast 2025-2030

Chart on Germany - Market size and forecast 2025-2030 ($ million)
Data Table on Germany - Market size and forecast 2025-2030 ($ million)
Chart on Germany - Year-over-year growth 2025-2030 (%)
Data Table on Germany - Year-over-year growth 2025-2030 (%)

12.4.2 UK - Market size and forecast 2025-2030

Chart on UK - Market size and forecast 2025-2030 ($ million)
Data Table on UK - Market size and forecast 2025-2030 ($ million)
Chart on UK - Year-over-year growth 2025-2030 (%)
Data Table on UK - Year-over-year growth 2025-2030 (%)

12.4.3 France - Market size and forecast 2025-2030

Chart on France - Market size and forecast 2025-2030 ($ million)
Data Table on France - Market size and forecast 2025-2030 ($ million)
Chart on France - Year-over-year growth 2025-2030 (%)
Data Table on France - Year-over-year growth 2025-2030 (%)

12.4.4 Italy - Market size and forecast 2025-2030

Chart on Italy - Market size and forecast 2025-2030 ($ million)
Data Table on Italy - Market size and forecast 2025-2030 ($ million)
Chart on Italy - Year-over-year growth 2025-2030 (%)
Data Table on Italy - Year-over-year growth 2025-2030 (%)

12.4.5 Spain - Market size and forecast 2025-2030

Chart on Spain - Market size and forecast 2025-2030 ($ million)
Data Table on Spain - Market size and forecast 2025-2030 ($ million)
Chart on Spain - Year-over-year growth 2025-2030 (%)
Data Table on Spain - Year-over-year growth 2025-2030 (%)

12.4.6 The Netherlands - Market size and forecast 2025-2030

Chart on The Netherlands - Market size and forecast 2025-2030 ($ million)
Data Table on The Netherlands - Market size and forecast 2025-2030 ($ million)
Chart on The Netherlands - Year-over-year growth 2025-2030 (%)
Data Table on The Netherlands - Year-over-year growth 2025-2030 (%)

12.5 APAC - Market size and forecast 2025-2030

Chart on APAC - Market size and forecast 2025-2030 ($ million)
Data Table on APAC - Market size and forecast 2025-2030 ($ million)
Chart on APAC - Year-over-year growth 2025-2030 (%)
Data Table on APAC - Year-over-year growth 2025-2030 (%)
Chart on Regional Comparison - APAC
Data Table on Regional Comparison - APAC

12.5.1 China - Market size and forecast 2025-2030

Chart on China - Market size and forecast 2025-2030 ($ million)
Data Table on China - Market size and forecast 2025-2030 ($ million)
Chart on China - Year-over-year growth 2025-2030 (%)
Data Table on China - Year-over-year growth 2025-2030 (%)

12.5.2 India - Market size and forecast 2025-2030

Chart on India - Market size and forecast 2025-2030 ($ million)
Data Table on India - Market size and forecast 2025-2030 ($ million)
Chart on India - Year-over-year growth 2025-2030 (%)
Data Table on India - Year-over-year growth 2025-2030 (%)

12.5.3 Japan - Market size and forecast 2025-2030

Chart on Japan - Market size and forecast 2025-2030 ($ million)
Data Table on Japan - Market size and forecast 2025-2030 ($ million)
Chart on Japan - Year-over-year growth 2025-2030 (%)
Data Table on Japan - Year-over-year growth 2025-2030 (%)

12.5.4 South Korea - Market size and forecast 2025-2030

Chart on South Korea - Market size and forecast 2025-2030 ($ million)
Data Table on South Korea - Market size and forecast 2025-2030 ($ million)
Chart on South Korea - Year-over-year growth 2025-2030 (%)
Data Table on South Korea - Year-over-year growth 2025-2030 (%)

12.5.5 Australia - Market size and forecast 2025-2030

Chart on Australia - Market size and forecast 2025-2030 ($ million)
Data Table on Australia - Market size and forecast 2025-2030 ($ million)
Chart on Australia - Year-over-year growth 2025-2030 (%)
Data Table on Australia - Year-over-year growth 2025-2030 (%)

12.5.6 Indonesia - Market size and forecast 2025-2030

Chart on Indonesia - Market size and forecast 2025-2030 ($ million)
Data Table on Indonesia - Market size and forecast 2025-2030 ($ million)
Chart on Indonesia - Year-over-year growth 2025-2030 (%)
Data Table on Indonesia - Year-over-year growth 2025-2030 (%)

12.6 Middle East and Africa - Market size and forecast 2025-2030

Chart on Middle East and Africa - Market size and forecast 2025-2030 ($ million)
Data Table on Middle East and Africa - Market size and forecast 2025-2030 ($ million)
Chart on Middle East and Africa - Year-over-year growth 2025-2030 (%)
Data Table on Middle East and Africa - Year-over-year growth 2025-2030 (%)
Chart on Regional Comparison - Middle East and Africa
Data Table on Regional Comparison - Middle East and Africa

12.6.1 Saudi Arabia - Market size and forecast 2025-2030

Chart on Saudi Arabia - Market size and forecast 2025-2030 ($ million)
Data Table on Saudi Arabia - Market size and forecast 2025-2030 ($ million)
Chart on Saudi Arabia - Year-over-year growth 2025-2030 (%)
Data Table on Saudi Arabia - Year-over-year growth 2025-2030 (%)

12.6.2 UAE - Market size and forecast 2025-2030

Chart on UAE - Market size and forecast 2025-2030 ($ million)
Data Table on UAE - Market size and forecast 2025-2030 ($ million)
Chart on UAE - Year-over-year growth 2025-2030 (%)
Data Table on UAE - Year-over-year growth 2025-2030 (%)

12.6.3 South Africa - Market size and forecast 2025-2030

Chart on South Africa - Market size and forecast 2025-2030 ($ million)
Data Table on South Africa - Market size and forecast 2025-2030 ($ million)
Chart on South Africa - Year-over-year growth 2025-2030 (%)
Data Table on South Africa - Year-over-year growth 2025-2030 (%)

12.6.4 Turkey - Market size and forecast 2025-2030

Chart on Turkey - Market size and forecast 2025-2030 ($ million)
Data Table on Turkey - Market size and forecast 2025-2030 ($ million)
Chart on Turkey - Year-over-year growth 2025-2030 (%)
Data Table on Turkey - Year-over-year growth 2025-2030 (%)

12.6.5 Israel - Market size and forecast 2025-2030

Chart on Israel - Market size and forecast 2025-2030 ($ million)
Data Table on Israel - Market size and forecast 2025-2030 ($ million)
Chart on Israel - Year-over-year growth 2025-2030 (%)
Data Table on Israel - Year-over-year growth 2025-2030 (%)

12.7 South America - Market size and forecast 2025-2030

Chart on South America - Market size and forecast 2025-2030 ($ million)
Data Table on South America - Market size and forecast 2025-2030 ($ million)
Chart on South America - Year-over-year growth 2025-2030 (%)
Data Table on South America - Year-over-year growth 2025-2030 (%)
Chart on Regional Comparison - South America
Data Table on Regional Comparison - South America

12.7.1 Brazil - Market size and forecast 2025-2030

Chart on Brazil - Market size and forecast 2025-2030 ($ million)
Data Table on Brazil - Market size and forecast 2025-2030 ($ million)
Chart on Brazil - Year-over-year growth 2025-2030 (%)
Data Table on Brazil - Year-over-year growth 2025-2030 (%)

12.7.2 Argentina - Market size and forecast 2025-2030

Chart on Argentina - Market size and forecast 2025-2030 ($ million)
Data Table on Argentina - Market size and forecast 2025-2030 ($ million)
Chart on Argentina - Year-over-year growth 2025-2030 (%)
Data Table on Argentina - Year-over-year growth 2025-2030 (%)

12.7.3 Chile - Market size and forecast 2025-2030

Chart on Chile - Market size and forecast 2025-2030 ($ million)
Data Table on Chile - Market size and forecast 2025-2030 ($ million)
Chart on Chile - Year-over-year growth 2025-2030 (%)
Data Table on Chile - Year-over-year growth 2025-2030 (%)

12.8 Market opportunity by geography

Market opportunity by geography ($ million)
Data Tables on Market opportunity by geography ($ million)

13. Drivers, Challenges, and Opportunity

13.1 Market drivers

Mainstreaming of functional convenience and industrialization of on-the-go nutritive solutions
Proliferation of personalized nutrition and strategic rise of clean-label and ancient grain formulations
Evolution of plant-based breakfast ecosystems and strategic adoption of sustainable and ethical sourcing

13.2 Market challenges

Convergence of regulatory nutri-score mandates and technical burden of recipe reformulation
Structural cost inflation and fragility of global cereal and dairy supply chains
Erosion of brand loyalty amidst paradox of choice and rise of private label competition

13.3 Impact of drivers and challenges

Impact of drivers and challenges in 2025 and 2030

13.4 Market opportunities

Institutionalization of high-protein functionalism and proliferation of performance-oriented formats
Strategic integration of ancient grains and rise of climate-resilient cereal ecosystems
Proliferation of smart-kitchen integration and evolution of hyper-convenient hybrid meal kits

14. Competitive Landscape

14.1 Overview

14.2

Overview on criticality of inputs and factors of differentiation

14.3 Landscape disruption

Overview on factors of disruption

14.4 Industry risks

Impact of key risks on business

15. Competitive Analysis

15.1 Companies profiled

Companies covered

15.2 Company ranking index

15.3 Market positioning of companies

Matrix on companies position and classification

15.4 Associated British Foods Plc

Associated British Foods Plc - Overview
Associated British Foods Plc - Business segments
Associated British Foods Plc - Key offerings
Associated British Foods Plc - Segment focus
SWOT

15.5 B and G Foods Inc.

B and G Foods Inc. - Overview
B and G Foods Inc. - Business segments
B and G Foods Inc. - Key offerings
B and G Foods Inc. - Segment focus
SWOT

15.6 Conagra Brands Inc.

Conagra Brands Inc. - Overview
Conagra Brands Inc. - Business segments
Conagra Brands Inc. - Key offerings
Conagra Brands Inc. - Segment focus
SWOT

15.7 General Mills Inc.

General Mills Inc. - Overview
General Mills Inc. - Business segments
General Mills Inc. - Key offerings
General Mills Inc. - Segment focus
SWOT

15.8 Hormel Foods Corp.

Hormel Foods Corp. - Overview
Hormel Foods Corp. - Business segments
Hormel Foods Corp. - Key offerings
Hormel Foods Corp. - Segment focus
SWOT

15.9 ITC Ltd.

ITC Ltd. - Overview
ITC Ltd. - Business segments
ITC Ltd. - Key offerings
ITC Ltd. - Segment focus
SWOT

15.10 Kellanova

Kellanova - Overview
Kellanova - Business segments
Kellanova - Key offerings
Kellanova - Segment focus
SWOT

15.11 Mars Inc.

Mars Inc. - Overview
Mars Inc. - Product / Service
Mars Inc. - Key offerings
SWOT

15.12 Nestle SA

Nestle SA - Overview
Nestle SA - Business segments
Nestle SA - Key news
Nestle SA - Key offerings
Nestle SA - Segment focus
SWOT

15.13 PepsiCo Inc.

PepsiCo Inc. - Overview
PepsiCo Inc. - Business segments
PepsiCo Inc. - Key news
PepsiCo Inc. - Key offerings
PepsiCo Inc. - Segment focus
SWOT

15.14 pladis Foods Ltd.

pladis Foods Ltd. - Overview
pladis Foods Ltd. - Product / Service
pladis Foods Ltd. - Key offerings
SWOT

15.15 The Campbell Co

The Campbell Co - Overview
The Campbell Co - Business segments
The Campbell Co - Key news
The Campbell Co - Key offerings
The Campbell Co - Segment focus
SWOT

15.16 The Hain Celestial Group

The Hain Celestial Group - Overview
The Hain Celestial Group - Business segments
The Hain Celestial Group - Key offerings
The Hain Celestial Group - Segment focus
SWOT

15.17 The Kraft Heinz Co.

The Kraft Heinz Co. - Overview
The Kraft Heinz Co. - Business segments
The Kraft Heinz Co. - Key news
The Kraft Heinz Co. - Key offerings
The Kraft Heinz Co. - Segment focus
SWOT

15.18 Unilever PLC

Unilever PLC - Overview
Unilever PLC - Business segments
Unilever PLC - Key offerings
Unilever PLC - Segment focus
SWOT

16. Appendix

16.1 Scope of the report

Market definition
Objectives
Notes and caveats

16.2 Inclusions and exclusions checklist

Inclusions checklist
Exclusions checklist

16.3 Currency conversion rates for US$

16.4 Research methodology

16.5 Data procurement

Information sources

16.6 Data validation

16.7 Validation techniques employed for market sizing

16.8 Data synthesis

16.9 360 degree market analysis

16.10 List of abbreviations

Research Methodology

Technavio presents a detailed picture of the market by way of study, synthesis, and summation of data from multiple sources. The analysts have presented the various facets of the market with a particular focus on identifying the key industry influencers. The data thus presented is comprehensive, reliable, and the result of extensive research, both primary and secondary.

INFORMATION SOURCES

Primary sources

  • Manufacturers and suppliers
  • Channel partners
  • Industry experts
  • Strategic decision makers

Secondary sources

  • Industry journals and periodicals
  • Government data
  • Financial reports of key industry players
  • Historical data
  • Press releases

DATA ANALYSIS

Data Synthesis

  • Collation of data
  • Estimation of key figures
  • Analysis of derived insights

Data Validation

  • Triangulation with data models
  • Reference against proprietary databases
  • Corroboration with industry experts

REPORT WRITING

Qualitative

  • Market drivers
  • Market challenges
  • Market trends
  • Five forces analysis

Quantitative

  • Market size and forecast
  • Market segmentation
  • Geographical insights
  • Competitive landscape

Interested in this report?

Get your sample now to see our research methodology and insights!

Download Now

Frequently Asked Questions

Breakfast Food market growth will increase by USD 115608.7 million during 2026-2030.

The Breakfast Food market is expected to grow at a CAGR of 4.4% during 2026-2030.

Breakfast Food market is segmented by Distribution channel (Offline, Online) Type (Bakery products, Ready meals, Cereals, Snack bars, Others) Product (RTE, RTC)

Alimento Agro Foods Pvt ltd, Associated British Foods Plc, Aussee Oats Milling Pvt Ltd, B and G Foods Inc., Bobs Red Mill Natural Foods, Conagra Brands Inc., Del Monte Foods Inc., Dr. August Oetker KG, General Mills Inc., Happy Egg Co. USA., Hormel Foods Corp., ITC Ltd., Kellanova, Mars Inc., Nestle SA, PepsiCo Inc., pladis Foods Ltd., The Campbell Co, The Hain Celestial Group, The Kraft Heinz Co., Unilever PLC are a few of the key vendors in the Breakfast Food market.

APAC will register the highest growth rate of 33.4% among the other regions. Therefore, the Breakfast Food market in APAC is expected to garner significant business opportunities for the vendors during the forecast period.

US, Canada, Mexico, Germany, UK, France, Italy, Spain, The Netherlands, China, India, Japan, South Korea, Australia, Indonesia, Saudi Arabia, UAE, South Africa, Turkey, Israel, Brazil, Argentina, Chile

  • Mainstreaming of functional convenience and industrialization of on-the-go nutritive solutions is the driving factor this market.

The Breakfast Food market vendors should focus on grabbing business opportunities from the Distribution channel segment as it accounted for the largest market share in the base year.