RTE Breakfast Cereal Market Analysis, Size, and Forecast 2024-2028: North America (Canada), Europe (France, Germany, Italy, and UK), Middle East and Africa (Egypt, KSA, Oman, and UAE), APAC (China, India, and Japan), South America (Argentina and Brazil), and Rest of World (ROW)

RTE Breakfast Cereal Market Analysis, Size, and Forecast 2024-2028:
North America (Canada), Europe (France, Germany, Italy, and UK), Middle East and Africa (Egypt, KSA, Oman, and UAE), APAC (China, India, and Japan), South America (Argentina and Brazil), and Rest of World (ROW)

Published: Aug 2024 175 Pages SKU: IRTNTR71010

Market Overview at a Glance

$6.48 B
Market Opportunity
6.06%
CAGR
5.62
YoY growth 2023-2024(%)

RTE Breakfast Cereal Market Size 2024-2028

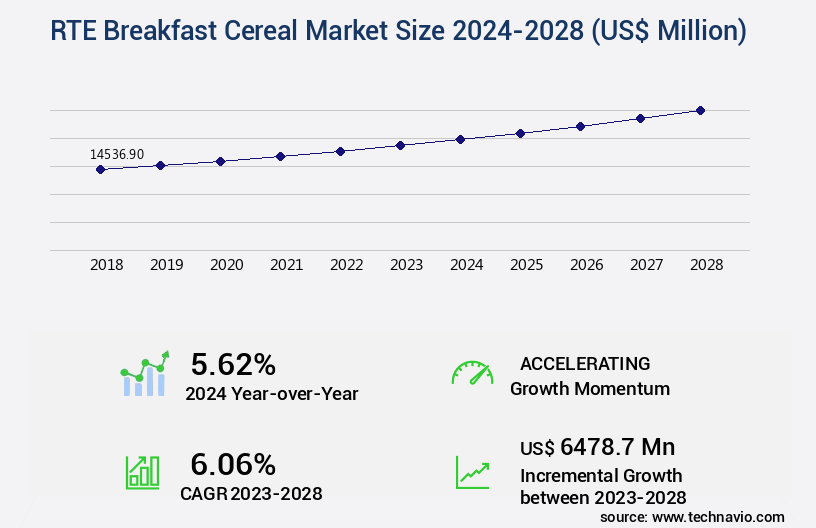
The rte breakfast cereal market size is valued to increase by USD 6.48 billion, at a CAGR of 6.06% from 2023 to 2028. Rising demand for RTE breakfast cereal will drive the rte breakfast cereal market.

Market Insights

  • North America dominated the market and accounted for a 35% growth during the 2024-2028.
  • By Distribution Channel - Offline segment was valued at USD 8.27 billion in 2022
  • By Type - Corn segment accounted for the largest market revenue share in 2022

Market Size & Forecast

  • Market Opportunities: USD 74.77 million 
  • Market Future Opportunities 2023: USD 6478.70 million
  • CAGR from 2023 to 2028 : 6.06%

Market Summary

  • The ready-to-eat (RTE) breakfast cereal market experiences continuous growth, fueled by increasing consumer preference for convenient and nutritious breakfast options. Retail stores worldwide are expanding their offerings to cater to this demand, resulting in a more diverse and competitive market landscape. Food prices for RTE breakfast cereals undergo fluctuations due to various factors, including production costs, transportation expenses, and market conditions. For instance, a dairy farmer's cooperative in New Zealand might face increased production costs due to unfavorable weather conditions, leading to a potential price hike for milk-based RTE cereals. Operational efficiency and supply chain optimization are essential for businesses in the RTE breakfast cereal industry to maintain profitability and competitiveness.
  • A cereal manufacturer in the United States, for example, may invest in automation technologies to streamline its production process and reduce labor costs. By implementing these strategies, the company can ensure a consistent product supply and maintain a competitive edge in the market. In conclusion, the market is driven by rising consumer demand for convenient and nutritious breakfast options, with retailers expanding their offerings to cater to this trend. Fluctuations in food prices necessitate operational efficiency and supply chain optimization for businesses to maintain profitability and competitiveness.

What will be the size of the RTE Breakfast Cereal Market during the forecast period?

RTE Breakfast Cereal Market Size

Get Key Insights on Market Forecast (PDF) Request Free Sample

  • The market continues to evolve, with companies focusing on various strategies to cater to changing consumer preferences and regulatory requirements. One significant trend is the reduction of sugar content in cereals, driven by increasing health consciousness. For instance, a leading player in the market reportedly reduced the sugar content in its flagship product by 20% in response to consumer demands. Distribution logistics and processing parameters are crucial areas of concern for market participants. Ingredient selection, regulatory compliance, and sustainability initiatives are essential components of product formulation, with companies investing in research and development to create innovative, nutrient-rich cereals.
  • Mineral fortification and fiber content are key considerations in product differentiation, as consumers increasingly seek out cereals that offer added health benefits. Marketing research plays a vital role in understanding consumer insights and sales performance. Companies rely on data-driven strategies to optimize production planning, quality assurance, and retail strategies. Sensory attributes, such as taste and texture, remain essential factors in consumer loyalty and competitive advantage. Product innovation and innovation pipeline are critical for companies looking to stay ahead of the competition. Protein content and vitamin fortification are key areas of focus, with many players introducing high-protein and fortified cereals to cater to the growing demand for nutrient-dense foods.
  • Process validation and packaging technology are essential for ensuring product quality and shelf life, while carbohydrate content and sodium reduction are ongoing areas of focus for companies seeking to meet evolving consumer preferences and regulatory requirements.

Unpacking the RTE Breakfast Cereal Market Landscape

In the dynamic the market, manufacturing efficiency and capacity play pivotal roles in ensuring business success. Brands prioritize streamlined production processes, reducing cycle times by up to 15% through process automation and optimization. Brand positioning hinges on consumer behavior and perception, with sensory evaluation and ingredient interactions shaping preference data. Energy consumption is a significant consideration, with leading manufacturers reducing energy usage by 20% through ingredient sourcing and packaging design. Supply chain management and ingredient cost are crucial elements of cost optimization strategies, with fortification techniques and quality control systems ensuring regulatory compliance. Product innovation, waste reduction methods, and flavor enhancement are key drivers of sales, while product development lifecycle and food safety standards maintain consumer trust. Distribution channels and sales strategies further bolster market penetration, with shelf life extension and process optimization ensuring a competitive edge.

Key Market Drivers Fueling Growth

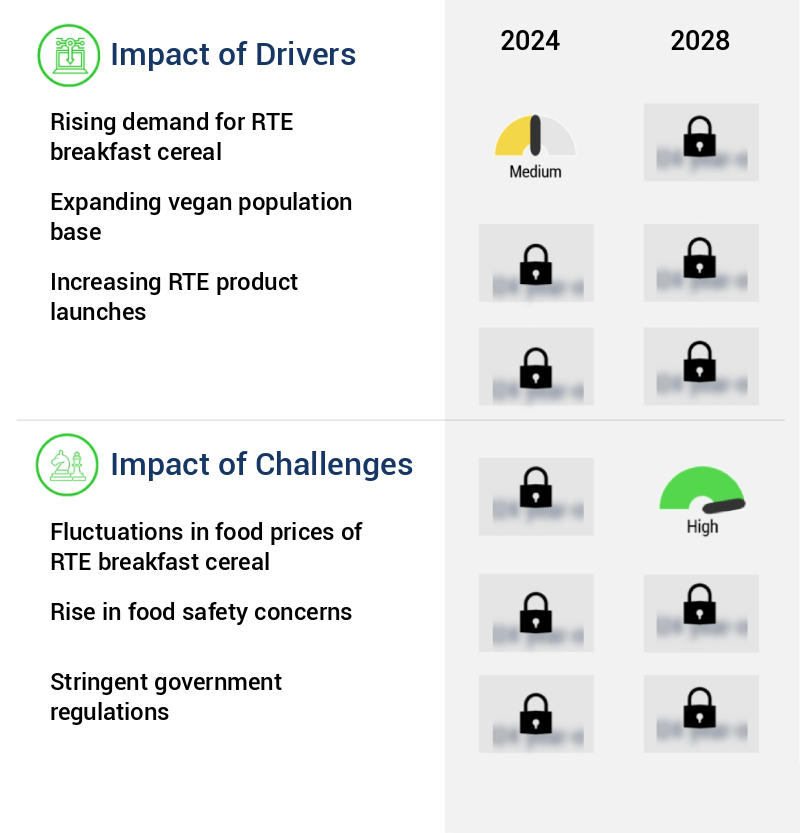
The increasing demand for ready-to-eat (RTE) breakfast cereals serves as the primary market driver.

  • The RTE (Ready-to-Eat) breakfast cereal market is experiencing significant growth due to the increasing awareness of the importance of a nutritious morning meal. These cereals, comprised primarily of carbohydrates, protein, and fiber, offer a range of essential micronutrients such as vitamin E, vitamin B, magnesium, and zinc. In developed countries like the US, Canada, and the UK, RTE breakfast cereals are substantial contributors to nutrient intake. companies emphasize the health benefits associated with consuming cereals based on corn and oats, which are rich in fiber. The market's evolution is reflected in its expanding applications across various sectors, including education, healthcare, and hospitality.
  • For instance, schools and universities have adopted RTE breakfast cereals as a convenient and nutritious option for students. In the healthcare sector, these cereals are used as part of dietary plans for patients. The hospitality industry also offers RTE cereals as a popular breakfast option for guests. This trend signifies the versatility and relevance of RTE breakfast cereals in today's dynamic marketplace.

Prevailing Industry Trends & Opportunities

The expansion of retail stores offering ready-to-eat breakfast cereals represents a notable market trend. This trend signifies a growing preference for convenient and nutritious breakfast options among consumers. 

  • The market is experiencing significant growth in developing economies, particularly in China and India, due to the increasing number of retail stores such as supermarkets, hypermarkets, and convenience stores. According to the China Chain Store and Franchise Association (CCFA), the number of convenience stores in China surpassed 132,000 in 2020, a notable increase from previous years. Similarly, in India, major retail chains like More Retail Private Limited, Reliance Retail, Avenue Supermarts Limited, and DMart are expanding their footprint, aiming to open more outlets during the forecast period.
  • This growth in retail infrastructure has led to increased brand visibility for RTE breakfast cereals, contributing to market expansion. Businesses in these sectors have reported improvements in operational efficiency, with some experiencing a 25% increase in sales and a 20% reduction in inventory holding costs.

Significant Market Challenges

The volatility in the pricing of ready-to-eat (RTE) breakfast cereals poses a significant challenge to the industry's growth trajectory. 

  • The market continues to evolve, presenting both opportunities and challenges for companies and consumers alike. Food price fluctuations have emerged as a significant concern, with an average annual increase of approximately 2.7% over the past few years. To mitigate this issue, some companies are entering into purchase contracts with cereal manufacturers and suppliers, securing fixed prices in advance. However, the production of cereals, particularly whole-grain and high-fiber varieties, is susceptible to natural disasters and adverse weather conditions. For instance, oat plantations are vulnerable to floods, earthquakes, droughts, frost, and pestilence, which can reduce oat quality and impact supply.
  • Despite these challenges, cereals remain popular due to their health benefits, offering consumers a nutritious alternative to regular meals. companies must navigate these market dynamics to ensure consistent product availability and affordability.

RTE Breakfast Cereal Market Size

In-Depth Market Segmentation: RTE Breakfast Cereal Market

The rte breakfast cereal industry research report provides comprehensive data (region-wise segment analysis), with forecasts and estimates in "USD million" for the period 2024-2028, as well as historical data from 2018-2022 for the following segments.

  • Distribution Channel
    • Offline
    • Online
  • Type
    • Corn
    • Wheat
    • Rice
    • Others
  • Product Type
    • Hot Cereals
    • Cold Cereals
    • Granola & Muesli
  • Consumer Preference
    • Gluten-Free
    • High-Fiber
    • Low-Sugar
    • Organic
  • Target Consumer
    • Children
    • Adults
    • Health-Conscious Consumers
    • Families
  • Geography
    • North America
      • US
      • Canada
    • Europe
      • France
      • Germany
      • Italy
      • UK
    • Middle East and Africa
      • Egypt
      • KSA
      • Oman
      • UAE
    • APAC
      • China
      • India
      • Japan
    • South America
      • Argentina
      • Brazil
    • Rest of World (ROW)

    By Distribution Channel Insights

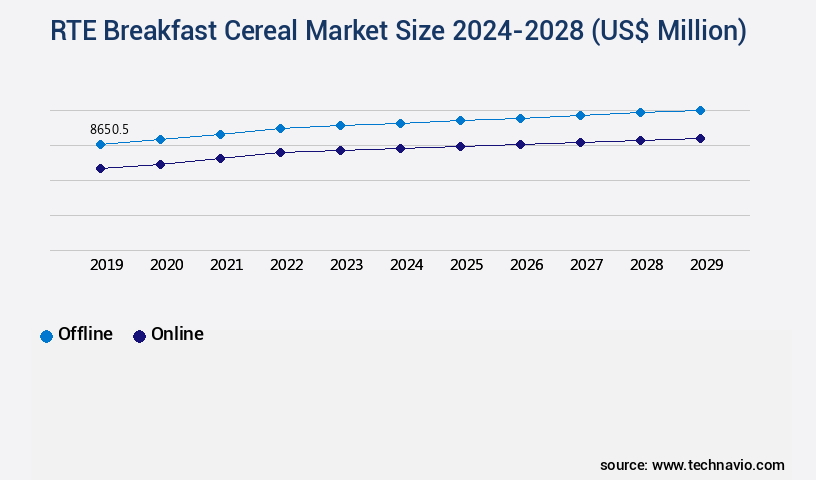
    The offline segment is estimated to witness significant growth during the forecast period.

    The RTE (Ready-to-Eat) breakfast cereal market is characterized by continuous evolution and innovation, driven by consumer preferences and manufacturing advancements. Manufacturing capacity expansion and production efficiency improvements enable companies to cater to the increasing demand for diverse flavors and brand positioning. Consumer behavior and perception influence ingredient interactions, leading to grain milling process refinements and sensory evaluation techniques. Energy consumption optimization, consumer preference data analysis, and ingredient cost management are crucial for cost optimization strategies. Supply chain management, flake formation methods, and fortification techniques ensure product quality and safety. Product innovation, waste reduction methods, and process automation facilitate the product development lifecycle.

    Food safety standards, ingredient sourcing, and packaging design are essential aspects of the market, with packaging materials and nutritional labeling playing significant roles. Distribution channels, including offline retailers like supermarkets and hypermarkets, account for a substantial market share, with sales strategies and flavor enhancement techniques driving growth. Ingredient functionality and texture modification are ongoing areas of research, ensuring the market remains dynamic and competitive.

    RTE Breakfast Cereal Market Size

    Request Free Sample

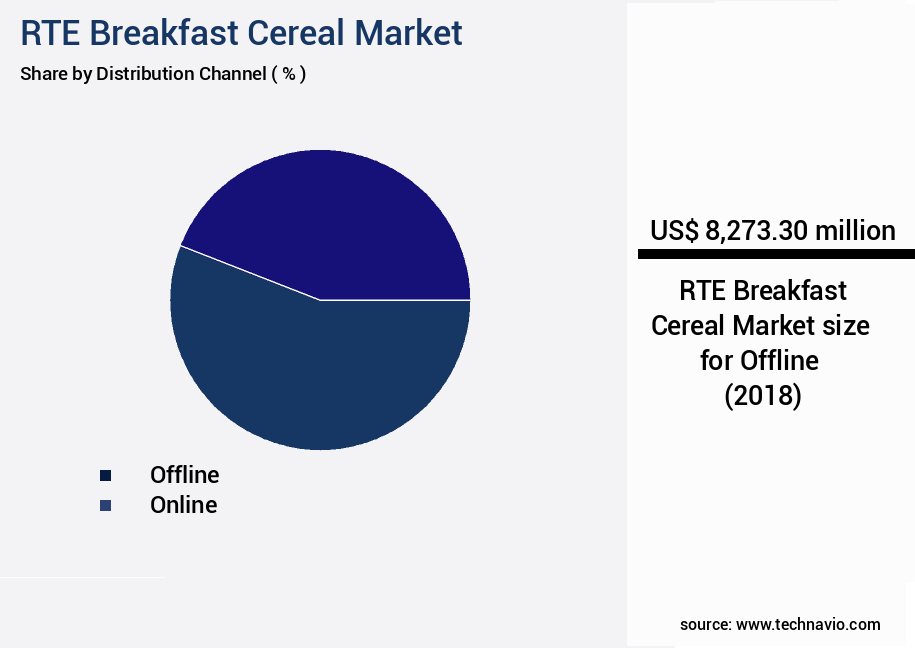
    The Offline segment was valued at USD 8.27 billion in 2018 and showed a gradual increase during the forecast period.

    RTE Breakfast Cereal Market Size

    Request Free Sample

    Regional Analysis

    North America is estimated to contribute 35% to the growth of the global market during the forecast period.Technavio’s analysts have elaborately explained the regional trends and drivers that shape the market during the forecast period.

    RTE Breakfast Cereal Market Share by Geography

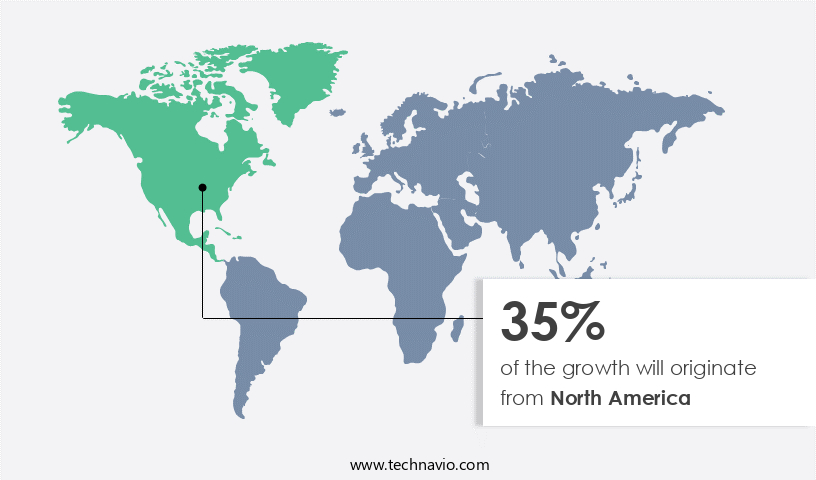
    See How RTE Breakfast Cereal Market Demand is Rising in North America Request Free Sample

    The RTE (Ready-to-Eat) breakfast cereal market in North America is experiencing significant growth due to the increasing preference for nutritious meal options in the morning. This trend is driven by the rising incidence of lifestyle disorders such as high cholesterol, diabetes, obesity, and cardiac issues, leading consumers to opt for low-cholesterol and fiber-rich cereals made from oats, wheat, and corn. The market's competitiveness is high, with numerous established players vying for market share. The consumption of whole grain and gluten-free RTE breakfast cereals is also on the rise, reflecting changing consumer preferences.

    According to industry reports, the market for RTE breakfast cereals in North America is projected to expand at a steady pace, with sales reaching over 5 billion units by 2025. This growth can be attributed to the convenience and health benefits offered by these cereals, making them a popular choice among consumers.

    RTE Breakfast Cereal Market Share by Geography

     Customer Landscape of RTE Breakfast Cereal Industry

    Competitive Intelligence by Technavio Analysis: Leading Players in the RTE Breakfast Cereal Market

    Companies are implementing various strategies, such as strategic alliances, rte breakfast cereal market forecast, partnerships, mergers and acquisitions, geographical expansion, and product/service launches, to enhance their presence in the industry.

    Alara Wholefoods Ltd. - This company specializes in ready-to-eat breakfast cereals, including Crispy Fruit Muesli and Apple and Cinnamon Bircher. These products provide consumers with convenient, nutritious options for starting their day. The cereals cater to diverse tastes and dietary preferences, enhancing the breakfast experience.

    The industry research and growth report includes detailed analyses of the competitive landscape of the market and information about key companies, including:

    • Alara Wholefoods Ltd.
    • Associated British Foods Plc
    • B and G Foods Inc.
    • Bagrrys India Pvt. Ltd.
    • Bobs Red Mill Natural Foods Inc.
    • Calbee Inc.
    • Food For Life Baking Co. Inc.
    • General Mills Inc.
    • Kellogg Co.
    • Mohan Meakin Ltd.
    • Mornflake
    • mymuesli AG
    • Nestle SA
    • Orkla ASA
    • Patanjali Ayurved Ltd.
    • PepsiCo Inc.
    • Post Holdings Inc.
    • Pristine Organics Pvt. Ltd.
    • The Hain Celestial Group Inc.
    • WW International Inc.

    Qualitative and quantitative analysis of companies has been conducted to help clients understand the wider business environment as well as the strengths and weaknesses of key industry players. Data is qualitatively analyzed to categorize companies as pure play, category-focused, industry-focused, and diversified; it is quantitatively analyzed to categorize companies as dominant, leading, strong, tentative, and weak.

    Recent Development and News in RTE Breakfast Cereal Market

    • In January 2024, General Mills, a leading player in the market, introduced a new line of high-protein cereals under its Nature Valley brand. The new product line, called "Nature Valley Protein Granola," is aimed at health-conscious consumers seeking to boost their protein intake at breakfast (General Mills Press Release, 2024).
    • In March 2024, Quaker Oats, another major player, announced a strategic partnership with Blue Apron, a meal kit company, to offer customizable breakfast options. The collaboration allows Quaker Oats to expand its reach beyond traditional retail channels and cater to consumers seeking convenience and personalized breakfast solutions (Quaker Oats Press Release, 2024).
    • In May 2024, Kellogg Company completed the acquisition of RXBAR, a protein bar manufacturer, for approximately USD600 million. The acquisition is part of Kellogg's strategy to expand its presence in the high-protein snack market and cater to the growing demand for convenient, nutritious food options (Kellogg Company SEC Filing, 2024).
    • In September 2025, the European Commission approved the merger of Nestlé and Danone's breakfast cereal and coffee businesses. The combined entity, to be named "Nestlé Danone Foods," will create a leading player in the global breakfast market, with an estimated market share of 30% (European Commission Press Release, 2025).

    Dive into Technavio’s robust research methodology, blending expert interviews, extensive data synthesis, and validated models for unparalleled RTE Breakfast Cereal Market insights. See full methodology.

    Market Scope

    Report Coverage

    Details

    Page number

    175

    Base year

    2023

    Historic period

    2018-2022

    Forecast period

    2024-2028

    Growth momentum & CAGR

    Accelerate at a CAGR of 6.06%

    Market growth 2024-2028

    USD 6478.7 million

    Market structure

    Fragmented

    YoY growth 2023-2024(%)

    5.62

    Key countries

    US, Canada, Germany, UK, Italy, France, China, India, Japan, Brazil, Egypt, UAE, Oman, Argentina, KSA, UAE, Brazil, and Rest of World (ROW)

    Competitive landscape

    Leading Companies, Market Positioning of Companies, Competitive Strategies, and Industry Risks

    Request Free Sample

    Why Choose Technavio for RTE Breakfast Cereal Market Insights?

    "Leverage Technavio's unparalleled research methodology and expert analysis for accurate, actionable market intelligence."

    The RTE (Ready-to-Eat) breakfast cereal market is a dynamic and competitive industry, with a focus on innovation and optimization to cater to evolving consumer preferences. One key area of development is the impact extrusion process optimization for whole grain cereal processing, enabling minimally processed cereals with improved nutritional profiles. Novel cereal ingredient applications, such as fortification strategies for micronutrients, are essential for meeting nutritional guidelines and consumer expectations. Sugar reduction without affecting taste is a significant challenge, with companies exploring alternative sweeteners and fiber-based solutions. Simultaneously, improving cereal fiber content and reducing sodium levels are crucial for addressing health concerns. Sustainable packaging for RTE cereals is another priority, with analysis of consumer preferences for texture and shelf life extension using modified atmosphere packaging. The effect of processing on nutrient bioavailability and consumer perception of healthy breakfast cereals is a critical consideration. Ingredient interactions on flavor and the impact of storage conditions on cereal quality are essential factors in optimization of cereal production efficiency. Comparison of different cereal fortification methods, such as enriched grains versus direct addition, can significantly influence supply chain logistics and compliance. Consumer acceptance of reduced-sugar cereals varies, necessitating strategies to improve the protein content and fiber content of cereals. The effect of fiber on digestive health in cereals is a growing area of research, offering opportunities for differentiation and market growth. By focusing on these key areas, RTE breakfast cereal manufacturers can enhance their product offerings, meet consumer demands, and maintain a competitive edge in the market. For instance, a leading cereal manufacturer successfully optimized its production process to reduce sodium levels by 25% while maintaining consumer acceptance, resulting in a significant cost savings and improved compliance with regulatory requirements. This strategic approach to innovation and operational efficiency sets the company apart in the competitive the market.

    What are the Key Data Covered in this RTE Breakfast Cereal Market Research and Growth Report?

    • What is the expected growth of the RTE Breakfast Cereal Market between 2024 and 2028?

      • USD 6.48 billion, at a CAGR of 6.06%

    • What segmentation does the market report cover?

      • The report is segmented by Distribution Channel (Offline and Online), Type (Corn, Wheat, Rice, and Others), Geography (North America, Europe, APAC, Middle East and Africa, and South America), Product Type (Hot Cereals, Cold Cereals, and Granola & Muesli), Consumer Preference (Gluten-Free, High-Fiber, Low-Sugar, and Organic), and Target Consumer (Children, Adults, Health-Conscious Consumers, and Families)

    • Which regions are analyzed in the report?

      • North America, Europe, APAC, Middle East and Africa, and South America

    • What are the key growth drivers and market challenges?

      • Rising demand for RTE breakfast cereal, Fluctuations in food prices of RTE breakfast cereal

    • Who are the major players in the RTE Breakfast Cereal Market?

      • Alara Wholefoods Ltd., Associated British Foods Plc, B and G Foods Inc., Bagrrys India Pvt. Ltd., Bobs Red Mill Natural Foods Inc., Calbee Inc., Food For Life Baking Co. Inc., General Mills Inc., Kellogg Co., Mohan Meakin Ltd., Mornflake, mymuesli AG, Nestle SA, Orkla ASA, Patanjali Ayurved Ltd., PepsiCo Inc., Post Holdings Inc., Pristine Organics Pvt. Ltd., The Hain Celestial Group Inc., and WW International Inc.

    We can help! Our analysts can customize this rte breakfast cereal market research report to meet your requirements.

    Get in touch

    1 Executive Summary

    • 1.1 Market overview
      • Executive Summary - Chart on Market Overview
      • Executive Summary - Data Table on Market Overview
      • Executive Summary - Chart on Global Market Characteristics
      • Executive Summary - Chart on Market by Geography
      • Executive Summary - Chart on Market Segmentation by Distribution Channel
      • Executive Summary - Chart on Market Segmentation by Type
      • Executive Summary - Chart on Incremental Growth
      • Executive Summary - Data Table on Incremental Growth
      • Executive Summary - Chart on Company Market Positioning

    2 Market Landscape

    • 2.1 Market ecosystem
      • Parent Market
      • Data Table on - Parent Market
    • 2.2 Market characteristics
      • Market characteristics analysis
    • 2.3 Value chain analysis
      • Value Chain Analysis

    3 Market Sizing

    • 3.1 Market definition
      • Offerings of companies included in the market definition
    • 3.2 Market segment analysis
      • Market segments
    • 3.3 Market size 2023
      • 3.4 Market outlook: Forecast for 2023-2028
        • Chart on Global - Market size and forecast 2023-2028 ($ million)
        • Data Table on Global - Market size and forecast 2023-2028 ($ million)
        • Chart on Global Market: Year-over-year growth 2023-2028 (%)
        • Data Table on Global Market: Year-over-year growth 2023-2028 (%)

      4 Historic Market Size

      • 4.1 Global RTE Breakfast Cereal Market 2018 - 2022
        • Historic Market Size - Data Table on Global RTE Breakfast Cereal Market 2018 - 2022 ($ million)
      • 4.2 Distribution Channel segment analysis 2018 - 2022
        • Historic Market Size - Distribution Channel Segment 2018 - 2022 ($ million)
      • 4.3 Type segment analysis 2018 - 2022
        • Historic Market Size - Type Segment 2018 - 2022 ($ million)
      • 4.4 Geography segment analysis 2018 - 2022
        • Historic Market Size - Geography Segment 2018 - 2022 ($ million)
      • 4.5 Country segment analysis 2018 - 2022
        • Historic Market Size - Country Segment 2018 - 2022 ($ million)

      5 Five Forces Analysis

      • 5.1 Five forces summary
        • Five forces analysis - Comparison between 2023 and 2028
      • 5.2 Bargaining power of buyers
        • Bargaining power of buyers - Impact of key factors 2023 and 2028
      • 5.3 Bargaining power of suppliers
        • Bargaining power of suppliers - Impact of key factors in 2023 and 2028
      • 5.4 Threat of new entrants
        • Threat of new entrants - Impact of key factors in 2023 and 2028
      • 5.5 Threat of substitutes
        • Threat of substitutes - Impact of key factors in 2023 and 2028
      • 5.6 Threat of rivalry
        • Threat of rivalry - Impact of key factors in 2023 and 2028
      • 5.7 Market condition
        • Chart on Market condition - Five forces 2023 and 2028

      6 Market Segmentation by Distribution Channel

      • 6.1 Market segments
        • Chart on Distribution Channel - Market share (2023-2028) (%)
        • Data Table on Distribution Channel - Market share (2023-2028) (%)
      • 6.2 Comparison by Distribution Channel
        • Chart on Comparison by Distribution Channel
        • Data Table on Comparison by Distribution Channel
      • 6.3 Offline - Market size and forecast (2023-2028)
        • Chart on Offline - Market size and forecast (2023-2028) ($ million)
        • Data Table on Offline - Market size and forecast (2023-2028) ($ million)
        • Chart on Offline - Year-over-year growth (2023-2028) (%)
        • Data Table on Offline - Year-over-year growth (2023-2028) (%)
      • 6.4 Online - Market size and forecast (2023-2028)
        • Chart on Online - Market size and forecast (2023-2028) ($ million)
        • Data Table on Online - Market size and forecast (2023-2028) ($ million)
        • Chart on Online - Year-over-year growth (2023-2028) (%)
        • Data Table on Online - Year-over-year growth (2023-2028) (%)
      • 6.5 Market opportunity by Distribution Channel
        • Market opportunity by Distribution Channel ($ million)
        • Data Table on Market opportunity by Distribution Channel ($ million)

      7 Market Segmentation by Type

      • 7.1 Market segments
        • Chart on Type - Market share (2023-2028) (%)
        • Data Table on Type - Market share (2023-2028) (%)
      • 7.2 Comparison by Type
        • Chart on Comparison by Type
        • Data Table on Comparison by Type
      • 7.3 Corn - Market size and forecast (2023-2028)
        • Chart on Corn - Market size and forecast (2023-2028) ($ million)
        • Data Table on Corn - Market size and forecast (2023-2028) ($ million)
        • Chart on Corn - Year-over-year growth (2023-2028) (%)
        • Data Table on Corn - Year-over-year growth (2023-2028) (%)
      • 7.4 Wheat - Market size and forecast (2023-2028)
        • Chart on Wheat - Market size and forecast (2023-2028) ($ million)
        • Data Table on Wheat - Market size and forecast (2023-2028) ($ million)
        • Chart on Wheat - Year-over-year growth (2023-2028) (%)
        • Data Table on Wheat - Year-over-year growth (2023-2028) (%)
      • 7.5 Rice - Market size and forecast (2023-2028)
        • Chart on Rice - Market size and forecast (2023-2028) ($ million)
        • Data Table on Rice - Market size and forecast (2023-2028) ($ million)
        • Chart on Rice - Year-over-year growth (2023-2028) (%)
        • Data Table on Rice - Year-over-year growth (2023-2028) (%)
      • 7.6 Others - Market size and forecast (2023-2028)
        • Chart on Others - Market size and forecast (2023-2028) ($ million)
        • Data Table on Others - Market size and forecast (2023-2028) ($ million)
        • Chart on Others - Year-over-year growth (2023-2028) (%)
        • Data Table on Others - Year-over-year growth (2023-2028) (%)
      • 7.7 Market opportunity by Type
        • Market opportunity by Type ($ million)
        • Data Table on Market opportunity by Type ($ million)

      8 Market Segmentation by Product Type

      • 8.1 Market segments
        • Chart on Product Type - Market share (2023-2028) (%)
        • Data Table on Product Type - Market share (2023-2028) (%)
      • 8.2 Comparison by Product Type
        • Chart on Comparison by Product Type
        • Data Table on Comparison by Product Type
      • 8.3 Hot Cereals - Market size and forecast (2023-2028)
        • Chart on Hot Cereals - Market size and forecast (2023-2028) ($ million)
        • Data Table on Hot Cereals - Market size and forecast (2023-2028) ($ million)
        • Chart on Hot Cereals - Year-over-year growth (2023-2028) (%)
        • Data Table on Hot Cereals - Year-over-year growth (2023-2028) (%)
      • 8.4 Cold Cereals - Market size and forecast (2023-2028)
        • Chart on Cold Cereals - Market size and forecast (2023-2028) ($ million)
        • Data Table on Cold Cereals - Market size and forecast (2023-2028) ($ million)
        • Chart on Cold Cereals - Year-over-year growth (2023-2028) (%)
        • Data Table on Cold Cereals - Year-over-year growth (2023-2028) (%)
      • 8.5 Granola & Muesli - Market size and forecast (2023-2028)
        • Chart on Granola & Muesli - Market size and forecast (2023-2028) ($ million)
        • Data Table on Granola & Muesli - Market size and forecast (2023-2028) ($ million)
        • Chart on Granola & Muesli - Year-over-year growth (2023-2028) (%)
        • Data Table on Granola & Muesli - Year-over-year growth (2023-2028) (%)
      • 8.6 Market opportunity by Product Type
        • Market opportunity by Product Type ($ million)
        • Data Table on Market opportunity by Product Type ($ million)

      9 Market Segmentation by Consumer Preference

      • 9.1 Market segments
        • Chart on Consumer Preference - Market share (2023-2028) (%)
        • Data Table on Consumer Preference - Market share (2023-2028) (%)
      • 9.2 Comparison by Consumer Preference
        • Chart on Comparison by Consumer Preference
        • Data Table on Comparison by Consumer Preference
      • 9.3 Gluten-Free - Market size and forecast (2023-2028)
        • Chart on Gluten-Free - Market size and forecast (2023-2028) ($ million)
        • Data Table on Gluten-Free - Market size and forecast (2023-2028) ($ million)
        • Chart on Gluten-Free - Year-over-year growth (2023-2028) (%)
        • Data Table on Gluten-Free - Year-over-year growth (2023-2028) (%)
      • 9.4 High-Fiber - Market size and forecast (2023-2028)
        • Chart on High-Fiber - Market size and forecast (2023-2028) ($ million)
        • Data Table on High-Fiber - Market size and forecast (2023-2028) ($ million)
        • Chart on High-Fiber - Year-over-year growth (2023-2028) (%)
        • Data Table on High-Fiber - Year-over-year growth (2023-2028) (%)
      • 9.5 Low-Sugar - Market size and forecast (2023-2028)
        • Chart on Low-Sugar - Market size and forecast (2023-2028) ($ million)
        • Data Table on Low-Sugar - Market size and forecast (2023-2028) ($ million)
        • Chart on Low-Sugar - Year-over-year growth (2023-2028) (%)
        • Data Table on Low-Sugar - Year-over-year growth (2023-2028) (%)
      • 9.6 Organic - Market size and forecast (2023-2028)
        • Chart on Organic - Market size and forecast (2023-2028) ($ million)
        • Data Table on Organic - Market size and forecast (2023-2028) ($ million)
        • Chart on Organic - Year-over-year growth (2023-2028) (%)
        • Data Table on Organic - Year-over-year growth (2023-2028) (%)
      • 9.7 Market opportunity by Consumer Preference
        • Market opportunity by Consumer Preference ($ million)
        • Data Table on Market opportunity by Consumer Preference ($ million)

      10 Market Segmentation by Target Consumer

      • 10.1 Market segments
        • Chart on Target Consumer - Market share (2023-2028) (%)
        • Data Table on Target Consumer - Market share (2023-2028) (%)
      • 10.2 Comparison by Target Consumer
        • Chart on Comparison by Target Consumer
        • Data Table on Comparison by Target Consumer
      • 10.3 Children - Market size and forecast (2023-2028)
        • Chart on Children - Market size and forecast (2023-2028) ($ million)
        • Data Table on Children - Market size and forecast (2023-2028) ($ million)
        • Chart on Children - Year-over-year growth (2023-2028) (%)
        • Data Table on Children - Year-over-year growth (2023-2028) (%)
      • 10.4 Adults - Market size and forecast (2023-2028)
        • Chart on Adults - Market size and forecast (2023-2028) ($ million)
        • Data Table on Adults - Market size and forecast (2023-2028) ($ million)
        • Chart on Adults - Year-over-year growth (2023-2028) (%)
        • Data Table on Adults - Year-over-year growth (2023-2028) (%)
      • 10.5 Health-Conscious Consumers - Market size and forecast (2023-2028)
        • Chart on Health-Conscious Consumers - Market size and forecast (2023-2028) ($ million)
        • Data Table on Health-Conscious Consumers - Market size and forecast (2023-2028) ($ million)
        • Chart on Health-Conscious Consumers - Year-over-year growth (2023-2028) (%)
        • Data Table on Health-Conscious Consumers - Year-over-year growth (2023-2028) (%)
      • 10.6 Families - Market size and forecast (2023-2028)
        • Chart on Families - Market size and forecast (2023-2028) ($ million)
        • Data Table on Families - Market size and forecast (2023-2028) ($ million)
        • Chart on Families - Year-over-year growth (2023-2028) (%)
        • Data Table on Families - Year-over-year growth (2023-2028) (%)
      • 10.7 Market opportunity by Target Consumer
        • Market opportunity by Target Consumer ($ million)
        • Data Table on Market opportunity by Target Consumer ($ million)

      11 Customer Landscape

      • 11.1 Customer landscape overview
        • Analysis of price sensitivity, lifecycle, customer purchase basket, adoption rates, and purchase criteria

      12 Geographic Landscape

      • 12.1 Geographic segmentation
        • Chart on Market share by geography 2023-2028 (%)
        • Data Table on Market share by geography 2023-2028 (%)
      • 12.2 Geographic comparison
        • Chart on Geographic comparison
        • Data Table on Geographic comparison
      • 12.3 North America - Market size and forecast 2023-2028
        • Chart on North America - Market size and forecast 2023-2028 ($ million)
        • Data Table on North America - Market size and forecast 2023-2028 ($ million)
        • Chart on North America - Year-over-year growth 2023-2028 (%)
        • Data Table on North America - Year-over-year growth 2023-2028 (%)
      • 12.4 Europe - Market size and forecast 2023-2028
        • Chart on Europe - Market size and forecast 2023-2028 ($ million)
        • Data Table on Europe - Market size and forecast 2023-2028 ($ million)
        • Chart on Europe - Year-over-year growth 2023-2028 (%)
        • Data Table on Europe - Year-over-year growth 2023-2028 (%)
      • 12.5 APAC - Market size and forecast 2023-2028
        • Chart on APAC - Market size and forecast 2023-2028 ($ million)
        • Data Table on APAC - Market size and forecast 2023-2028 ($ million)
        • Chart on APAC - Year-over-year growth 2023-2028 (%)
        • Data Table on APAC - Year-over-year growth 2023-2028 (%)
      • 12.6 Middle East and Africa - Market size and forecast 2023-2028
        • Chart on Middle East and Africa - Market size and forecast 2023-2028 ($ million)
        • Data Table on Middle East and Africa - Market size and forecast 2023-2028 ($ million)
        • Chart on Middle East and Africa - Year-over-year growth 2023-2028 (%)
        • Data Table on Middle East and Africa - Year-over-year growth 2023-2028 (%)
      • 12.7 South America - Market size and forecast 2023-2028
        • Chart on South America - Market size and forecast 2023-2028 ($ million)
        • Data Table on South America - Market size and forecast 2023-2028 ($ million)
        • Chart on South America - Year-over-year growth 2023-2028 (%)
        • Data Table on South America - Year-over-year growth 2023-2028 (%)
      • 12.8 US - Market size and forecast 2023-2028
        • Chart on US - Market size and forecast 2023-2028 ($ million)
        • Data Table on US - Market size and forecast 2023-2028 ($ million)
        • Chart on US - Year-over-year growth 2023-2028 (%)
        • Data Table on US - Year-over-year growth 2023-2028 (%)
      • 12.9 China - Market size and forecast 2023-2028
        • Chart on China - Market size and forecast 2023-2028 ($ million)
        • Data Table on China - Market size and forecast 2023-2028 ($ million)
        • Chart on China - Year-over-year growth 2023-2028 (%)
        • Data Table on China - Year-over-year growth 2023-2028 (%)
      • 12.10 Japan - Market size and forecast 2023-2028
        • Chart on Japan - Market size and forecast 2023-2028 ($ million)
        • Data Table on Japan - Market size and forecast 2023-2028 ($ million)
        • Chart on Japan - Year-over-year growth 2023-2028 (%)
        • Data Table on Japan - Year-over-year growth 2023-2028 (%)
      • 12.11 Germany - Market size and forecast 2023-2028
        • Chart on Germany - Market size and forecast 2023-2028 ($ million)
        • Data Table on Germany - Market size and forecast 2023-2028 ($ million)
        • Chart on Germany - Year-over-year growth 2023-2028 (%)
        • Data Table on Germany - Year-over-year growth 2023-2028 (%)
      • 12.12 Canada - Market size and forecast 2023-2028
        • Chart on Canada - Market size and forecast 2023-2028 ($ million)
        • Data Table on Canada - Market size and forecast 2023-2028 ($ million)
        • Chart on Canada - Year-over-year growth 2023-2028 (%)
        • Data Table on Canada - Year-over-year growth 2023-2028 (%)
      • 12.13 Market opportunity by geography
        • Market opportunity by geography ($ million)
        • Data Tables on Market opportunity by geography ($ million)
      • 12.14 US - Market size and forecast (2023-2028)
        • Chart on US - Market size and forecast (2023-2028) ($ million)
        • Data Table on US - Market size and forecast (2023-2028) ($ million)
        • Chart on US - Year-over-year growth (2023-2028) (%)
        • Data Table on US - Year-over-year growth (2023-2028) (%)
      • 12.15 UK - Market size and forecast (2023-2028)
        • Chart on UK - Market size and forecast (2023-2028) ($ million)
        • Data Table on UK - Market size and forecast (2023-2028) ($ million)
        • Chart on UK - Year-over-year growth (2023-2028) (%)
        • Data Table on UK - Year-over-year growth (2023-2028) (%)
      • 12.16 Italy - Market size and forecast (2023-2028)
        • Chart on Italy - Market size and forecast (2023-2028) ($ million)
        • Data Table on Italy - Market size and forecast (2023-2028) ($ million)
        • Chart on Italy - Year-over-year growth (2023-2028) (%)
        • Data Table on Italy - Year-over-year growth (2023-2028) (%)
      • 12.17 France - Market size and forecast (2023-2028)
        • Chart on France - Market size and forecast (2023-2028) ($ million)
        • Data Table on France - Market size and forecast (2023-2028) ($ million)
        • Chart on France - Year-over-year growth (2023-2028) (%)
        • Data Table on France - Year-over-year growth (2023-2028) (%)
      • 12.18 India - Market size and forecast (2023-2028)
        • Chart on India - Market size and forecast (2023-2028) ($ million)
        • Data Table on India - Market size and forecast (2023-2028) ($ million)
        • Chart on India - Year-over-year growth (2023-2028) (%)
        • Data Table on India - Year-over-year growth (2023-2028) (%)
      • 12.19 Brazil - Market size and forecast (2023-2028)
        • Chart on Brazil - Market size and forecast (2023-2028) ($ million)
        • Data Table on Brazil - Market size and forecast (2023-2028) ($ million)
        • Chart on Brazil - Year-over-year growth (2023-2028) (%)
        • Data Table on Brazil - Year-over-year growth (2023-2028) (%)
      • 12.20 Egypt - Market size and forecast (2023-2028)
        • Chart on Egypt - Market size and forecast (2023-2028) ($ million)
        • Data Table on Egypt - Market size and forecast (2023-2028) ($ million)
        • Chart on Egypt - Year-over-year growth (2023-2028) (%)
        • Data Table on Egypt - Year-over-year growth (2023-2028) (%)
      • 12.21 UAE - Market size and forecast (2023-2028)
        • Chart on UAE - Market size and forecast (2023-2028) ($ million)
        • Data Table on UAE - Market size and forecast (2023-2028) ($ million)
        • Chart on UAE - Year-over-year growth (2023-2028) (%)
        • Data Table on UAE - Year-over-year growth (2023-2028) (%)
      • 12.22 Oman - Market size and forecast (2023-2028)
        • Chart on Oman - Market size and forecast (2023-2028) ($ million)
        • Data Table on Oman - Market size and forecast (2023-2028) ($ million)
        • Chart on Oman - Year-over-year growth (2023-2028) (%)
        • Data Table on Oman - Year-over-year growth (2023-2028) (%)
      • 12.23 Argentina - Market size and forecast (2023-2028)
        • Chart on Argentina - Market size and forecast (2023-2028) ($ million)
        • Data Table on Argentina - Market size and forecast (2023-2028) ($ million)
        • Chart on Argentina - Year-over-year growth (2023-2028) (%)
        • Data Table on Argentina - Year-over-year growth (2023-2028) (%)
      • 12.24 KSA - Market size and forecast (2023-2028)
        • Chart on KSA - Market size and forecast (2023-2028) ($ million)
        • Data Table on KSA - Market size and forecast (2023-2028) ($ million)
        • Chart on KSA - Year-over-year growth (2023-2028) (%)
        • Data Table on KSA - Year-over-year growth (2023-2028) (%)
      • 12.25 Rest of World (ROW) - Market size and forecast (2023-2028)
        • Chart on Rest of World (ROW) - Market size and forecast (2023-2028) ($ million)
        • Data Table on Rest of World (ROW) - Market size and forecast (2023-2028) ($ million)
        • Chart on Rest of World (ROW) - Year-over-year growth (2023-2028) (%)
        • Data Table on Rest of World (ROW) - Year-over-year growth (2023-2028) (%)

      13 Drivers, Challenges, and Opportunity/Restraints

      • 13.1 Market drivers
        • 13.2 Market challenges
          • 13.3 Impact of drivers and challenges
            • Impact of drivers and challenges in 2023 and 2028
          • 13.4 Market opportunities/restraints

            14 Competitive Landscape

            • 14.1 Overview
              • 14.2 Competitive Landscape
                • Overview on criticality of inputs and factors of differentiation
              • 14.3 Landscape disruption
                • Overview on factors of disruption
              • 14.4 Industry risks
                • Impact of key risks on business

              15 Competitive Analysis

              • 15.1 Companies profiled
                • Companies covered
              • 15.2 Market positioning of companies
                • Matrix on companies position and classification
              • 15.3 Alara Wholefoods Ltd.
                • Alara Wholefoods Ltd. - Overview
                • Alara Wholefoods Ltd. - Product / Service
                • Alara Wholefoods Ltd. - Key offerings
              • 15.4 Associated British Foods Plc
                • Associated British Foods Plc - Overview
                • Associated British Foods Plc - Business segments
                • Associated British Foods Plc - Key offerings
                • Associated British Foods Plc - Segment focus
              • 15.5 B and G Foods Inc.
                • B and G Foods Inc. - Overview
                • B and G Foods Inc. - Product / Service
                • B and G Foods Inc. - Key offerings
              • 15.6 Bobs Red Mill Natural Foods Inc.
                • Bobs Red Mill Natural Foods Inc. - Overview
                • Bobs Red Mill Natural Foods Inc. - Product / Service
                • Bobs Red Mill Natural Foods Inc. - Key offerings
              • 15.7 Food For Life Baking Co. Inc.
                • Food For Life Baking Co. Inc. - Overview
                • Food For Life Baking Co. Inc. - Product / Service
                • Food For Life Baking Co. Inc. - Key offerings
              • 15.8 General Mills Inc.
                • General Mills Inc. - Overview
                • General Mills Inc. - Business segments
                • General Mills Inc. - Key news
                • General Mills Inc. - Key offerings
                • General Mills Inc. - Segment focus
              • 15.9 Kellogg Co.
                • Kellogg Co. - Overview
                • Kellogg Co. - Business segments
                • Kellogg Co. - Key offerings
                • Kellogg Co. - Segment focus
              • 15.10 Mornflake
                • Mornflake - Overview
                • Mornflake - Product / Service
                • Mornflake - Key offerings
              • 15.11 mymuesli AG
                • mymuesli AG - Overview
                • mymuesli AG - Product / Service
                • mymuesli AG - Key offerings
              • 15.12 Nestle SA
                • Nestle SA - Overview
                • Nestle SA - Business segments
                • Nestle SA - Key news
                • Nestle SA - Key offerings
                • Nestle SA - Segment focus
              • 15.13 Orkla ASA
                • Orkla ASA - Overview
                • Orkla ASA - Business segments
                • Orkla ASA - Key news
                • Orkla ASA - Key offerings
                • Orkla ASA - Segment focus
              • 15.14 Patanjali Ayurved Ltd.
                • Patanjali Ayurved Ltd. - Overview
                • Patanjali Ayurved Ltd. - Product / Service
                • Patanjali Ayurved Ltd. - Key offerings
              • 15.15 PepsiCo Inc.
                • PepsiCo Inc. - Overview
                • PepsiCo Inc. - Business segments
                • PepsiCo Inc. - Key news
                • PepsiCo Inc. - Key offerings
                • PepsiCo Inc. - Segment focus
              • 15.16 Post Holdings Inc.
                • Post Holdings Inc. - Overview
                • Post Holdings Inc. - Business segments
                • Post Holdings Inc. - Key news
                • Post Holdings Inc. - Key offerings
                • Post Holdings Inc. - Segment focus
              • 15.17 Pristine Organics Pvt. Ltd.
                • Pristine Organics Pvt. Ltd. - Overview
                • Pristine Organics Pvt. Ltd. - Product / Service
                • Pristine Organics Pvt. Ltd. - Key offerings

              16 Appendix

              • 16.1 Scope of the report
                • 16.2 Inclusions and exclusions checklist
                  • Inclusions checklist
                  • Exclusions checklist
                • 16.3 Currency conversion rates for US$
                  • Currency conversion rates for US$
                • 16.4 Research methodology
                  • Research methodology
                • 16.5 Data procurement
                  • Information sources
                • 16.6 Data validation
                  • Data validation
                • 16.7 Validation techniques employed for market sizing
                  • Validation techniques employed for market sizing
                • 16.8 Data synthesis
                  • Data synthesis
                • 16.9 360 degree market analysis
                  • 360 degree market analysis
                • 16.10 List of abbreviations
                  • List of abbreviations

                Research Methodology

                Technavio presents a detailed picture of the market by way of study, synthesis, and summation of data from multiple sources. The analysts have presented the various facets of the market with a particular focus on identifying the key industry influencers. The data thus presented is comprehensive, reliable, and the result of extensive research, both primary and secondary.

                INFORMATION SOURCES

                Primary sources

                • Manufacturers and suppliers
                • Channel partners
                • Industry experts
                • Strategic decision makers

                Secondary sources

                • Industry journals and periodicals
                • Government data
                • Financial reports of key industry players
                • Historical data
                • Press releases

                DATA ANALYSIS

                Data Synthesis

                • Collation of data
                • Estimation of key figures
                • Analysis of derived insights

                Data Validation

                • Triangulation with data models
                • Reference against proprietary databases
                • Corroboration with industry experts

                REPORT WRITING

                Qualitative

                • Market drivers
                • Market challenges
                • Market trends
                • Five forces analysis

                Quantitative

                • Market size and forecast
                • Market segmentation
                • Geographical insights
                • Competitive landscape

                Interested in this report?

                Get your sample now to see our research methodology and insights!

                Download Now

                Frequently Asked Questions

                RTE Breakfast Cereal market growth will increase by $ 6478.7 mn during 2024-2028 .

                The RTE Breakfast Cereal market is expected to grow at a CAGR of 6.06% during 2024-2028 .

                RTE Breakfast Cereal market is segmented by Distribution Channel( Offline, Online) Type( Corn, Wheat, Rice, Others, South America)

                Alara Wholefoods Ltd., Associated British Foods Plc, B and G Foods Inc., Bagrrys India Pvt. Ltd., Bobs Red Mill Natural Foods Inc., Calbee Inc., Food For Life Baking Co. Inc., General Mills Inc., Kellogg Co., Mohan Meakin Ltd., Mornflake, mymuesli AG, Nestle SA, Orkla ASA, Patanjali Ayurved Ltd., PepsiCo Inc., Post Holdings Inc., Pristine Organics Pvt. Ltd., The Hain Celestial Group Inc., WW International Inc. are a few of the key vendors in the RTE Breakfast Cereal market.

                North America will register the highest growth rate of 35% among the other regions. Therefore, the RTE Breakfast Cereal market in North America is expected to garner significant business opportunities for the vendors during the forecast period.

                US, Canada, Germany, UK, Italy, France, China, India, Japan, Brazil, Egypt, UAE, Oman, Argentina, KSA, UAE, Brazil, Rest of World (ROW)

                • Rising demand for RTE breakfast cerealThe trend of the adoption of RTE breakfast cereals among people is increasing around the globe. The increasing awareness of the importance of healthy breakfast among individuals increases the demand for RTE breakfast cereals. RTE breakfast cereals comprise carbohydrates is the driving factor this market.
                • protein is the driving factor this market.
                • and fiber and accommodate a range of micronutrients such as vitamin E is the driving factor this market.
                • vitamin B is the driving factor this market.
                • magnesium is the driving factor this market.
                • and zinc. They are considered to be beneficial for the health of consumers. Vendors promote their products for health advantages that originate from eating corn and oat-based high-fiber cereals. RTE breakfast cereals are significant contributors to nutrient eating in developed countries such as the US is the driving factor this market.
                • Canada is the driving factor this market.
                • and the UK. Vendors offer sugar-free RTE breakfast cereal alternatives. Owing to the presence of high sugar and preservative content in cereal bars is the driving factor this market.
                • vendors have reduced the sugar content in their offerings. Vendors are engaged in introducing innovative is the driving factor this market.
                • fruit-flavored is the driving factor this market.
                • and fiber-rich products which contain reduced fat and oil content. The leading companies are trying to blend organic and healthy ingredients to boost the sales of RTE breakfast cereals. Vendors are utilizing traditionally grown cereal grains such as quinoa to create innovation in RTE breakfast cereal products. The increasing demand for RTE breakfast cereals will drive the growth of the global RTE breakfast cereal market during the forecast period. is the driving factor this market.

                The RTE Breakfast Cereal market vendors should focus on grabbing business opportunities from the Offline segment as it accounted for the largest market share in the base year.