Breast Cancer Liquid Biopsy Market Size 2024-2028
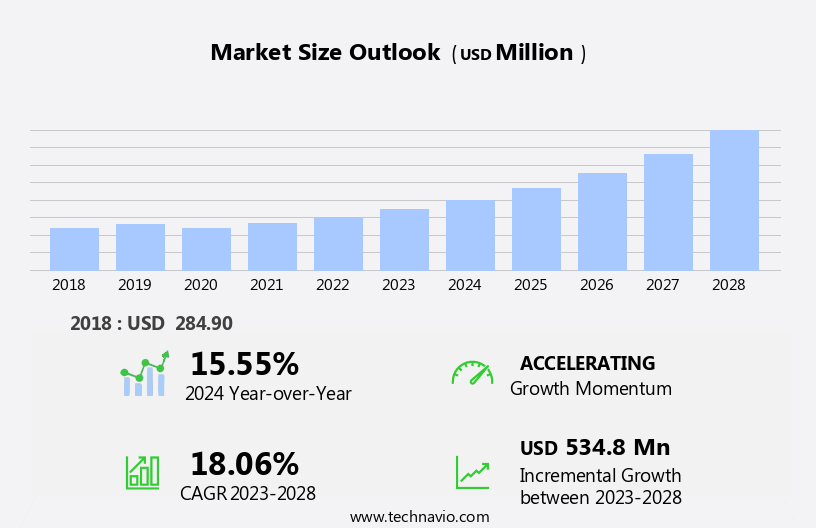
The breast cancer liquid biopsy market size is forecast to increase by USD 534.8 million, at a CAGR of 18.06% between 2023 and 2028.
- The market is driven by the growing prevalence of breast cancer cases and initiatives to detect the disease at its early stages. Early detection significantly increases the chances of effective treatment and survival, making liquid biopsies an increasingly popular alternative to traditional tissue biopsies. However, the high cost of breast cancer liquid biopsies poses a significant challenge for both patients and healthcare systems. Despite this obstacle, the potential benefits of this advanced diagnostic tool are compelling, particularly in terms of improved patient outcomes and reduced healthcare costs through earlier intervention.
- Companies seeking to capitalize on this market opportunity must navigate the cost challenge by exploring innovative pricing models and partnerships with healthcare providers and insurers. Additionally, ongoing research and development efforts are expected to drive advancements in the accuracy and affordability of liquid biopsy technologies, further expanding their market potential.
What will be the Size of the Breast Cancer Liquid Biopsy Market during the forecast period?
Explore in-depth regional segment analysis with market size data - historical 2018-2022 and forecasts 2024-2028 - in the full report.
Request Free Sample
The liquid biopsy market continues to evolve, driven by advancements in tumor heterogeneity understanding and the need for more accurate and timely cancer diagnosis and treatment. Mutation detection through liquid biopsy panels, utilizing next-generation sequencing and RNA sequencing, has emerged as a crucial tool in genetic analysis. Multiplexed assays and sample storage solutions enable efficient clinical validation and clinical trials. Industry collaboration and data analysis play significant roles in enhancing diagnostic accuracy and clinical utility. Precision oncology applications, such as personalized medicine, treatment response monitoring, and companion diagnostics, are gaining traction. Biomarker discovery and molecular profiling are key areas of focus, with circulating tumor cells and cell-free DNA offering valuable insights into the tumor microenvironment.
Sample preparation and regulatory approval are essential considerations for market penetration, while analytical validity and prognostic markers are crucial for ensuring the clinical utility of liquid biopsy technologies. Workflow optimization and targeted therapy are also essential aspects of this dynamic market. The ongoing quest for early detection and improved treatment outcomes fuels the adoption rates of these innovative solutions.
How is this Breast Cancer Liquid Biopsy Industry segmented?
The breast cancer liquid biopsy industry research report provides comprehensive data (region-wise segment analysis), with forecasts and estimates in "USD million" for the period 2024-2028, as well as historical data from 2018-2022 for the following segments.
- Product Type
- Reagent kits
- Instruments
- Services
- Application
- Diagnostics
- Prognostics
- Risk Assessment
- Early Detection/Screening
- Treatment Selection
- Monitoring
- Circulating Biomaker
- Circulating Tumor Cells (CTCs)
- Circulating Tumor DNA (ctDNA)
- Extracellular Vesicles (EVs)
- Other Circulating Biomarkers
- Geography
- North America
- US
- Canada
- Europe
- France
- Germany
- Italy
- UK
- Middle East and Africa
- Egypt
- KSA
- Oman
- UAE
- APAC
- China
- India
- Japan
- South America
- Argentina
- Brazil
- Rest of World (ROW)
- North America
By Product Type Insights
The reagent kits segment is estimated to witness significant growth during the forecast period.
The market is experiencing significant growth, driven by the advancements in technology and increasing research in tumor heterogeneity and mutation detection. The reagent kits segment dominates this market, with the introduction of novel reagents enabling circulating biomarker analysis and target enrichment. This segment's growth is further fueled by increased funding for R&D, approvals of breast cancer liquid biopsy reagent kits, and a rising demand for these kits due to the surge in breast cancer liquid biopsy test procedures and the increasing prevalence of breast cancer worldwide. Additionally, next-generation sequencing, molecular profiling, and clinical validation play crucial roles in market expansion.
Industry collaboration, data analysis, and diagnostic accuracy are essential components of the market, with precision oncology, personalized medicine, and companion diagnostics gaining traction. Sample preparation, tumor microenvironment, early detection, and treatment response monitoring are also key areas of focus. Market penetration is boosted by regulatory approval, workflow optimization, and the adoption of analytical validity and prognostic markers such as circulating tumor cells and cell-free DNA. The market's evolution is further driven by RNA sequencing, targeted therapy, and intellectual property development.
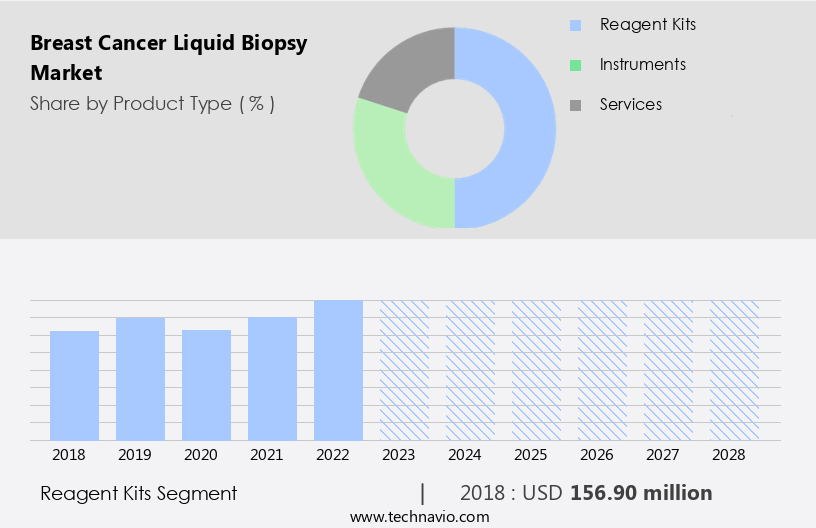
The Reagent kits segment was valued at USD 156.90 million in 2018 and showed a gradual increase during the forecast period.
Regional Analysis
North America is estimated to contribute 55% to the growth of the global market during the forecast period.Technavio's analysts have elaborately explained the regional trends and drivers that shape the market during the forecast period.
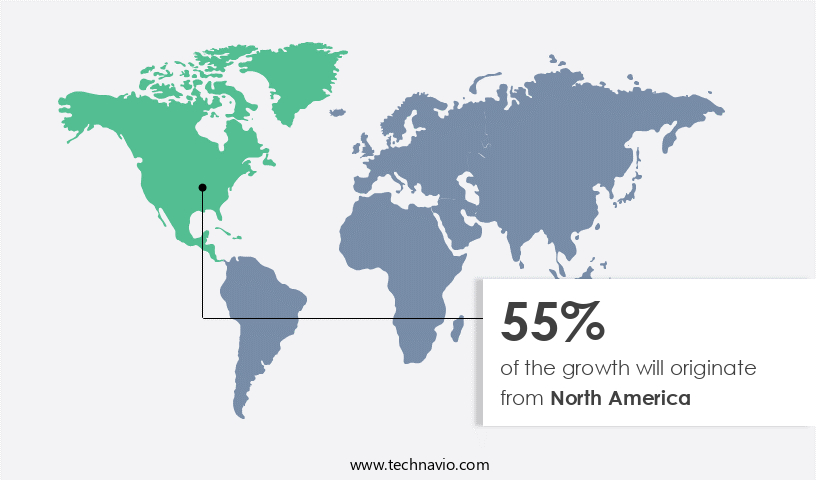
The North American market is poised for steady expansion during the forecast period. This region's growth is primarily fueled by the healthcare sector's increasing adoption of advanced technologies, substantial healthcare expenditure, rising breast cancer prevalence, and heightened patient awareness regarding breast cancer screening. Furthermore, the presence of numerous companies manufacturing breast cancer liquid biopsy kits and products, as well as technological advancements in biopsy techniques, are significant market growth drivers. Molecular profiling, genetic analysis, and diagnostic accuracy are key factors propelling the market's growth. Next-generation sequencing and RNA sequencing are increasingly being utilized for biomarker discovery and personalized medicine, including targeted therapy and companion diagnostics.
Industry collaboration and clinical trials are crucial for clinical validation and regulatory approval, ensuring analytical validity and clinical utility. Sample preparation, tumor microenvironment analysis, and early detection are essential aspects of the market. Circulating tumor cells, cell-free DNA, and prognostic markers are critical biomarkers for treatment response monitoring and precision oncology. Market penetration is influenced by the adoption rates of these advanced diagnostic techniques and the integration of liquid biopsy into clinical workflows for optimal workflow optimization. Intellectual property protection is essential for market players, ensuring the protection of their innovative technologies and products. The market's evolution is characterized by continuous technological advancements, clinical validation, and regulatory approvals, making it an exciting and dynamic field in precision oncology.
Market Dynamics
Our researchers analyzed the data with 2023 as the base year, along with the key drivers, trends, and challenges. A holistic analysis of drivers will help companies refine their marketing strategies to gain a competitive advantage.
What are the key market drivers leading to the rise in the adoption of Breast Cancer Liquid Biopsy Industry?
- The increasing prevalence of breast cancer is the primary factor fueling market growth in this sector.
- Breast cancer is a significant health concern globally, accounting for a considerable number of deaths worldwide. Among various types of cancer, breast cancer is the most common among women, with a higher prevalence in the geriatric population. According to recent data, approximately 9% of the global female population is aged 65 and above, making them more susceptible to breast cancer. Younger women are also at risk, as the CDC reported that around 12% of new breast cancer cases in the US occurred in women under 45 years old in July 2021. The advancement in precision oncology and the growing focus on workflow optimization in healthcare have led to the increasing adoption of breast cancer liquid biopsy tests.
- These tests provide valuable insights into the disease's genetic makeup, enabling more accurate diagnosis and personalized treatment plans. Precision oncology relies on analytical validity, which is crucial for the accurate detection of prognostic markers such as circulating tumor cells (CTCs) and DNA sequencing. Intellectual property plays a vital role in the market, with companies investing heavily in research and development to secure patents and protect their intellectual property. Regulatory approval is another critical factor, as these tests must meet stringent regulatory requirements to ensure their safety and efficacy. Despite these challenges, the market is expected to grow significantly due to its potential to revolutionize cancer diagnosis and treatment.
What are the market trends shaping the Breast Cancer Liquid Biopsy Industry?
- The detection of breast cancer at its early stages is gaining significant attention in the market. Professionals predict an upward trend in the development and implementation of programs designed for early breast cancer detection.
- Liquid biopsy, a revolutionary diagnostic approach in cancer detection, is gaining significant traction in the medical community due to its ability to identify tumor heterogeneity and mutations. This non-invasive technique employs multiplexed assays and next-generation sequencing to analyze circulating tumor cells and DNA fragments in a patient's bloodstream. Fueled by industry collaboration and advancements in technology, liquid biopsy panels are becoming increasingly valuable tools for early detection and personalized treatment plans. Sample storage and data analysis are crucial aspects of these panels, ensuring accurate and reliable results. Government and private organizations have recognized the potential of liquid biopsy and have provided funding and grants to support research and development.
- For instance, the European Commission has funded projects like BRIDGES and B-CAST, which focus on next-generation sequencing and breast cancer stratification, respectively. These initiatives aim to provide better solutions for breast cancer screening and improve preventive care by identifying women at high risk and offering precise identification of their chances of developing breast cancer. In conclusion, the advancements in liquid biopsy technology and the support from various funding sources are driving the development of innovative products that will significantly impact breast cancer screening and patient care. These tools will enable earlier detection, personalized treatment plans, and improved preventive measures, ultimately leading to better outcomes for patients.
What challenges does the Breast Cancer Liquid Biopsy Industry face during its growth?
- The exorbitant cost of breast biopsies poses a significant challenge to the growth of the industry. This expense, a notable concern for both healthcare providers and patients, warrants ongoing attention and potential solutions to ensure accessibility and affordability for necessary diagnostic procedures.
- Breast cancer is a significant health concern worldwide, leading to an increased focus on advanced diagnostic tools for early detection and personalized treatment. Among these, liquid biopsy is emerging as a promising solution in breast cancer diagnosis and treatment response monitoring. This minimally invasive procedure involves analyzing various biomarkers, including genetic material and proteins, present in bodily fluids. Liquid biopsy offers several advantages over traditional diagnostic methods, such as diagnostic accuracy, molecular profiling, and clinical validation through clinical trials. RNA sequencing is a crucial technology used in liquid biopsy to identify genetic mutations and understand the molecular mechanisms of breast cancer.
- This information is essential for treatment planning and monitoring treatment response in real-time, paving the way for personalized medicine. The market penetration of breast cancer liquid biopsy is expected to grow significantly due to its potential to improve patient outcomes and reduce healthcare costs. Clinical validation and ongoing clinical trials further strengthen the credibility of this innovative diagnostic approach.
Exclusive Customer Landscape
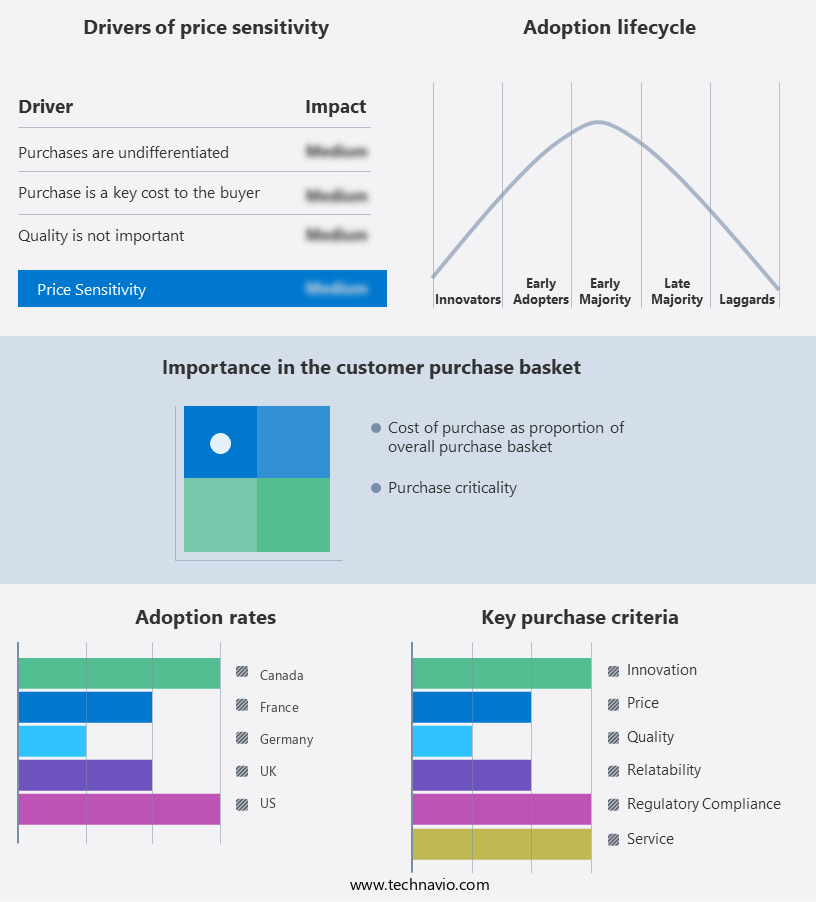
The breast cancer liquid biopsy market forecasting report includes the adoption lifecycle of the market, covering from the innovator's stage to the laggard's stage. It focuses on adoption rates in different regions based on penetration. Furthermore, the breast cancer liquid biopsy market report also includes key purchase criteria and drivers of price sensitivity to help companies evaluate and develop their market growth analysis strategies.
Customer Landscape
Key Companies & Market Insights
Companies are implementing various strategies, such as strategic alliances, breast cancer liquid biopsy market forecast, partnerships, mergers and acquisitions, geographical expansion, and product/service launches, to enhance their presence in the industry.
Adaptive Biotechnologies - This company specializes in advanced breast cancer diagnostics through a liquid biopsy approach. The innovative technology employed identifies Breast Tumor Antigen, which plays a crucial role in safeguarding mucous membranes, regulating signal transduction, and enhancing the immune system's response.
The industry research and growth report includes detailed analyses of the competitive landscape of the market and information about key companies, including:
- Adaptive Biotechnologies
- Agena Bioscience Inc.
- Bio-Rad Laboratories Inc.
- Biocept, Inc.
- Biodesix, Inc.
- Cynvenio Biosystems, Inc.
- Epic Sciences
- F. Hoffmann-La Roche Ltd. (including Foundation Medicine, Inc.)
- Fluxion Biosciences, Inc.
- Guardant Health Inc.
- Illumina Inc.
- Janssen Diagnostics
- Menarini Silicon Biosystems
- Myriad Genetics Inc.
- Natera, Inc.
- NeoGenomics Laboratories Inc.
- QIAGEN N.V.
- Sysmex Corporation
- Thermo Fisher Scientific Inc.
- Vortex Biosciences
Qualitative and quantitative analysis of companies has been conducted to help clients understand the wider business environment as well as the strengths and weaknesses of key industry players. Data is qualitatively analyzed to categorize companies as pure play, category-focused, industry-focused, and diversified; it is quantitatively analyzed to categorize companies as dominant, leading, strong, tentative, and weak.
Recent Development and News in Breast Cancer Liquid Biopsy Market
- In February 2023, Qiagen NV, a leading provider of sample and assay technologies, announced the launch of its new Circulating Tumor DNA (ctDNA) assay, Gabriela Star, for the detection and monitoring of breast cancer. This assay utilizes next-generation sequencing technology and is designed to identify mutations in circulating tumor DNA from a single blood draw (Qiagen Press Release, 2023).
- In March 2024, Illumina, Inc., a global leader in genomic sequencing and array-based solutions, entered into a strategic collaboration with Merck KGaA, Darmstadt, Germany, to co-develop and commercialize a liquid biopsy test for early detection and monitoring of breast cancer. This collaboration combines Illumina's expertise in genomic sequencing with Merck's clinical and commercial capabilities (Illumina Press Release, 2024).
- In May 2024, Grail, Inc., a healthcare company focused on cancer detection, raised USD1.8 billion in a Series D funding round. The funds will be used to further develop and commercialize its liquid biopsy test, Galleri, for the early detection of multiple cancer types, including breast cancer (Grail Press Release, 2024).
- In January 2025, the U.S. Food and Drug Administration (FDA) granted marketing authorization to Guardant Health, Inc. For its liquid biopsy test, Guardant360 Lung-1, for the detection of recurrence and resistance mechanisms in advanced non-small cell lung cancer. This approval marks a significant milestone for the liquid biopsy market, as it is the first FDA approval for a multi-biomarker liquid biopsy test in oncology (Guardant Health Press Release, 2025). Although not directly related to breast cancer, this approval is expected to further validate the liquid biopsy technology and accelerate its adoption in breast cancer diagnostics.
Research Analyst Overview
- The market is experiencing significant advancements in the realm of disease management and cancer screening. The integration of digital PCR and next-generation sequencing technologies enables the detection of epigenetic markers and protein biomarkers, facilitating early risk assessment and disease progression monitoring. Artificial intelligence and machine learning algorithms are utilized to analyze Big Data derived from these tests, enhancing clinical decision support and personalized therapeutic targets. Patient education plays a crucial role in the adoption of liquid biopsies, as they offer improved quality of life and reduced healthcare costs associated with invasive procedures. Tumor burden and cancer stem cells can be effectively monitored through these tests, allowing for more accurate assessment of patient outcomes and informed clinical interventions.
- Data Security and ethical considerations are essential aspects of the market, as sensitive patient information is handled. Point-of-care testing and microfluidic devices are gaining popularity due to their convenience and potential for targeted drug delivery. The market is further fueled by the development of new therapeutic targets and advancements in disease management strategies. The integration of liquid biopsies into public health initiatives and cancer screening programs holds immense potential for improving patient outcomes and reducing healthcare costs. However, ongoing research is required to address the challenges of disease progression and ensure the accuracy and reliability of these tests.
Dive into Technavio's robust research methodology, blending expert interviews, extensive data synthesis, and validated models for unparalleled Breast Cancer Liquid Biopsy Market insights. See full methodology.
|
Market Scope |
|
|
Report Coverage |
Details |
|
Page number |
141 |
|
Base year |
2023 |
|
Historic period |
2018-2022 |
|
Forecast period |
2024-2028 |
|
Growth momentum & CAGR |
Accelerate at a CAGR of 18.06% |
|
Market growth 2024-2028 |
USD 534.8 million |
|
Market structure |
Fragmented |
|
YoY growth 2023-2024(%) |
15.55 |
|
Key countries |
US, Canada, Germany, UK, Italy, France, China, India, Japan, Brazil, Egypt, UAE, Oman, Argentina, KSA, UAE, Brazil, and Rest of World (ROW) |
|
Competitive landscape |
Leading Companies, Market Positioning of Companies, Competitive Strategies, and Industry Risks |
What are the Key Data Covered in this Breast Cancer Liquid Biopsy Market Research and Growth Report?
- CAGR of the Breast Cancer Liquid Biopsy industry during the forecast period
- Detailed information on factors that will drive the growth and forecasting between 2024 and 2028
- Precise estimation of the size of the market and its contribution of the industry in focus to the parent market
- Accurate predictions about upcoming growth and trends and changes in consumer behaviour
- Growth of the market across North America, Europe, Asia, and Rest of World (ROW)
- Thorough analysis of the market's competitive landscape and detailed information about companies
- Comprehensive analysis of factors that will challenge the breast cancer liquid biopsy market growth of industry companies
We can help! Our analysts can customize this breast cancer liquid biopsy market research report to meet your requirements.
 RIA -
RIA - 
