Breast Cancer Therapeutics Market Analysis North America, Europe, Asia, Rest of World (ROW) - US, Canada, Germany, UK, China - Size and Forecast 2024-2028

Breast Cancer Therapeutics Market Analysis North America, Europe, Asia, Rest of World (ROW) - US, Canada, Germany, UK, China - Size and Forecast 2024-2028

Published: Jan 2024 168 Pages SKU: IRTNTR74565

Market Overview at a Glance

$15.64 B
Market Opportunity
8.4%
CAGR
7.49
YoY growth 2023-2024(%)

Breast Cancer Therapeutics Market Size 2024-2028

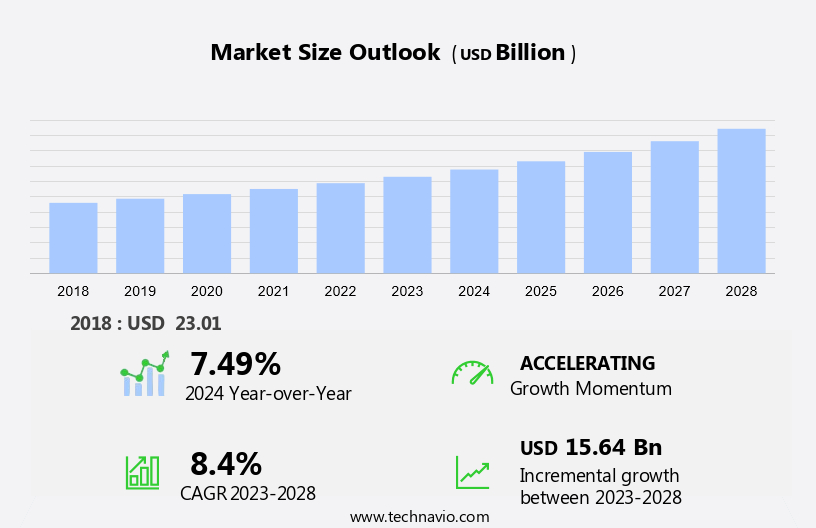
The breast cancer therapeutics market size is forecast to increase by USD 15.64 bn at a CAGR of 8.4% between 2023 and 2028.

  • The market is experiencing significant growth due to the rising prevalence of breast cancer and the emergence of novel therapeutics. Hormone therapy and radiation therapy continue to be popular treatment options, while oncology drugs such as monoclonal antibodies, biosimilars, and vaccines are gaining popularity. Artificial intelligence is revolutionizing cancer diagnostics and treatment plans, enabling early detection and personalized treatment. Online pharmacies and telemedicine are making treatments more accessible, especially in remote areas. The high cost of treatment remains a challenge, but education and nutrition programs are helping to mitigate this issue. Protein-based therapies, gelatin, and tablets are also key components of breast cancer therapeutics.
  • In the US, the market is expected to grow steadily due to increasing awareness and advancements in technology and treatment methods.
  • What will be the Size of the Breast Cancer Therapeutics Market During the Forecast Period?

    Breast Cancer Therapeutics Market Size

     Request Free Sample

  • The market encompasses a range of treatments designed to combat this prevalent form of cancer among females. Key therapeutic approaches include chemotherapy, radiation therapy, hormone therapy, targeted therapy, and immunotherapy. Oncology drugs and therapeutics play a pivotal role in addressing breast cancer, targeting various proteins and cells, such as milk ducts, milk-producing lobules, and tumors. Breast cancer awareness initiatives and screening programs are instrumental in early detection, leading to improved patient outcomes. Artificial intelligence and advanced diagnostics are increasingly utilized to enhance the accuracy of diagnoses, enabling more effective interventions. Breast cancer can manifest as lumps, red patches, pain, swelling, or symptoms affecting the nipple, bones, breathing, or lymph nodes.
  • Surgical tumor removal and medications, including hormonal therapies, are essential components of treatment plans. Despite advancements, breast cancer continues to pose significant health challenges, with ongoing research and innovation required to address the complexities of this disease.
  • How is this Breast Cancer Therapeutics Industry segmented and which is the largest segment?

    The breast cancer therapeutics industry research report provides comprehensive data (region-wise segment analysis), with forecasts and estimates in "USD billion" for the period 2024-2028, as well as historical data from 2018-2022 for the following segments.
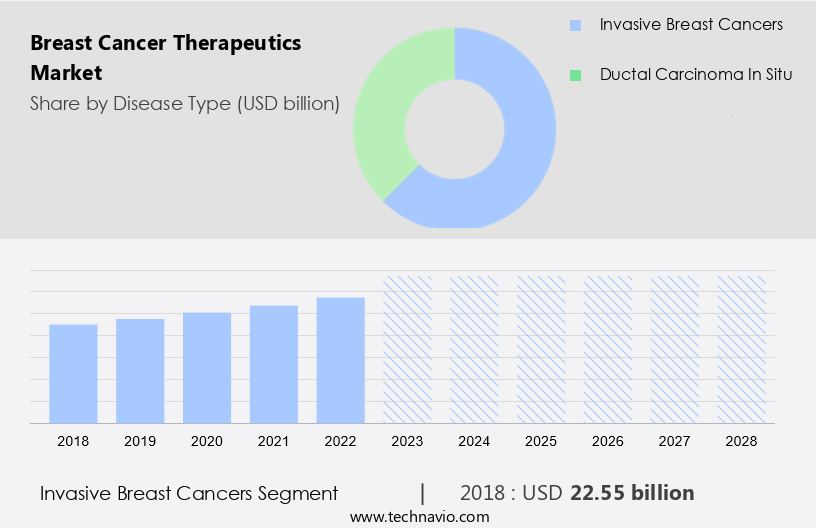
    • Disease Type
      • Invasive breast cancers
      • Ductal carcinoma in situ
    • Therapy
      • Targeted therapy
      • Hormonal therapy
      • Chemotherapy
    • Geography
      • North America
        • Canada
        • US
      • Europe
        • Germany
        • UK
      • Asia
        • China
      • Rest of World (ROW)

      By Disease Type Insights

      The invasive breast cancers segment is estimated to witness significant growth during the forecast period. Invasive ductal carcinoma, also known as infiltrating ductal carcinoma, is the most prevalent type of breast cancer, accounting for approximately 80% of diagnoses. This form of cancer arises when cancerous cells invade the fibrous or fatty tissue of the breast beyond the milk ducts. Symptoms include breast swelling, skin irritation, pain, nipple discomfort, redness, and nipple discharge, among others. Risk factors include genetics, hormonal imbalances, obesity, alcohol intake, and prior radiation therapy. Hormonal therapies, such as tamoxifen and aromatase inhibitors, chemotherapy, radiation therapy, targeted therapies, including Herceptin for HER2-positive tumors, and immunotherapies are common treatments. Early detection through breast cancer awareness campaigns, screening programs, and regular self-examinations contribute to improved survival probabilities and reduced morbidity.

      The development of oncology drugs and therapeutics, including proteins and biosimilars, continues to advance treatment options. Government support, hospital visits, and recovery rates are crucial aspects of breast cancer care. Hormonal therapy, obesity, and family history are significant factors in cancer type analysis. Hospital pharmacies and online pharmacies provide access to medications.

      Breast Cancer Therapeutics Market Size

      Get a glance at the market report of various segments Request Free Sample

      The Invasive breast cancers segment was valued at USD 22.55 bn in 2018 and showed a gradual increase during the forecast period.

      Regional Analysis

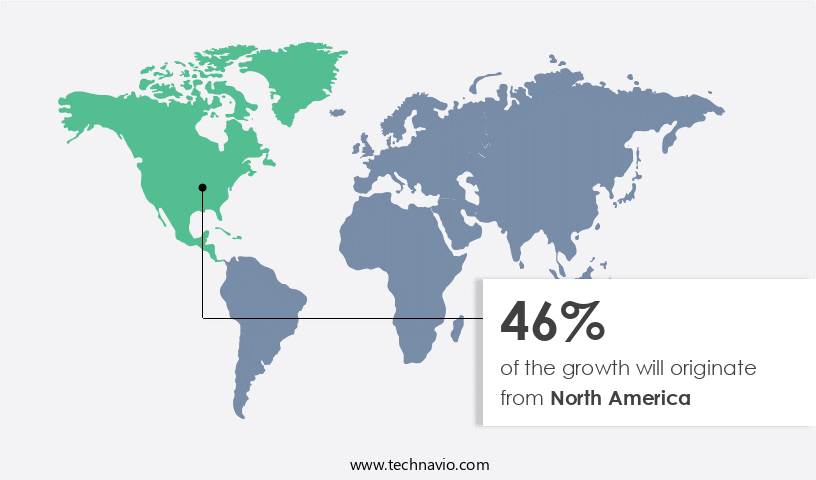
      North America is estimated to contribute 46% to the growth of the global market during the forecast period. Technavio’s analysts have elaborately explained the regional trends and drivers that shape the market during the forecast period.

      Breast Cancer Therapeutics Market Share by Geography

      For more insights on the market size of various regions, Request Free Sample

      The North American the market is experiencing significant growth due to the availability of reimbursement schemes in countries like the US and Canada. In the US, the Centers for Medicare & Medicaid Services (CMS) covers the treatment and diagnosis of breast cancer, including Trastuzumab and IBRANCE. CMS also introduced value-based care models to manage therapeutic costs. Approximately 264,000 breast cancer cases are diagnosed in women and 2,400 cases in men annually In the US. Breast cancer therapeutics include chemotherapy, radiation therapy, hormone therapy, targeted therapy, and immunotherapy. Hormonal therapies, such as Herceptin, play a crucial role in treating breast cancer, especially in early stages.

      Obesity, alcohol intake, hormonal problems, menopause, family history, and cancer type are significant factors influencing breast cancer risk. The market for oncology drugs and therapeutics, including proteins, is expanding due to advancements in technology, such as artificial intelligence, which aids in breast cancer diagnosis and treatment. The high cost of these therapeutics necessitates ongoing government support and hospital visits for recovery. Breast cancer can manifest as lumps, red patches, pain, swelling, lymph node involvement, and breathing problems. Early detection through screening programs and timely treatment can significantly improve survival probabilities and reduce morbidity.

      Market Dynamics

      Our researchers analyzed the data with 2023 as the base year, along with the key drivers, trends, and challenges. A holistic analysis of drivers will help companies refine their marketing strategies to gain a competitive advantage.

      What are the key market drivers leading to the rise In the adoption of Breast Cancer Therapeutics Industry?

      • Rising prevalence of breast cancer is the key driver of the market.Breast cancer is the most frequently diagnosed cancer among women globally, with the second highest mortality rate. In the US, approximately 278,000 new cases and 50,000 deaths occur annually. The therapeutic approach for breast cancer includes chemotherapy, radiation therapy, hormone therapy, targeted therapy, and immunotherapy. Oncology drugs, such as proteins, play a significant role In these therapies. Early detection through breast cancer awareness and screening programs is crucial, yet the risk of breast cancer remains constant. Factors contributing to breast cancer include hormonal imbalances, obesity, alcohol intake, menopause, family history, and cancer type. Hormonal therapies, such as Herceptin, and biosimilars are essential treatments for breast cancer.

        The market for breast cancer therapeutics is dynamic, with ongoing research and development in artificial intelligence and cancer cell analysis. Patients undergo surgical tumor removal, receive medications, and visit hospitals for treatments and recovery. Breast cancer can manifest as lumps, red patches, pain, swelling, lymph node involvement, and breathing problems. The disease can spread to the brain, bones, and other organs. Genes, specifically the presence of a positive HER2 receptor, influence the progression of breast cancer. Government support and access to hospital pharmacies and online pharmacies facilitate the delivery of these essential treatments.

      What are the market trends shaping the Breast Cancer Therapeutics market?

      • Emerging novel therapeutics is the upcoming market trend.Breast cancer therapeutics are advancing with innovative approaches such as combination therapies, vaccines, PARP inhibitors, and CDK inhibitors. For instance, the combination of ZEJULA and KEYTRUDA, a PARP inhibitor and an anti-PD-1 immunotherapy respectively, has shown promising results in Phase I/II clinical trials for treating triple-negative breast cancer. KEYTRUDA, developed by Merck, inhibits the PD-1 protein in lymphocytes, while ZEJULA, manufactured by TESARO, breaks DNA strands in tumor cells. Another example is Atezolizumab, a PD-L1 inhibitor by F. Hoffmann La Roche Ltd, which is a fully humanized, engineered monoclonal antibody. These therapeutic approaches, including hormone therapy, chemotherapy, radiation therapy, targeted therapy, and immunotherapy, are transforming breast cancer treatment.

        Hormone therapy, which targets hormonal imbalances, has shown significant improvements in survival probabilities, particularly for early-stage breast cancer. Mortality rates have decreased due to advancements in breast cancer awareness, screening programs, and early detection. However, challenges remain, including morbidity, brain metastasis, and the development of resistance to certain treatments. The use of artificial intelligence and gene analysis is also becoming increasingly important in cancer type analysis and personalized treatment plans. Obesity, alcohol intake, hormonal problems, menopause, family history, and cancer type are all factors that influence breast cancer risk and treatment options. The oncology drugs/therapeutics market continues to expand, with hospital visits and recovery rates increasing.

        Government support and the availability of medications through hospital pharmacies and online pharmacies are also critical factors in improving patient access to these life-saving treatments.

      What challenges does the Breast Cancer Therapeutics Industry face during its growth?

      • High cost of treatment is a key challenge affecting the industry growth.Breast cancer therapeutics encompass a range of approaches, including chemotherapy, radiation therapy, hormone therapy, targeted therapy, and immunotherapy. These oncology drugs and therapeutics are often derived from proteins and can be costly, limiting access and increasing the financial burden for patients. For instance, Avastin (bevacizumab) and KADCYLA, indicated to treat breast cancer, cost approximately USD50,000 and USD115,974 per treatment episode, respectively. Emerging targeted therapies, such as monoclonal antibodies, further contribute to the high costs. Early detection through breast cancer awareness and screening programs is crucial for improving survival probabilities, especially for those diagnosed with early-stage breast cancer. However, morbidity remains a concern, with symptoms including lumps, nipple changes, red patches, pain, swelling, lymph node involvement, and breathing problems.

        Hormonal therapies, such as hormone problem treatments during menopause and obesity, can also impact breast cancer risk. The government supports various initiatives to increase access to these treatments, but the high costs remain a challenge. Patients may seek treatments through hospital visits, hospital pharmacies, or online pharmacies for affordability. Genetic factors, including family history and cancer type analysis, also play a role in breast cancer development and treatment.

      Exclusive Customer Landscape

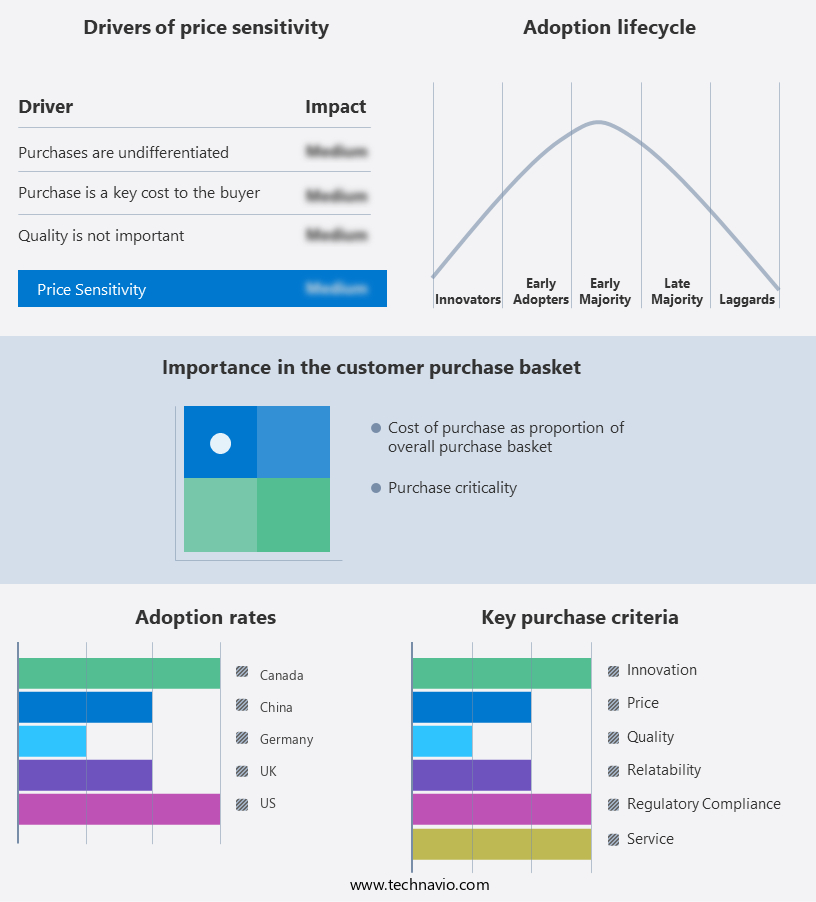
      The breast cancer therapeutics market forecasting report includes the adoption lifecycle of the market, covering from the innovator’s stage to the laggard’s stage. It focuses on adoption rates in different regions based on penetration. Furthermore, the breast cancer therapeutics market report also includes key purchase criteria and drivers of price sensitivity to help companies evaluate and develop their market growth analysis strategies.

      Breast Cancer Therapeutics Market Share by Geography

       Customer Landscape

      Key Companies & Market Insights

      Companies are implementing various strategies, such as strategic alliances, breast cancer therapeutics market forecast, partnerships, mergers and acquisitions, geographical expansion, and product/service launches, to enhance their presence In the industry.

      AbbVie Inc. - The market encompasses various anti-neoplastic agents, including Ibrutinib. This medication is formulated as hard gelatin capsules, tablets, film-coated tablets, and suspension for oral administration. Ibrutinib functions as a crucial therapeutic option, contributing significantly to the breast cancer treatment landscape. It is essential to note that this discussion is focused on the therapeutic class and its role withIn the broader context of breast cancer treatments, without making any direct references to specific companies or their products.

      The industry research and growth report includes detailed analyses of the competitive landscape of the market and information about key companies, including:

      • AbbVie Inc.
      • Amgen Inc.
      • AstraZeneca Plc
      • Bristol Myers Squibb Co.
      • Clovis Oncology Inc.
      • Daiichi Sankyo Co. Ltd.
      • Eisai Co. Ltd.
      • Eli Lilly and Co.
      • Exelixis Inc.
      • F. Hoffmann La Roche Ltd.
      • GlaxoSmithKline Plc
      • Merck and Co. Inc.
      • Novartis AG
      • PerkinElmer Inc
      • Pfizer Inc.
      • Puma Biotechnology Inc.
      • Sanofi SA
      • Teva Pharmaceutical Industries Ltd.
      • Viatris Inc.

      Qualitative and quantitative analysis of companies has been conducted to help clients understand the wider business environment as well as the strengths and weaknesses of key industry players. Data is qualitatively analyzed to categorize companies as pure play, category-focused, industry-focused, and diversified; it is quantitatively analyzed to categorize companies as dominant, leading, strong, tentative, and weak.

      Research Analyst Overview

      The market encompasses a range of treatments designed to combat this prevalent form of cancer in females. The therapeutic approaches include chemotherapy, radiation therapy, hormone therapy, targeted therapy, and immunotherapy. These oncology drugs and therapeutics aim to inhibit the growth and spread of breast cancer cells, which originate from the milk ducts and milk-producing lobules In the breast. Breast cancer is a significant health concern, with a substantial number of diagnoses and associated morbidity and mortality rates. Early detection through screening programs is crucial for improving survival probabilities. The disease can manifest as lumps, red patches, pain, swelling, or other symptoms, and may metastasize to bones, lymph nodes, or other organs, such as the brain.

      Chemotherapy, a systemic treatment, uses medications to destroy rapidly dividing cells, including cancer cells. Radiation therapy, on the other hand, utilizes high-energy radiation to damage the DNA of cancer cells, inhibiting their growth and multiplication. Hormone therapy targets the hormonal imbalances that contribute to breast cancer growth, particularly in postmenopausal women. Targeted therapy and immunotherapy represent newer therapeutic approaches. Targeted therapy focuses on specific proteins or genes that contribute to cancer growth, while immunotherapy harnesses the power of the immune system to attack cancer cells. Proteins such as Herceptin, which targets the HER2 receptor, have revolutionized breast cancer treatment, particularly for those with a positive HER2 receptor.

      Biosimilars, which are similar but not identical to existing biologic drugs, are increasingly being used In the market due to their cost-effectiveness and comparable efficacy. The market is also witnessing the emergence of artificial intelligence and advanced analytics to improve diagnosis and treatment planning. Breast cancer can significantly impact a patient's quality of life, leading to hospital visits, extended recovery periods, and potential complications such as breathing problems, obesity, alcohol intake, hormonal imbalances, menopause, and family history. Government support and public awareness campaigns are essential for promoting early detection and improving access to effective treatments. In conclusion, the market is characterized by a diverse range of treatments and ongoing research and innovation.

      The ultimate goal is to improve patient outcomes, reduce morbidity and mortality, and enhance the overall quality of life for those affected by this disease.

      Market Scope

      Report Coverage

      Details

      Page number

      168

      Base year

      2023

      Historic period

      2018-2022

      Forecast period

      2024-2028

      Growth momentum & CAGR

      Accelerate at a CAGR of 8.4%

      Market growth 2024-2028

      USD 15.64 billion

      Market structure

      Fragmented

      YoY growth 2023-2024(%)

      7.49

      Key countries

      US, Canada, Germany, UK, and China

      Competitive landscape

      Leading Companies, Market Positioning of Companies, Competitive Strategies, and Industry Risks

      Request Free Sample

      What are the Key Data Covered in this Breast Cancer Therapeutics Market Research and Growth Report?

      • CAGR of the Breast Cancer Therapeutics industry during the forecast period
      • Detailed information on factors that will drive the growth and forecasting between 2024 and 2028
      • Precise estimation of the size of the market and its contribution of the industry in focus to the parent market
      • Accurate predictions about upcoming growth and trends and changes in consumer behaviour
      • Growth of the market across North America, Europe, Asia, and Rest of World (ROW)
      • Thorough analysis of the market’s competitive landscape and detailed information about companies
      • Comprehensive analysis of factors that will challenge the breast cancer therapeutics market growth of industry companies

      We can help! Our analysts can customize this breast cancer therapeutics market research report to meet your requirements.

      Get in touch


      1 Executive Summary

      • 1.1 Market overview
        • Exhibit 01: Executive Summary – Chart on Market Overview
        • Exhibit 02: Executive Summary – Data Table on Market Overview
        • Exhibit 03: Executive Summary – Chart on Global Market Characteristics
        • Exhibit 04: Executive Summary – Chart on Market by Geography
        • Exhibit 05: Executive Summary – Chart on Market Segmentation by Disease Type
        • Exhibit 06: Executive Summary – Chart on Market Segmentation by Therapy
        • Exhibit 07: Executive Summary – Chart on Incremental Growth
        • Exhibit 08: Executive Summary – Data Table on Incremental Growth
        • Exhibit 09: Executive Summary – Chart on Vendor Market Positioning

      2 Market Landscape

      • 2.1 Market ecosystem
        • Exhibit 10: Parent market
        • Exhibit 11: Market Characteristics

      3 Market Sizing

      • 3.1 Market definition
        • Exhibit 12: Offerings of vendors included in the market definition
      • 3.2 Market segment analysis
        • Exhibit 13: Market segments
      • 3.3 Market size 2023
        • 3.4 Market outlook: Forecast for 2023-2028
          • Exhibit 14: Chart on Global - Market size and forecast 2023-2028 ($ billion)
          • Exhibit 15: Data Table on Global - Market size and forecast 2023-2028 ($ billion)
          • Exhibit 16: Chart on Global Market: Year-over-year growth 2023-2028 (%)
          • Exhibit 17: Data Table on Global Market: Year-over-year growth 2023-2028 (%)

        4 Historic Market Size

        • 4.1 Global breast cancer therapeutics market 2018 - 2022
          • Exhibit 18: Historic Market Size – Data Table on global breast cancer therapeutics market 2018 - 2022 ($ billion)
        • 4.2 Disease Type Segment Analysis 2018 - 2022
          • Exhibit 19: Historic Market Size – Disease Type Segment 2018 - 2022 ($ billion)
        • 4.3 Therapy Segment Analysis 2018 - 2022
          • Exhibit 20: Historic Market Size – Therapy Segment 2018 - 2022 ($ billion)
        • 4.4 Geography Segment Analysis 2018 - 2022
          • Exhibit 21: Historic Market Size – Geography Segment 2018 - 2022 ($ billion)
        • 4.5 Country Segment Analysis 2018 - 2022
          • Exhibit 22: Historic Market Size – Country Segment 2018 - 2022 ($ billion)

        5 Five Forces Analysis

        • 5.1 Five forces summary
          • Exhibit 23: Five forces analysis - Comparison between 2023 and 2028
        • 5.2 Bargaining power of buyers
          • Exhibit 24: Chart on Bargaining power of buyers – Impact of key factors 2023 and 2028
        • 5.3 Bargaining power of suppliers
          • Exhibit 25: Bargaining power of suppliers – Impact of key factors in 2023 and 2028
        • 5.4 Threat of new entrants
          • Exhibit 26: Threat of new entrants – Impact of key factors in 2023 and 2028
        • 5.5 Threat of substitutes
          • Exhibit 27: Threat of substitutes – Impact of key factors in 2023 and 2028
        • 5.6 Threat of rivalry
          • Exhibit 28: Threat of rivalry – Impact of key factors in 2023 and 2028
        • 5.7 Market condition
          • Exhibit 29: Chart on Market condition - Five forces 2023 and 2028

        6 Market Segmentation by Disease Type

        • 6.1 Market segments
          • Exhibit 30: Chart on Disease Type - Market share 2023-2028 (%)
          • Exhibit 31: Data Table on Disease Type - Market share 2023-2028 (%)
        • 6.2 Comparison by Disease Type
          • Exhibit 32: Chart on Comparison by Disease Type
          • Exhibit 33: Data Table on Comparison by Disease Type
        • 6.3 Invasive breast cancers - Market size and forecast 2023-2028
          • Exhibit 34: Chart on Invasive breast cancers - Market size and forecast 2023-2028 ($ billion)
          • Exhibit 35: Data Table on Invasive breast cancers - Market size and forecast 2023-2028 ($ billion)
          • Exhibit 36: Chart on Invasive breast cancers - Year-over-year growth 2023-2028 (%)
          • Exhibit 37: Data Table on Invasive breast cancers - Year-over-year growth 2023-2028 (%)
        • 6.4 Ductal carcinoma in situ - Market size and forecast 2023-2028
          • Exhibit 38: Chart on Ductal carcinoma in situ - Market size and forecast 2023-2028 ($ billion)
          • Exhibit 39: Data Table on Ductal carcinoma in situ - Market size and forecast 2023-2028 ($ billion)
          • Exhibit 40: Chart on Ductal carcinoma in situ - Year-over-year growth 2023-2028 (%)
          • Exhibit 41: Data Table on Ductal carcinoma in situ - Year-over-year growth 2023-2028 (%)
        • 6.5 Market opportunity by Disease Type
          • Exhibit 42: Market opportunity by Disease Type ($ billion)
          • Exhibit 43: Data Table on Market opportunity by Disease Type ($ billion)

        7 Market Segmentation by Therapy

        • 7.1 Market segments
          • Exhibit 44: Chart on Therapy - Market share 2023-2028 (%)
          • Exhibit 45: Data Table on Therapy - Market share 2023-2028 (%)
        • 7.2 Comparison by Therapy
          • Exhibit 46: Chart on Comparison by Therapy
          • Exhibit 47: Data Table on Comparison by Therapy
        • 7.3 Targeted therapy - Market size and forecast 2023-2028
          • Exhibit 48: Chart on Targeted therapy - Market size and forecast 2023-2028 ($ billion)
          • Exhibit 49: Data Table on Targeted therapy - Market size and forecast 2023-2028 ($ billion)
          • Exhibit 50: Chart on Targeted therapy - Year-over-year growth 2023-2028 (%)
          • Exhibit 51: Data Table on Targeted therapy - Year-over-year growth 2023-2028 (%)
        • 7.4 Hormonal therapy - Market size and forecast 2023-2028
          • Exhibit 52: Chart on Hormonal therapy - Market size and forecast 2023-2028 ($ billion)
          • Exhibit 53: Data Table on Hormonal therapy - Market size and forecast 2023-2028 ($ billion)
          • Exhibit 54: Chart on Hormonal therapy - Year-over-year growth 2023-2028 (%)
          • Exhibit 55: Data Table on Hormonal therapy - Year-over-year growth 2023-2028 (%)
        • 7.5 Chemotherapy - Market size and forecast 2023-2028
          • Exhibit 56: Chart on Chemotherapy - Market size and forecast 2023-2028 ($ billion)
          • Exhibit 57: Data Table on Chemotherapy - Market size and forecast 2023-2028 ($ billion)
          • Exhibit 58: Chart on Chemotherapy - Year-over-year growth 2023-2028 (%)
          • Exhibit 59: Data Table on Chemotherapy - Year-over-year growth 2023-2028 (%)
        • 7.6 Market opportunity by Therapy
          • Exhibit 60: Market opportunity by Therapy ($ billion)
          • Exhibit 61: Data Table on Market opportunity by Therapy ($ billion)

        8 Customer Landscape

        • 8.1 Customer landscape overview
          • Exhibit 62: Analysis of price sensitivity, lifecycle, customer purchase basket, adoption rates, and purchase criteria

        9 Geographic Landscape

        • 9.1 Geographic segmentation
          • Exhibit 63: Chart on Market share by geography 2023-2028 (%)
          • Exhibit 64: Data Table on Market share by geography 2023-2028 (%)
        • 9.2 Geographic comparison
          • Exhibit 65: Chart on Geographic comparison
          • Exhibit 66: Data Table on Geographic comparison
        • 9.3 North America - Market size and forecast 2023-2028
          • Exhibit 67: Chart on North America - Market size and forecast 2023-2028 ($ billion)
          • Exhibit 68: Data Table on North America - Market size and forecast 2023-2028 ($ billion)
          • Exhibit 69: Chart on North America - Year-over-year growth 2023-2028 (%)
          • Exhibit 70: Data Table on North America - Year-over-year growth 2023-2028 (%)
        • 9.4 Europe - Market size and forecast 2023-2028
          • Exhibit 71: Chart on Europe - Market size and forecast 2023-2028 ($ billion)
          • Exhibit 72: Data Table on Europe - Market size and forecast 2023-2028 ($ billion)
          • Exhibit 73: Chart on Europe - Year-over-year growth 2023-2028 (%)
          • Exhibit 74: Data Table on Europe - Year-over-year growth 2023-2028 (%)
        • 9.5 Asia - Market size and forecast 2023-2028
          • Exhibit 75: Chart on Asia - Market size and forecast 2023-2028 ($ billion)
          • Exhibit 76: Data Table on Asia - Market size and forecast 2023-2028 ($ billion)
          • Exhibit 77: Chart on Asia - Year-over-year growth 2023-2028 (%)
          • Exhibit 78: Data Table on Asia - Year-over-year growth 2023-2028 (%)
        • 9.6 Rest of World (ROW) - Market size and forecast 2023-2028
          • Exhibit 79: Chart on Rest of World (ROW) - Market size and forecast 2023-2028 ($ billion)
          • Exhibit 80: Data Table on Rest of World (ROW) - Market size and forecast 2023-2028 ($ billion)
          • Exhibit 81: Chart on Rest of World (ROW) - Year-over-year growth 2023-2028 (%)
          • Exhibit 82: Data Table on Rest of World (ROW) - Year-over-year growth 2023-2028 (%)
        • 9.7 US - Market size and forecast 2023-2028
          • Exhibit 83: Chart on US - Market size and forecast 2023-2028 ($ billion)
          • Exhibit 84: Data Table on US - Market size and forecast 2023-2028 ($ billion)
          • Exhibit 85: Chart on US - Year-over-year growth 2023-2028 (%)
          • Exhibit 86: Data Table on US - Year-over-year growth 2023-2028 (%)
        • 9.8 Germany - Market size and forecast 2023-2028
          • Exhibit 87: Chart on Germany - Market size and forecast 2023-2028 ($ billion)
          • Exhibit 88: Data Table on Germany - Market size and forecast 2023-2028 ($ billion)
          • Exhibit 89: Chart on Germany - Year-over-year growth 2023-2028 (%)
          • Exhibit 90: Data Table on Germany - Year-over-year growth 2023-2028 (%)
        • 9.9 Canada - Market size and forecast 2023-2028
          • Exhibit 91: Chart on Canada - Market size and forecast 2023-2028 ($ billion)
          • Exhibit 92: Data Table on Canada - Market size and forecast 2023-2028 ($ billion)
          • Exhibit 93: Chart on Canada - Year-over-year growth 2023-2028 (%)
          • Exhibit 94: Data Table on Canada - Year-over-year growth 2023-2028 (%)
        • 9.10 UK - Market size and forecast 2023-2028
          • Exhibit 95: Chart on UK - Market size and forecast 2023-2028 ($ billion)
          • Exhibit 96: Data Table on UK - Market size and forecast 2023-2028 ($ billion)
          • Exhibit 97: Chart on UK - Year-over-year growth 2023-2028 (%)
          • Exhibit 98: Data Table on UK - Year-over-year growth 2023-2028 (%)
        • 9.11 China - Market size and forecast 2023-2028
          • Exhibit 99: Chart on China - Market size and forecast 2023-2028 ($ billion)
          • Exhibit 100: Data Table on China - Market size and forecast 2023-2028 ($ billion)
          • Exhibit 101: Chart on China - Year-over-year growth 2023-2028 (%)
          • Exhibit 102: Data Table on China - Year-over-year growth 2023-2028 (%)
        • 9.12 Market opportunity by geography
          • Exhibit 103: Market opportunity by geography ($ billion)
          • Exhibit 104: Data Tables on Market opportunity by geography ($ billion)

        10 Drivers, Challenges, and Trends

        • 10.1 Market drivers
          • 10.2 Market challenges
            • 10.3 Impact of drivers and challenges
              • Exhibit 105: Impact of drivers and challenges in 2023 and 2028
            • 10.4 Market trends

              11 Vendor Landscape

              • 11.1 Overview
                • 11.2 Vendor landscape
                  • Exhibit 106: Overview on Criticality of inputs and Factors of differentiation
                • 11.3 Landscape disruption
                  • Exhibit 107: Overview on factors of disruption
                • 11.4 Industry risks
                  • Exhibit 108: Impact of key risks on business

                12 Vendor Analysis

                • 12.1 Vendors covered
                  • Exhibit 109: Vendors covered
                • 12.2 Market positioning of vendors
                  • Exhibit 110: Matrix on vendor position and classification
                • 12.3 AbbVie Inc.
                  • Exhibit 111: AbbVie Inc. - Overview
                  • Exhibit 112: AbbVie Inc. - Product / Service
                  • Exhibit 113: AbbVie Inc. - Key news
                  • Exhibit 114: AbbVie Inc. - Key offerings
                • 12.4 Amgen Inc.
                  • Exhibit 115: Amgen Inc. - Overview
                  • Exhibit 116: Amgen Inc. - Product / Service
                  • Exhibit 117: Amgen Inc. - Key offerings
                • 12.5 AstraZeneca Plc
                  • Exhibit 118: AstraZeneca Plc - Overview
                  • Exhibit 119: AstraZeneca Plc - Product / Service
                  • Exhibit 120: AstraZeneca Plc - Key news
                  • Exhibit 121: AstraZeneca Plc - Key offerings
                • 12.6 Bristol Myers Squibb Co.
                  • Exhibit 122: Bristol Myers Squibb Co. - Overview
                  • Exhibit 123: Bristol Myers Squibb Co. - Product / Service
                  • Exhibit 124: Bristol Myers Squibb Co. - Key news
                  • Exhibit 125: Bristol Myers Squibb Co. - Key offerings
                • 12.7 Clovis Oncology Inc.
                  • Exhibit 126: Clovis Oncology Inc. - Overview
                  • Exhibit 127: Clovis Oncology Inc. - Product / Service
                  • Exhibit 128: Clovis Oncology Inc. - Key offerings
                • 12.8 Daiichi Sankyo Co. Ltd.
                  • Exhibit 129: Daiichi Sankyo Co. Ltd. - Overview
                  • Exhibit 130: Daiichi Sankyo Co. Ltd. - Product / Service
                  • Exhibit 131: Daiichi Sankyo Co. Ltd. - Key news
                  • Exhibit 132: Daiichi Sankyo Co. Ltd. - Key offerings
                • 12.9 Eisai Co. Ltd.
                  • Exhibit 133: Eisai Co. Ltd. - Overview
                  • Exhibit 134: Eisai Co. Ltd. - Business segments
                  • Exhibit 135: Eisai Co. Ltd. - Key offerings
                  • Exhibit 136: Eisai Co. Ltd. - Segment focus
                • 12.10 Eli Lilly and Co.
                  • Exhibit 137: Eli Lilly and Co. - Overview
                  • Exhibit 138: Eli Lilly and Co. - Product / Service
                  • Exhibit 139: Eli Lilly and Co. - Key news
                  • Exhibit 140: Eli Lilly and Co. - Key offerings
                • 12.11 Exelixis Inc.
                  • Exhibit 141: Exelixis Inc. - Overview
                  • Exhibit 142: Exelixis Inc. - Product / Service
                  • Exhibit 143: Exelixis Inc. - Key offerings
                • 12.12 F. Hoffmann La Roche Ltd.
                  • Exhibit 144: F. Hoffmann La Roche Ltd. - Overview
                  • Exhibit 145: F. Hoffmann La Roche Ltd. - Business segments
                  • Exhibit 146: F. Hoffmann La Roche Ltd. - Key news
                  • Exhibit 147: F. Hoffmann La Roche Ltd. - Key offerings
                  • Exhibit 148: F. Hoffmann La Roche Ltd. - Segment focus
                • 12.13 GlaxoSmithKline Plc
                  • Exhibit 149: GlaxoSmithKline Plc - Overview
                  • Exhibit 150: GlaxoSmithKline Plc - Business segments
                  • Exhibit 151: GlaxoSmithKline Plc - Key news
                  • Exhibit 152: GlaxoSmithKline Plc - Key offerings
                  • Exhibit 153: GlaxoSmithKline Plc - Segment focus
                • 12.14 Merck and Co. Inc.
                  • Exhibit 154: Merck and Co. Inc. - Overview
                  • Exhibit 155: Merck and Co. Inc. - Business segments
                  • Exhibit 156: Merck and Co. Inc. - Key news
                  • Exhibit 157: Merck and Co. Inc. - Key offerings
                  • Exhibit 158: Merck and Co. Inc. - Segment focus
                • 12.15 Novartis AG
                  • Exhibit 159: Novartis AG - Overview
                  • Exhibit 160: Novartis AG - Business segments
                  • Exhibit 161: Novartis AG - Key offerings
                  • Exhibit 162: Novartis AG - Segment focus
                • 12.16 Pfizer Inc.
                  • Exhibit 163: Pfizer Inc. - Overview
                  • Exhibit 164: Pfizer Inc. - Product / Service
                  • Exhibit 165: Pfizer Inc. - Key news
                  • Exhibit 166: Pfizer Inc. - Key offerings
                • 12.17 Viatris Inc.
                  • Exhibit 167: Viatris Inc. - Overview
                  • Exhibit 168: Viatris Inc. - Business segments
                  • Exhibit 169: Viatris Inc. - Key news
                  • Exhibit 170: Viatris Inc. - Key offerings
                  • Exhibit 171: Viatris Inc. - Segment focus

                13 Appendix

                • 13.1 Scope of the report
                  • 13.2 Inclusions and exclusions checklist
                    • Exhibit 172: Inclusions checklist
                    • Exhibit 173: Exclusions checklist
                  • 13.3 Currency conversion rates for US$
                    • Exhibit 174: Currency conversion rates for US$
                  • 13.4 Research methodology
                    • Exhibit 175: Research methodology
                    • Exhibit 176: Validation techniques employed for market sizing
                    • Exhibit 177: Information sources
                  • 13.5 List of abbreviations
                    • Exhibit 178: List of abbreviations

                  Research Methodology

                  Technavio presents a detailed picture of the market by way of study, synthesis, and summation of data from multiple sources. The analysts have presented the various facets of the market with a particular focus on identifying the key industry influencers. The data thus presented is comprehensive, reliable, and the result of extensive research, both primary and secondary.

                  INFORMATION SOURCES

                  Primary sources

                  • Manufacturers and suppliers
                  • Channel partners
                  • Industry experts
                  • Strategic decision makers

                  Secondary sources

                  • Industry journals and periodicals
                  • Government data
                  • Financial reports of key industry players
                  • Historical data
                  • Press releases

                  DATA ANALYSIS

                  Data Synthesis

                  • Collation of data
                  • Estimation of key figures
                  • Analysis of derived insights

                  Data Validation

                  • Triangulation with data models
                  • Reference against proprietary databases
                  • Corroboration with industry experts

                  REPORT WRITING

                  Qualitative

                  • Market drivers
                  • Market challenges
                  • Market trends
                  • Five forces analysis

                  Quantitative

                  • Market size and forecast
                  • Market segmentation
                  • Geographical insights
                  • Competitive landscape

                  Interested in this report?

                  Get your sample now to see our research methodology and insights!

                  Download Now

                  Frequently Asked Questions

                  Breast Cancer Therapeutics market growth will increase by $ 15.64 bn during 2024-2028 .

                  The Breast Cancer Therapeutics market is expected to grow at a CAGR of 8.4% during 2024-2028 .

                  Breast Cancer Therapeutics market is segmented by Disease Type( Invasive breast cancers, Ductal carcinoma in situ, chemotherapy) Therapy( Targeted therapy, Hormonal therapy, Chemotherapy, Rest of World (ROW))

                  AbbVie Inc., Amgen Inc., AstraZeneca Plc, Bristol Myers Squibb Co., Clovis Oncology Inc., Daiichi Sankyo Co. Ltd., Eisai Co. Ltd., Eli Lilly and Co., Exelixis Inc., F. Hoffmann La Roche Ltd., GlaxoSmithKline Plc, Merck and Co. Inc., Novartis AG, PerkinElmer Inc, Pfizer Inc., Puma Biotechnology Inc., Sanofi SA, Teva Pharmaceutical Industries Ltd., Viatris Inc. are a few of the key vendors in the Breast Cancer Therapeutics market.

                  North America will register the highest growth rate of 46% among the other regions. Therefore, the Breast Cancer Therapeutics market in North America is expected to garner significant business opportunities for the vendors during the forecast period.

                  US, Canada, Germany, UK, China

                  • Rising prevalence of breast cancerCancer or malignant growth is known to occur in different anatomical sites in the body. Globally is the driving factor this market.
                  • cancer affecting the breast is the most frequently diagnosed cancer in women. Breast cancer was the second most common cancer and the fifth most common cause of mortality globally. Although early diagnosis is used as a preventive approach is the driving factor this market.
                  • the risk of breast cancer is unchanged. For instance is the driving factor this market.
                  • as per the CDC is the driving factor this market.
                  • each year is the driving factor this market.
                  • about 237 is the driving factor this market.
                  • 000 cases and about 2 is the driving factor this market.
                  • 100 cases of breast cancer are diagnosed in women and men is the driving factor this market.
                  • respectively is the driving factor this market.
                  • in the US. About 41 is the driving factor this market.
                  • 000 women and 450 men in the US die each year due to breast cancer. The incidence and mortality of cancer differ in countries because it has different risk factors that increase the risk of breast cancer in predisposed individuals. Some of the risk factors for breast cancer include BRCA1 or BRCA2 mutations is the driving factor this market.
                  • dense breast density is the driving factor this market.
                  • abnormal breast biopsy is the driving factor this market.
                  • family history of ovarian or breast cancer is the driving factor this market.
                  • early menarche (age below 12 years) or late menopause (age over 55 years) is the driving factor this market.
                  • hormone replacement therapy is the driving factor this market.
                  • postmenopausal obesity is the driving factor this market.
                  • alcohol consumption is the driving factor this market.
                  • smoking age is the driving factor this market.
                  • and lifestyle. Other factors such as socioeconomic status is the driving factor this market.
                  • education level is the driving factor this market.
                  • and access to care also influence mortality after the disease is diagnosed. These risk factors contribute to the rising prevalence of breast cancer at an exponential rate in the world is the driving factor this market.
                  • which is a major factor driving the growth of the global breast cancer therapeutics market in the forecast period. is the driving factor this market.

                  The Breast Cancer Therapeutics market vendors should focus on grabbing business opportunities from the Invasive breast cancers segment as it accounted for the largest market share in the base year.