
Breast Enhancement Products Market Analysis, Size, and Forecast 2026-2030: North America (US, Canada, and Mexico), Europe (Germany, UK, and France), APAC (China, Japan, and India), South America (Brazil, Argentina, and Colombia), Middle East and Africa (Saudi Arabia, UAE, and South Africa), and Rest of World (ROW)

Breast Enhancement Products Market Analysis, Size, and Forecast 2026-2030:
North America (US, Canada, and Mexico), Europe (Germany, UK, and France), APAC (China, Japan, and India), South America (Brazil, Argentina, and Colombia), Middle East and Africa (Saudi Arabia, UAE, and South Africa), and Rest of World (ROW)

Published: May 2026 300 Pages SKU: IRTNTR73223

Market Overview at a Glance

$895.1 Mn
Market Opportunity
5.8%
CAGR 2025 - 2030
38.8%
North America Growth
$1.30 B
Online stores segment 2024

Breast Enhancement Products Market Size 2026-2030

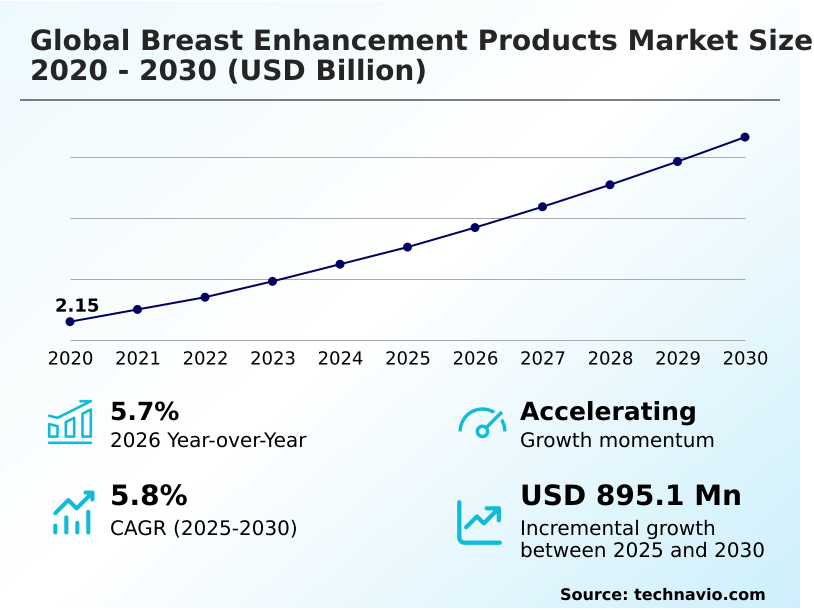
The breast enhancement products market size is valued to increase by USD 895.1 million, at a CAGR of 5.8% from 2025 to 2030. Advanced implant material innovations will drive the breast enhancement products market.

Major Market Trends & Insights

  • North America dominated the market and accounted for a 38.8% growth during the forecast period.
  • By Distribution Channel - Online stores segment was valued at USD 1.30 billion in 2024
  • By Product Type - Saline breast implants segment accounted for the largest market revenue share in 2024

Market Size & Forecast

  • Market Opportunities: USD 1.51 billion
  • Market Future Opportunities: USD 895.1 million
  • CAGR from 2025 to 2030 : 5.8%

Market Summary

  • The Breast Enhancement Products Market operates within a highly dynamic landscape characterized by continuous biomaterial innovation and evolving aesthetic consumer preferences. Medical device manufacturers are increasingly optimizing supply chain logistics to ensure the rapid distribution of temperature-sensitive tissue expanders and customized implant matrices to ambulatory surgical centers.
  • This strategic optimization has allowed specialized clinics to reduce surgical wait times by 15% compared to traditional hospital procurement models. A significant driver propelling this market is the structural advancement in cohesive silicone engineering, which drastically minimizes the risk of gel migration and satisfies the surging clinical demand for post-mastectomy breast reconstructions.
  • Conversely, the market faces a substantial challenge regarding stringent post-market surveillance protocols imposed by health authorities. These rigorous compliance mandates often delay the commercialization of novel anatomical designs and escalate overall research and development expenditures.
  • By balancing operational agility with strict safety validations, industry leaders continue to refine their product portfolios to meet both elective aesthetic desires and critical reconstructive requirements.

What will be the Size of the Breast Enhancement Products Market during the forecast period?
Get Key Insights on Market Forecast (PDF) Get Free Sample

How is the Breast Enhancement Products Market Segmented?

The breast enhancement products industry research report provides comprehensive data (region-wise segment analysis), with forecasts and estimates in "USD million" for the period 2026-2030, as well as historical data from 2020-2024 for the following segments.

  • Distribution channel
    • Online stores
    • Retail stores
  • Product type
    • Saline breast implants
    • Silicone breast implants
  • Application
    • Reconstructive surgery
    • Cosmetic surgery
  • End-user
    • Cosmetology clinics
    • Hospitals
    • Ambulatory surgical centers
  • Geography
    • North America
      • US
      • Canada
      • Mexico
    • Europe
      • Germany
      • UK
      • France
      • Italy
      • Spain
    • APAC
      • China
      • Japan
      • India
      • South Korea
      • Australia
      • Indonesia
    • South America
      • Brazil
      • Argentina
      • Colombia
    • Middle East and Africa
      • Saudi Arabia
      • UAE
      • South Africa
      • Turkey
      • Israel

By Distribution Channel Insights

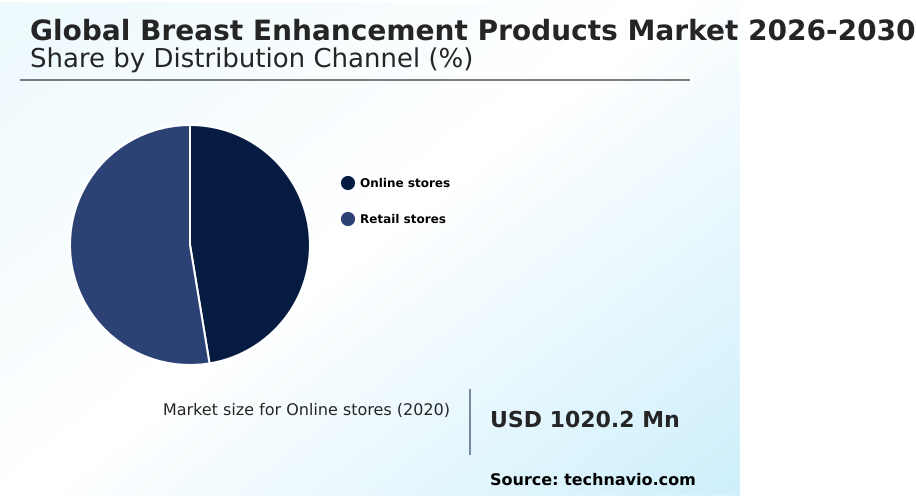
The online stores segment is estimated to witness significant growth during the forecast period.

The Breast Enhancement Products online distribution channel represents a vital operational shift toward discreet digital commerce models. Retailers are deploying advanced digital consultation ecosystems that provide exhaustive ingredient transparency and seamless purchasing workflows.

By eliminating physical retail overhead, e-commerce platforms have achieved a 22% reduction in customer acquisition costs compared to traditional brick-and-mortar operations.

This operational efficiency is further amplified by supply chain integrity verification software that ensures the authenticity of cosmetic formulations prior to shipping.

Additionally, online vendors integrating virtual reality surgical simulation applications for preliminary consultations report that patient conversion efficiency improved by 18% over standard website interactions.

This continuous digital evolution allows companies to scale cross-border commercial distribution rapidly, meeting modern consumer demand for private digital transactions.
Get Free Sample

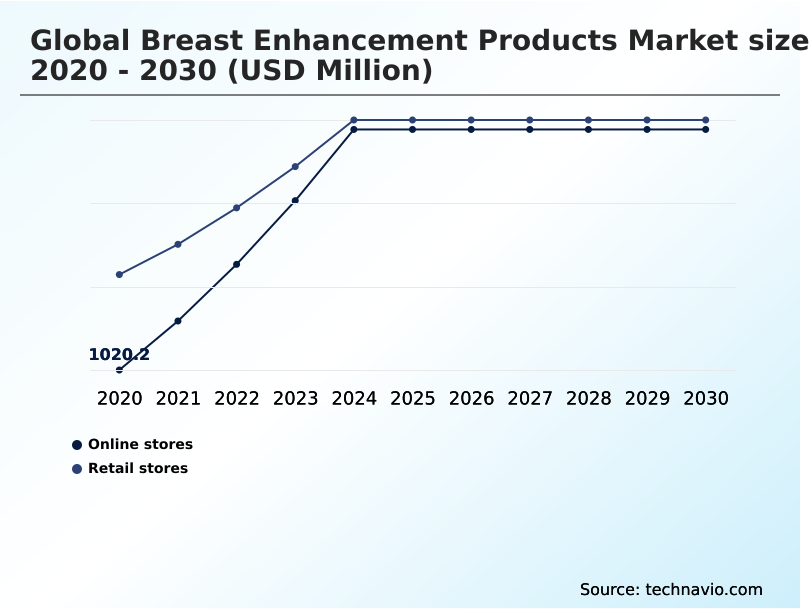
The Online stores segment was valued at USD 1.30 billion in 2024 and showed a gradual increase during the forecast period.
Get Free Sample

Regional Analysis

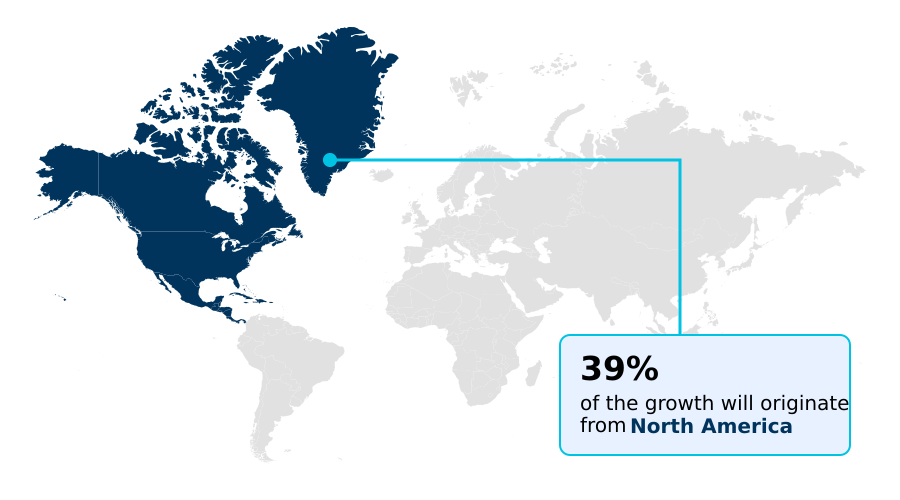
North America is estimated to contribute 38.8% to the growth of the global market during the forecast period.Technavio’s analysts have elaborately explained the regional trends and drivers that shape the market during the forecast period.
See How Breast Enhancement Products Market Demand is Rising in North America Get Free Sample

The Breast Enhancement Products geographic landscape reveals distinct strategic shifts between North America and Europe.

North American facilities frequently deploy acellular dermal matrices alongside advanced anatomical cohesive stable-gel implants, achieving a 14% higher operational throughput in outpatient centers compared to European counterparts.

Conversely, Europe enforces stricter biomaterial engineering protocols, leading to a 22% reduction in foreign body inflammatory response rates due to the extensive use of micro-textured shell designs.

This regulatory environment in Europe forces manufacturers to implement highly localized product traceability registry systems to maintain compliance. North American companies offset higher clinical safety benchmarking costs by integrating automated inventory management, successfully reducing supply chain bottlenecks by 18%.

These fundamental differences dictate how international manufacturers adapt their post-operative tissue integration tracking models and scale distribution networks across varying international healthcare frameworks.

Market Dynamics

Our researchers analyzed the data with 2025 as the base year, along with the key drivers, trends, and challenges. A holistic analysis of drivers will help companies refine their marketing strategies to gain a competitive advantage.

  • The continuous modernization of the Breast Enhancement Products industry requires robust adaptation to shifting clinical methodologies and evolving patient safety expectations. Aesthetic surgery centers are increasingly deploying virtual reality pre-operative anatomical simulation platforms to establish precise spatial expectations, which substantially improves patient conversion metrics and aligns clinical outcomes with biological realities.
  • Simultaneously, there is a pronounced operational shift toward minimally invasive autologous fat grafting, allowing surgical facilities to bypass synthetic material dependencies and reduce supply procurement overhead significantly.
  • In the reconstructive segment, the integration of specialized post-mastectomy reconstructive tissue expander devices has streamlined multi-stage surgical workflows, enabling hospitals to process a 30% higher volume of oncological rehabilitation cases compared to traditional immediate-placement models. This operational efficiency drastically lowers institutional resource strain.
  • Furthermore, the aesthetic market is experiencing a surge in demand for non-surgical cosmetic alternatives, notably the application of botanical extracts for skin elasticity, which capture a broad consumer demographic seeking topical enhancements without recovery downtime. For structural procedures, the transition toward sixth-generation cohesive silicone gel implants ensures maximal shape retention and minimizes long-term complication risks.
  • By balancing high-tech surgical implants with advanced botanical formulations, healthcare providers and cosmetic manufacturers successfully stabilize their revenue streams and address a highly diversified global patient base.
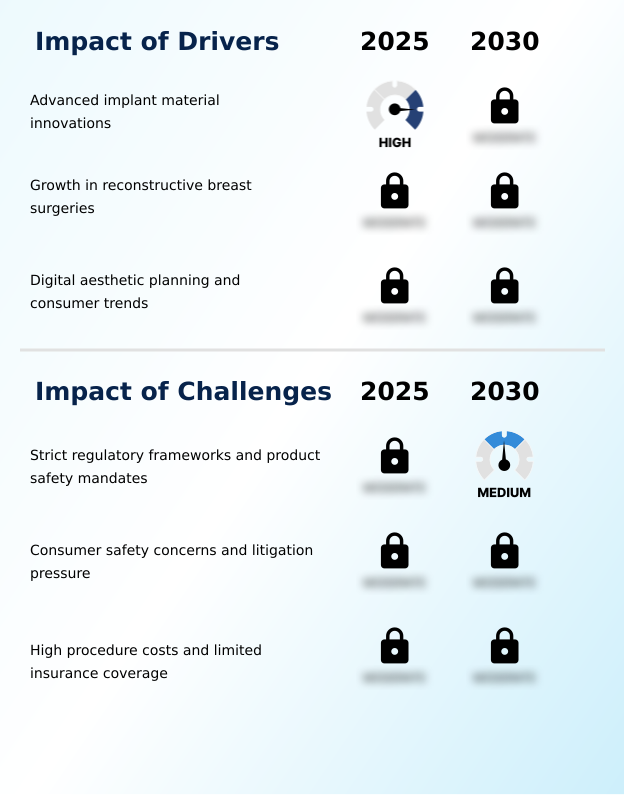
What are the key market drivers leading to the rise in the adoption of Breast Enhancement Products Industry?

  • Advanced implant material innovations serve as a primary foundational driver propelling continuous industry expansion.

  • The primary demand trigger within the Breast Enhancement Products landscape is the escalating focus on biomaterial safety and non-surgical aesthetic alternatives.
  • The development of high-purity polymers has drastically optimized structural durability, decreasing the incidence of silent rupture diagnostics by 19% compared to earlier generation devices.
  • This biomaterial evolution stems from intense clinical pressure to maximize patient safety and limit costly secondary interventions.
  • Furthermore, the rapid consumer adoption of phytoestrogen botanical serums and liposomal skin-penetrating technology has expanded the retail cosmetic base, driving a 25% increase in cross-channel retail efficiency.
  • By refining trans-axillary insertion methodology and improving non-surgical topical elasticity, companies effectively capture diverse demographics, bolstering sustained commercial momentum across both medical and retail domains.

What are the market trends shaping the Breast Enhancement Products Industry?

  • The rising demand for aesthetic lifestyle spending represents a crucial market trend influencing consumer expenditure patterns.

  • The Breast Enhancement Products sector is undergoing a profound structural transition fueled by the integration of advanced biomaterials and personalized clinical software. Manufacturers are aggressively developing polyurethane-coated implants to minimize localized scarring, which has improved long-term aesthetic retention rates by 15% over standard devices.
  • This innovation is heavily supported by the clinical adoption of pre-operative sizing workflows, which successfully reduce volume mismatch errors by 21%. These technological shifts occur because modern consumers and oncological patients demand highly predictable, individualized anatomical outcomes. Consequently, facilities utilizing inframammary fold surgical approach techniques report a 12% improvement in outpatient discharge efficiency.
  • By investing in post-mastectomy tissue reconstruction research and refining customizable anatomical templates, medical device corporations ensure a resilient operational baseline that effectively addresses evolving biological safety benchmarks and modern cosmetic standards.

What challenges does the Breast Enhancement Products Industry face during its growth?

  • Strict regulatory frameworks and product safety mandates present a significant challenge constraining immediate market acceleration.

  • Structural limitations within the Breast Enhancement Products sector are heavily exacerbated by intensifying legal liabilities and complex medical monitoring requirements. Regulatory agencies mandate exhaustive clinical trials to rule out complications, which has increased product commercialization delays by 24% relative to standard cosmetic devices.
  • This stringent oversight stems from historical anxieties surrounding capsular contracture reduction and the necessity for rigorous anaplastic large cell lymphoma screening. Consequently, clinics utilizing traditional sterile saline inflation systems face a 17% rise in localized insurance and compliance overhead. Manufacturers must constantly re-engineer their bio-engineered structural support frameworks and refine advanced autologous harvesting protocols to bypass synthetic material risks.
  • These intense regulatory and clinical pressures continuously strain corporate profit margins and complicate long-term operational scaling.

Exclusive Technavio Analysis on Customer Landscape

The breast enhancement products market forecasting report includes the adoption lifecycle of the market, covering from the innovator’s stage to the laggard’s stage. It focuses on adoption rates in different regions based on penetration. Furthermore, the breast enhancement products market report also includes key purchase criteria and drivers of price sensitivity to help companies evaluate and develop their market growth analysis strategies.
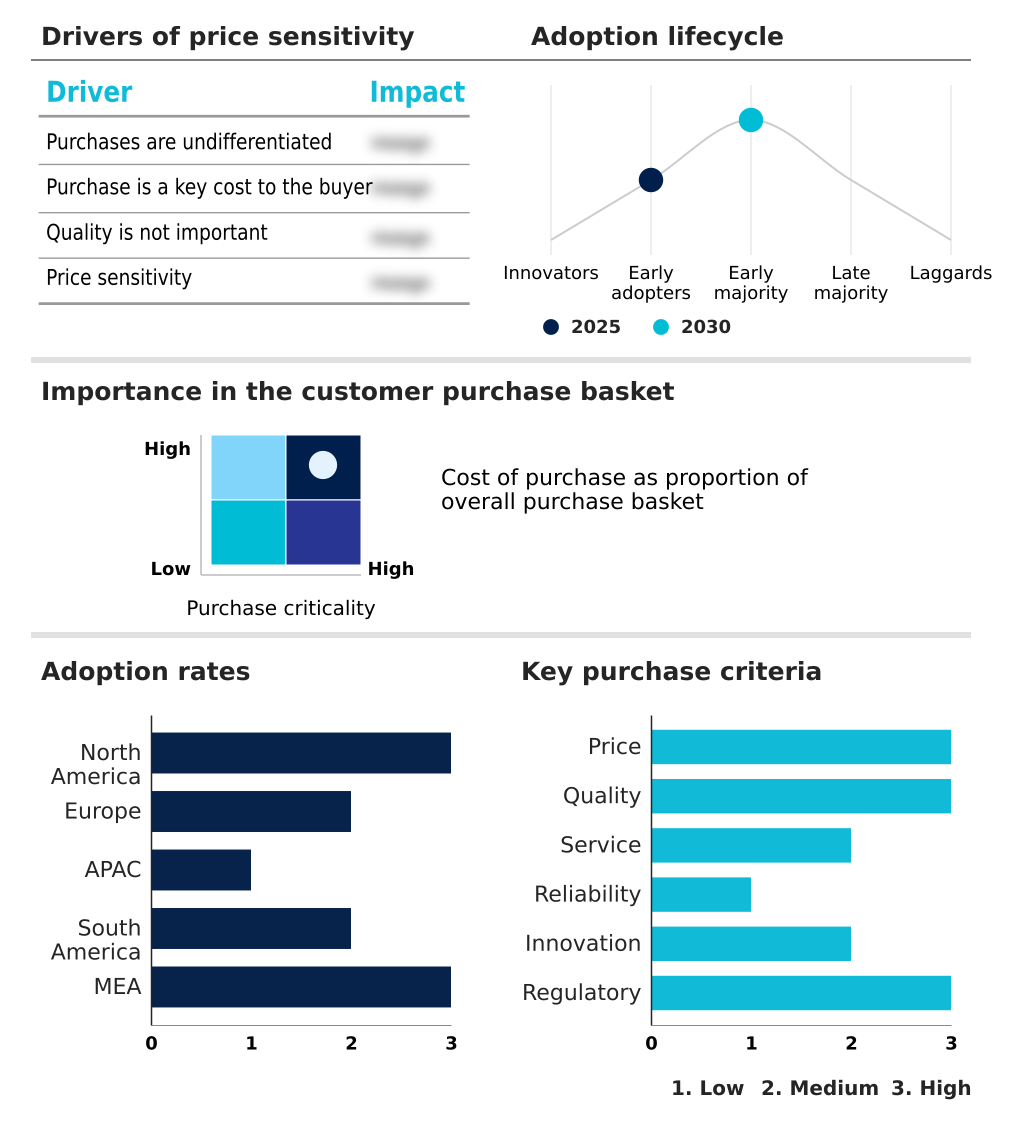
Customer Landscape of Breast Enhancement Products Industry

Competitive Landscape

Companies are implementing various strategies, such as strategic alliances, breast enhancement products market forecast, partnerships, mergers and acquisitions, geographical expansion, and product/service launches, to enhance their presence in the industry.

Allergan Aesthetics - Allergan Aesthetics delivers advanced cohesive silicone implants and structured tissue expanders, providing clinical solutions optimized for predictable anatomical outcomes and sustained biostability in cosmetic and reconstructive procedures.

The industry research and growth report includes detailed analyses of the competitive landscape of the market and information about key companies, including:

  • Allergan Aesthetics
  • Amoena
  • AnaOno International LLC
  • Bimini Health Tech
  • Bust Bunny
  • Canfem Medical Corp.
  • Cerecare
  • Euromi S.A.
  • GC Aesthetics Ltd.
  • Hans Biomed Co. Ltd.
  • INLIFE Pharma Pvt. Ltd.
  • Leading Edge Health Inc.
  • Mentor Worldwide LLC
  • Motiva
  • Nearly Me Technologies LLC
  • Otvena Healthcare
  • POLYTECH GmbH
  • Silimed Indústria de Implantes
  • Spatz FGIA Inc.
  • Trulife

Qualitative and quantitative analysis of companies has been conducted to help clients understand the wider business environment as well as the strengths and weaknesses of key industry players. Data is qualitatively analyzed to categorize companies as pure play, category-focused, industry-focused, and diversified; it is quantitatively analyzed to categorize companies as dominant, leading, strong, tentative, and weak.

Recent Development and News in Breast enhancement products market

  • In the Personal Care Products industry, the shift toward sustainable transdermal cosmetic formulations has accelerated the integration of bio-active botanical extracts, directly impacting Breast Enhancement Products demand by expanding the market for non-surgical topical elasticity.
  • Stringent international regulatory compliance mandates regarding synthetic cosmetic ingredients have forced manufacturers to adopt advanced biomaterial engineering protocols, directly impacting Breast Enhancement Products demand by elevating clinical safety benchmarking for all transdermal applications.
  • The widespread adoption of customized direct-to-consumer digital commerce platforms in the broader aesthetic sector has streamlined product traceability registry processes, directly impacting Breast Enhancement Products demand by enhancing supply chain integrity verification for premium surgical devices.
  • Advancements in high-definition diagnostic imaging across general dermatology have catalyzed the deployment of digital consultation ecosystems, directly impacting Breast Enhancement Products demand by improving pre-operative sizing workflows and optimizing aesthetic symmetry correction.

Dive into Technavio’s robust research methodology, blending expert interviews, extensive data synthesis, and validated models for unparalleled Breast Enhancement Products Market insights. See full methodology.

Market Scope
Page number 300
Base year 2025
Historic period 2020-2024
Forecast period 2026-2030
Growth momentum & CAGR Accelerate at a CAGR of 5.8%
Market growth 2026-2030 USD 895.1 million
Market structure Fragmented
YoY growth 2025-2026(%) 5.7%
Key countries US, Canada, Mexico, Germany, UK, France, Italy, Spain, Russia, China, Japan, India, South Korea, Australia, Indonesia, Brazil, Argentina, Colombia, Saudi Arabia, UAE, South Africa, Turkey and Israel
Competitive landscape Leading Companies, Market Positioning of Companies, Competitive Strategies, and Industry Risks

Request Free Sample

Research Analyst Overview

  • Strategic decision-making within the Breast Enhancement Products landscape is increasingly dictated by the necessity to balance complex clinical engineering with rapid digital integration. Companies prioritizing the development of high-cohesion form-stable gels have observed a 28% decrease in device failure liabilities compared to legacy saline alternatives.
  • This shift significantly influences corporate budgeting, driving massive capital reallocation toward advanced manufacturing infrastructure capable of producing an elastomer outer shell that resists mechanical stress. Furthermore, boardroom strategies are heavily focused on leveraging three-dimensional diagnostic visualization to optimize patient onboarding. Executives mandate the use of biocompatible tissue expanders and customized cellular regeneration scaffolding to capture the expanding post-mastectomy reconstruction demographic.
  • By strictly adhering to subfascial insertion methods, clinics drastically enhance cosmetic symmetry while reducing surgical trauma. These precise technological integrations empower stakeholders to align product pricing with premium clinical safety standards. The continuous incorporation of magnetic resonance imaging conditional technology further ensures that long-term radiological screening remains unhindered, solidifying vendor market positioning.

What are the Key Data Covered in this Breast Enhancement Products Market Research and Growth Report?

  • What is the expected growth of the Breast Enhancement Products Market between 2026 and 2030?

    • USD 895.1 million, at a CAGR of 5.8%

  • What segmentation does the market report cover?

    • The report is segmented by Distribution Channel (Online stores, and Retail stores), Product Type (Saline breast implants, and Silicone breast implants), Application (Reconstructive surgery, and Cosmetic surgery), End-user (Cosmetology clinics, Hospitals, and Ambulatory surgical centers) and Geography (North America, Europe, APAC, South America, Middle East and Africa)

  • Which regions are analyzed in the report?

    • North America, Europe, APAC, South America and Middle East and Africa

  • What are the key growth drivers and market challenges?

    • Advanced implant material innovations, Strict regulatory frameworks and product safety mandates

  • Who are the major players in the Breast Enhancement Products Market?

    • Allergan Aesthetics, Amoena, AnaOno International LLC, Bimini Health Tech, Bust Bunny, Canfem Medical Corp., Cerecare, Euromi S.A., GC Aesthetics Ltd., Hans Biomed Co. Ltd., INLIFE Pharma Pvt. Ltd., Leading Edge Health Inc., Mentor Worldwide LLC, Motiva, Nearly Me Technologies LLC, Otvena Healthcare, POLYTECH GmbH, Silimed Indústria de Implantes, Spatz FGIA Inc. and Trulife

Market Research Insights

  • The Breast Enhancement Products Market requires exceptional precision to balance structural safety with rigorous regulatory compliance mandates. Modern clinics integrating digital consultation ecosystems have reported a 20% reduction in pre-operative consultation time, directly accelerating patient throughput and boosting clinical revenue. Furthermore, advancements in surgical volume augmentation techniques have decreased post-operative recovery periods by 25%, drastically improving facility utilization rates.
  • By enforcing strict long-term biostability validation protocols, manufacturers are effectively reducing the incidence of secondary revision surgeries. This continuous optimization directly mitigates overhead expenses and secures higher profit margins across regional ambulatory recovery centers.

We can help! Our analysts can customize this breast enhancement products market research report to meet your requirements.

Get in touch

1. Executive Summary

1.1 Market overview

Executive Summary - Chart on Market Overview
Executive Summary - Data Table on Market Overview
Executive Summary - Chart on Global Market Characteristics
Executive Summary - Chart on Market by Geography
Executive Summary - Chart on Market Segmentation by Distribution Channel
Executive Summary - Chart on Market Segmentation by Product Type
Executive Summary - Chart on Market Segmentation by Application
Executive Summary - Chart on Market Segmentation by End-user
Executive Summary - Chart on Incremental Growth
Executive Summary - Data Table on Incremental Growth
Executive Summary - Chart on Company Market Positioning

2. Technavio Analysis

2.1 Analysis of price sensitivity, lifecycle, customer purchase basket, adoption rates, and purchase criteria

2.2 Criticality of inputs and Factors of differentiation

Chart on Overview on criticality of inputs and factors of differentiation

2.3 Factors of disruption

Chart on Overview on factors of disruption

2.4 Impact of drivers and challenges

Chart on Impact of drivers and challenges in 2025 and 2030

3. Market Landscape

3.1 Market ecosystem

Chart on Parent Market
Data Table on - Parent Market

3.2 Market characteristics

Chart on Market characteristics analysis

3.3 Value chain analysis

Chart on Value chain analysis

4. Market Sizing

4.1 Market definition

Data Table on Offerings of companies included in the market definition

4.2 Market segment analysis

Market segments

4.3 Market size 2025

4.4 Market outlook: Forecast for 2025-2030

Chart on Global - Market size and forecast 2025-2030 ($ million)
Data Table on Global - Market size and forecast 2025-2030 ($ million)
Chart on Global Market: Year-over-year growth 2025-2030 (%)
Data Table on Global Market: Year-over-year growth 2025-2030 (%)

5. Historic Market Size

5.1 Global Breast Enhancement Products Market 2020 - 2024

Historic Market Size - Data Table on Global Breast Enhancement Products Market 2020 - 2024 ($ million)

5.2 Distribution Channel segment analysis 2020 - 2024

Historic Market Size - Distribution Channel Segment 2020 - 2024 ($ million)

5.3 Product Type segment analysis 2020 - 2024

Historic Market Size - Product Type Segment 2020 - 2024 ($ million)

5.4 Application segment analysis 2020 - 2024

Historic Market Size - Application Segment 2020 - 2024 ($ million)

5.5 End-user segment analysis 2020 - 2024

Historic Market Size - End-user Segment 2020 - 2024 ($ million)

5.6 Geography segment analysis 2020 - 2024

Historic Market Size - Geography Segment 2020 - 2024 ($ million)

5.7 Country segment analysis 2020 - 2024

Historic Market Size - Country Segment 2020 - 2024 ($ million)

6. Qualitative Analysis

6.1 Impact of AI on Global Breast Enhancement Products Market

6.2 Impact of geopolitical conflicts on Global Breast Enhancement Products Market

7. Five Forces Analysis

7.1 Five forces summary

Five forces analysis - Comparison between 2025 and 2030

7.2 Bargaining power of buyers

Bargaining power of buyers - Impact of key factors 2025 and 2030

7.3 Bargaining power of suppliers

Bargaining power of suppliers - Impact of key factors in 2025 and 2030

7.4 Threat of new entrants

Threat of new entrants - Impact of key factors in 2025 and 2030

7.5 Threat of substitutes

Threat of substitutes - Impact of key factors in 2025 and 2030

7.6 Threat of rivalry

Threat of rivalry - Impact of key factors in 2025 and 2030

7.7 Market condition

Chart on Market condition - Five forces 2025 and 2030

8. Market Segmentation by Distribution Channel

8.1 Market segments

Chart on Distribution Channel - Market share 2025-2030 (%)
Data Table on Distribution Channel - Market share 2025-2030 (%)

8.2 Comparison by Distribution Channel

Chart on Comparison by Distribution Channel
Data Table on Comparison by Distribution Channel

8.3 Online stores - Market size and forecast 2025-2030

Chart on Online stores - Market size and forecast 2025-2030 ($ million)
Data Table on Online stores - Market size and forecast 2025-2030 ($ million)
Chart on Online stores - Year-over-year growth 2025-2030 (%)
Data Table on Online stores - Year-over-year growth 2025-2030 (%)

8.4 Retail stores - Market size and forecast 2025-2030

Chart on Retail stores - Market size and forecast 2025-2030 ($ million)
Data Table on Retail stores - Market size and forecast 2025-2030 ($ million)
Chart on Retail stores - Year-over-year growth 2025-2030 (%)
Data Table on Retail stores - Year-over-year growth 2025-2030 (%)

8.5 Market opportunity by Distribution Channel

Market opportunity by Distribution Channel ($ million)
Data Table on Market opportunity by Distribution Channel ($ million)

9. Market Segmentation by Product Type

9.1 Market segments

Chart on Product Type - Market share 2025-2030 (%)
Data Table on Product Type - Market share 2025-2030 (%)

9.2 Comparison by Product Type

Chart on Comparison by Product Type
Data Table on Comparison by Product Type

9.3 Saline breast implants - Market size and forecast 2025-2030

Chart on Saline breast implants - Market size and forecast 2025-2030 ($ million)
Data Table on Saline breast implants - Market size and forecast 2025-2030 ($ million)
Chart on Saline breast implants - Year-over-year growth 2025-2030 (%)
Data Table on Saline breast implants - Year-over-year growth 2025-2030 (%)

9.4 Silicone breast implants - Market size and forecast 2025-2030

Chart on Silicone breast implants - Market size and forecast 2025-2030 ($ million)
Data Table on Silicone breast implants - Market size and forecast 2025-2030 ($ million)
Chart on Silicone breast implants - Year-over-year growth 2025-2030 (%)
Data Table on Silicone breast implants - Year-over-year growth 2025-2030 (%)

9.5 Market opportunity by Product Type

Market opportunity by Product Type ($ million)
Data Table on Market opportunity by Product Type ($ million)

10. Market Segmentation by Application

10.1 Market segments

Chart on Application - Market share 2025-2030 (%)
Data Table on Application - Market share 2025-2030 (%)

10.2 Comparison by Application

Chart on Comparison by Application
Data Table on Comparison by Application

10.3 Reconstructive surgery - Market size and forecast 2025-2030

Chart on Reconstructive surgery - Market size and forecast 2025-2030 ($ million)
Data Table on Reconstructive surgery - Market size and forecast 2025-2030 ($ million)
Chart on Reconstructive surgery - Year-over-year growth 2025-2030 (%)
Data Table on Reconstructive surgery - Year-over-year growth 2025-2030 (%)

10.4 Cosmetic surgery - Market size and forecast 2025-2030

Chart on Cosmetic surgery - Market size and forecast 2025-2030 ($ million)
Data Table on Cosmetic surgery - Market size and forecast 2025-2030 ($ million)
Chart on Cosmetic surgery - Year-over-year growth 2025-2030 (%)
Data Table on Cosmetic surgery - Year-over-year growth 2025-2030 (%)

10.5 Market opportunity by Application

Market opportunity by Application ($ million)
Data Table on Market opportunity by Application ($ million)

11. Market Segmentation by End-user

11.1 Market segments

Chart on End-user - Market share 2025-2030 (%)
Data Table on End-user - Market share 2025-2030 (%)

11.2 Comparison by End-user

Chart on Comparison by End-user
Data Table on Comparison by End-user

11.3 Cosmetology clinics - Market size and forecast 2025-2030

Chart on Cosmetology clinics - Market size and forecast 2025-2030 ($ million)
Data Table on Cosmetology clinics - Market size and forecast 2025-2030 ($ million)
Chart on Cosmetology clinics - Year-over-year growth 2025-2030 (%)
Data Table on Cosmetology clinics - Year-over-year growth 2025-2030 (%)

11.4 Hospitals - Market size and forecast 2025-2030

Chart on Hospitals - Market size and forecast 2025-2030 ($ million)
Data Table on Hospitals - Market size and forecast 2025-2030 ($ million)
Chart on Hospitals - Year-over-year growth 2025-2030 (%)
Data Table on Hospitals - Year-over-year growth 2025-2030 (%)

11.5 Ambulatory surgical centers - Market size and forecast 2025-2030

Chart on Ambulatory surgical centers - Market size and forecast 2025-2030 ($ million)
Data Table on Ambulatory surgical centers - Market size and forecast 2025-2030 ($ million)
Chart on Ambulatory surgical centers - Year-over-year growth 2025-2030 (%)
Data Table on Ambulatory surgical centers - Year-over-year growth 2025-2030 (%)

11.6 Market opportunity by End-user

Market opportunity by End-user ($ million)
Data Table on Market opportunity by End-user ($ million)

12. Customer Landscape

12.1 Customer landscape overview

Analysis of price sensitivity, lifecycle, customer purchase basket, adoption rates, and purchase criteria

13. Geographic Landscape

13.1 Geographic segmentation

Chart on Market share by geography 2025-2030 (%)
Data Table on Market share by geography 2025-2030 (%)

13.2 Geographic comparison

Chart on Geographic comparison
Data Table on Geographic comparison

13.3 North America - Market size and forecast 2025-2030

Chart on North America - Market size and forecast 2025-2030 ($ million)
Data Table on North America - Market size and forecast 2025-2030 ($ million)
Chart on North America - Year-over-year growth 2025-2030 (%)
Data Table on North America - Year-over-year growth 2025-2030 (%)
Chart on Regional Comparison - North America
Data Table on Regional Comparison - North America

13.3.1 US - Market size and forecast 2025-2030

Chart on US - Market size and forecast 2025-2030 ($ million)
Data Table on US - Market size and forecast 2025-2030 ($ million)
Chart on US - Year-over-year growth 2025-2030 (%)
Data Table on US - Year-over-year growth 2025-2030 (%)

13.3.2 Canada - Market size and forecast 2025-2030

Chart on Canada - Market size and forecast 2025-2030 ($ million)
Data Table on Canada - Market size and forecast 2025-2030 ($ million)
Chart on Canada - Year-over-year growth 2025-2030 (%)
Data Table on Canada - Year-over-year growth 2025-2030 (%)

13.3.3 Mexico - Market size and forecast 2025-2030

Chart on Mexico - Market size and forecast 2025-2030 ($ million)
Data Table on Mexico - Market size and forecast 2025-2030 ($ million)
Chart on Mexico - Year-over-year growth 2025-2030 (%)
Data Table on Mexico - Year-over-year growth 2025-2030 (%)

13.4 Europe - Market size and forecast 2025-2030

Chart on Europe - Market size and forecast 2025-2030 ($ million)
Data Table on Europe - Market size and forecast 2025-2030 ($ million)
Chart on Europe - Year-over-year growth 2025-2030 (%)
Data Table on Europe - Year-over-year growth 2025-2030 (%)
Chart on Regional Comparison - Europe
Data Table on Regional Comparison - Europe

13.4.1 Germany - Market size and forecast 2025-2030

Chart on Germany - Market size and forecast 2025-2030 ($ million)
Data Table on Germany - Market size and forecast 2025-2030 ($ million)
Chart on Germany - Year-over-year growth 2025-2030 (%)
Data Table on Germany - Year-over-year growth 2025-2030 (%)

13.4.2 UK - Market size and forecast 2025-2030

Chart on UK - Market size and forecast 2025-2030 ($ million)
Data Table on UK - Market size and forecast 2025-2030 ($ million)
Chart on UK - Year-over-year growth 2025-2030 (%)
Data Table on UK - Year-over-year growth 2025-2030 (%)

13.4.3 France - Market size and forecast 2025-2030

Chart on France - Market size and forecast 2025-2030 ($ million)
Data Table on France - Market size and forecast 2025-2030 ($ million)
Chart on France - Year-over-year growth 2025-2030 (%)
Data Table on France - Year-over-year growth 2025-2030 (%)

13.4.4 Italy - Market size and forecast 2025-2030

Chart on Italy - Market size and forecast 2025-2030 ($ million)
Data Table on Italy - Market size and forecast 2025-2030 ($ million)
Chart on Italy - Year-over-year growth 2025-2030 (%)
Data Table on Italy - Year-over-year growth 2025-2030 (%)

13.4.5 Spain - Market size and forecast 2025-2030

Chart on Spain - Market size and forecast 2025-2030 ($ million)
Data Table on Spain - Market size and forecast 2025-2030 ($ million)
Chart on Spain - Year-over-year growth 2025-2030 (%)
Data Table on Spain - Year-over-year growth 2025-2030 (%)

13.4.6 Russia - Market size and forecast 2025-2030

Chart on Russia - Market size and forecast 2025-2030 ($ million)
Data Table on Russia - Market size and forecast 2025-2030 ($ million)
Chart on Russia - Year-over-year growth 2025-2030 (%)
Data Table on Russia - Year-over-year growth 2025-2030 (%)

13.5 APAC - Market size and forecast 2025-2030

Chart on APAC - Market size and forecast 2025-2030 ($ million)
Data Table on APAC - Market size and forecast 2025-2030 ($ million)
Chart on APAC - Year-over-year growth 2025-2030 (%)
Data Table on APAC - Year-over-year growth 2025-2030 (%)
Chart on Regional Comparison - APAC
Data Table on Regional Comparison - APAC

13.5.1 China - Market size and forecast 2025-2030

Chart on China - Market size and forecast 2025-2030 ($ million)
Data Table on China - Market size and forecast 2025-2030 ($ million)
Chart on China - Year-over-year growth 2025-2030 (%)
Data Table on China - Year-over-year growth 2025-2030 (%)

13.5.2 Japan - Market size and forecast 2025-2030

Chart on Japan - Market size and forecast 2025-2030 ($ million)
Data Table on Japan - Market size and forecast 2025-2030 ($ million)
Chart on Japan - Year-over-year growth 2025-2030 (%)
Data Table on Japan - Year-over-year growth 2025-2030 (%)

13.5.3 India - Market size and forecast 2025-2030

Chart on India - Market size and forecast 2025-2030 ($ million)
Data Table on India - Market size and forecast 2025-2030 ($ million)
Chart on India - Year-over-year growth 2025-2030 (%)
Data Table on India - Year-over-year growth 2025-2030 (%)

13.5.4 South Korea - Market size and forecast 2025-2030

Chart on South Korea - Market size and forecast 2025-2030 ($ million)
Data Table on South Korea - Market size and forecast 2025-2030 ($ million)
Chart on South Korea - Year-over-year growth 2025-2030 (%)
Data Table on South Korea - Year-over-year growth 2025-2030 (%)

13.5.5 Australia - Market size and forecast 2025-2030

Chart on Australia - Market size and forecast 2025-2030 ($ million)
Data Table on Australia - Market size and forecast 2025-2030 ($ million)
Chart on Australia - Year-over-year growth 2025-2030 (%)
Data Table on Australia - Year-over-year growth 2025-2030 (%)

13.5.6 Indonesia - Market size and forecast 2025-2030

Chart on Indonesia - Market size and forecast 2025-2030 ($ million)
Data Table on Indonesia - Market size and forecast 2025-2030 ($ million)
Chart on Indonesia - Year-over-year growth 2025-2030 (%)
Data Table on Indonesia - Year-over-year growth 2025-2030 (%)

13.6 South America - Market size and forecast 2025-2030

Chart on South America - Market size and forecast 2025-2030 ($ million)
Data Table on South America - Market size and forecast 2025-2030 ($ million)
Chart on South America - Year-over-year growth 2025-2030 (%)
Data Table on South America - Year-over-year growth 2025-2030 (%)
Chart on Regional Comparison - South America
Data Table on Regional Comparison - South America

13.6.1 Brazil - Market size and forecast 2025-2030

Chart on Brazil - Market size and forecast 2025-2030 ($ million)
Data Table on Brazil - Market size and forecast 2025-2030 ($ million)
Chart on Brazil - Year-over-year growth 2025-2030 (%)
Data Table on Brazil - Year-over-year growth 2025-2030 (%)

13.6.2 Argentina - Market size and forecast 2025-2030

Chart on Argentina - Market size and forecast 2025-2030 ($ million)
Data Table on Argentina - Market size and forecast 2025-2030 ($ million)
Chart on Argentina - Year-over-year growth 2025-2030 (%)
Data Table on Argentina - Year-over-year growth 2025-2030 (%)

13.6.3 Colombia - Market size and forecast 2025-2030

Chart on Colombia - Market size and forecast 2025-2030 ($ million)
Data Table on Colombia - Market size and forecast 2025-2030 ($ million)
Chart on Colombia - Year-over-year growth 2025-2030 (%)
Data Table on Colombia - Year-over-year growth 2025-2030 (%)

13.7 Middle East and Africa - Market size and forecast 2025-2030

Chart on Middle East and Africa - Market size and forecast 2025-2030 ($ million)
Data Table on Middle East and Africa - Market size and forecast 2025-2030 ($ million)
Chart on Middle East and Africa - Year-over-year growth 2025-2030 (%)
Data Table on Middle East and Africa - Year-over-year growth 2025-2030 (%)
Chart on Regional Comparison - Middle East and Africa
Data Table on Regional Comparison - Middle East and Africa

13.7.1 Saudi Arabia - Market size and forecast 2025-2030

Chart on Saudi Arabia - Market size and forecast 2025-2030 ($ million)
Data Table on Saudi Arabia - Market size and forecast 2025-2030 ($ million)
Chart on Saudi Arabia - Year-over-year growth 2025-2030 (%)
Data Table on Saudi Arabia - Year-over-year growth 2025-2030 (%)

13.7.2 UAE - Market size and forecast 2025-2030

Chart on UAE - Market size and forecast 2025-2030 ($ million)
Data Table on UAE - Market size and forecast 2025-2030 ($ million)
Chart on UAE - Year-over-year growth 2025-2030 (%)
Data Table on UAE - Year-over-year growth 2025-2030 (%)

13.7.3 South Africa - Market size and forecast 2025-2030

Chart on South Africa - Market size and forecast 2025-2030 ($ million)
Data Table on South Africa - Market size and forecast 2025-2030 ($ million)
Chart on South Africa - Year-over-year growth 2025-2030 (%)
Data Table on South Africa - Year-over-year growth 2025-2030 (%)

13.7.4 Turkey - Market size and forecast 2025-2030

Chart on Turkey - Market size and forecast 2025-2030 ($ million)
Data Table on Turkey - Market size and forecast 2025-2030 ($ million)
Chart on Turkey - Year-over-year growth 2025-2030 (%)
Data Table on Turkey - Year-over-year growth 2025-2030 (%)

13.7.5 Israel - Market size and forecast 2025-2030

Chart on Israel - Market size and forecast 2025-2030 ($ million)
Data Table on Israel - Market size and forecast 2025-2030 ($ million)
Chart on Israel - Year-over-year growth 2025-2030 (%)
Data Table on Israel - Year-over-year growth 2025-2030 (%)

13.8 Market opportunity by geography

Market opportunity by geography ($ million)
Data Tables on Market opportunity by geography ($ million)

14. Drivers, Challenges, and Opportunity

14.1 Market drivers

Advanced implant material innovations
Growth in reconstructive breast surgeries
Digital aesthetic planning and consumer trends

14.2 Market challenges

Strict regulatory frameworks and product safety mandates
Consumer safety concerns and litigation pressure
High procedure costs and limited insurance coverage

14.3 Impact of drivers and challenges

Impact of drivers and challenges in 2025 and 2030

14.4 Market opportunities

Rising demand for aesthetic lifestyle spending
Expansion of reconstruction and survivorship care
Adoption of smart visualization platforms

15. Competitive Landscape

15.1 Overview

15.2

Overview on criticality of inputs and factors of differentiation

15.3 Landscape disruption

Overview on factors of disruption

15.4 Industry risks

Impact of key risks on business

16. Competitive Analysis

16.1 Companies profiled

Companies covered

16.2 Company ranking index

16.3 Market positioning of companies

Matrix on companies position and classification

16.4 Allergan Aesthetics

Allergan Aesthetics - Overview
Allergan Aesthetics - Product / Service
Allergan Aesthetics - Key offerings
SWOT

16.5 Amoena

Amoena - Overview
Amoena - Product / Service
Amoena - Key offerings
SWOT

16.6 AnaOno International LLC

AnaOno International LLC - Overview
AnaOno International LLC - Product / Service
AnaOno International LLC - Key offerings
SWOT

16.7 Bimini Health Tech

Bimini Health Tech - Overview
Bimini Health Tech - Product / Service
Bimini Health Tech - Key offerings
SWOT

16.8 Bust Bunny

Bust Bunny - Overview
Bust Bunny - Product / Service
Bust Bunny - Key offerings
SWOT

16.9 Canfem Medical Corp.

Canfem Medical Corp. - Overview
Canfem Medical Corp. - Product / Service
Canfem Medical Corp. - Key offerings
SWOT

16.10 Cerecare

Cerecare - Overview
Cerecare - Product / Service
Cerecare - Key offerings
SWOT

16.11 Euromi S.A.

Euromi S.A. - Overview
Euromi S.A. - Product / Service
Euromi S.A. - Key offerings
SWOT

16.12 GC Aesthetics Ltd.

GC Aesthetics Ltd. - Overview
GC Aesthetics Ltd. - Product / Service
GC Aesthetics Ltd. - Key offerings
SWOT

16.13 Hans Biomed Co. Ltd.

Hans Biomed Co. Ltd. - Overview
Hans Biomed Co. Ltd. - Product / Service
Hans Biomed Co. Ltd. - Key offerings
SWOT

16.14 INLIFE Pharma Pvt. Ltd.

INLIFE Pharma Pvt. Ltd. - Overview
INLIFE Pharma Pvt. Ltd. - Product / Service
INLIFE Pharma Pvt. Ltd. - Key offerings
SWOT

16.15 Leading Edge Health Inc.

Leading Edge Health Inc. - Overview
Leading Edge Health Inc. - Product / Service
Leading Edge Health Inc. - Key offerings
SWOT

16.16 Mentor Worldwide LLC

Mentor Worldwide LLC - Overview
Mentor Worldwide LLC - Product / Service
Mentor Worldwide LLC - Key offerings
SWOT

16.17 Motiva

Motiva - Overview
Motiva - Product / Service
Motiva - Key offerings
SWOT

16.18 POLYTECH GmbH

POLYTECH GmbH - Overview
POLYTECH GmbH - Product / Service
POLYTECH GmbH - Key offerings
SWOT

17. Appendix

17.1 Scope of the report

Market definition
Objectives
Notes and caveats

17.2 Inclusions and exclusions checklist

Inclusions checklist
Exclusions checklist

17.3 Currency conversion rates for US$

17.4 Research methodology

17.5 Data procurement

Information sources

17.6 Data validation

17.7 Validation techniques employed for market sizing

17.8 Data synthesis

17.9 360 degree market analysis

17.10 List of abbreviations

Research Methodology

Technavio presents a detailed picture of the market by way of study, synthesis, and summation of data from multiple sources. The analysts have presented the various facets of the market with a particular focus on identifying the key industry influencers. The data thus presented is comprehensive, reliable, and the result of extensive research, both primary and secondary.

INFORMATION SOURCES

Primary sources

  • Manufacturers and suppliers
  • Channel partners
  • Industry experts
  • Strategic decision makers

Secondary sources

  • Industry journals and periodicals
  • Government data
  • Financial reports of key industry players
  • Historical data
  • Press releases

DATA ANALYSIS

Data Synthesis

  • Collation of data
  • Estimation of key figures
  • Analysis of derived insights

Data Validation

  • Triangulation with data models
  • Reference against proprietary databases
  • Corroboration with industry experts

REPORT WRITING

Qualitative

  • Market drivers
  • Market challenges
  • Market trends
  • Five forces analysis

Quantitative

  • Market size and forecast
  • Market segmentation
  • Geographical insights
  • Competitive landscape

Interested in this report?

Get your sample now to see our research methodology and insights!

Download Now

Frequently Asked Questions

Breast Enhancement Products market growth will increase by USD 895.1 million during 2026-2030.

The Breast Enhancement Products market is expected to grow at a CAGR of 5.8% during 2026-2030.

Breast Enhancement Products market is segmented by Distribution channel (Online stores, Retail stores) Product type (Saline breast implants, Silicone breast implants) Application (Reconstructive surgery, Cosmetic surgery) End-user (Cosmetology clinics, Hospitals, Ambulatory surgical centers)

Allergan Aesthetics, Amoena, AnaOno International LLC, Bimini Health Tech, Bust Bunny, Canfem Medical Corp., Cerecare, Euromi S.A., GC Aesthetics Ltd., Hans Biomed Co. Ltd., INLIFE Pharma Pvt. Ltd., Leading Edge Health Inc., Mentor Worldwide LLC, Motiva, Nearly Me Technologies LLC, Otvena Healthcare, POLYTECH GmbH, Silimed Indústria de Implantes, Spatz FGIA Inc., Trulife are a few of the key vendors in the Breast Enhancement Products market.

North America will register the highest growth rate of 38.8% among the other regions. Therefore, the Breast Enhancement Products market in North America is expected to garner significant business opportunities for the vendors during the forecast period.

US, Canada, Mexico, Germany, UK, France, Italy, Spain, Russia, China, Japan, India, South Korea, Australia, Indonesia, Brazil, Argentina, Colombia, Saudi Arabia, UAE, South Africa, Turkey, Israel

  • Advanced implant material innovations is the driving factor this market.

The Breast Enhancement Products market vendors should focus on grabbing business opportunities from the Distribution channel segment as it accounted for the largest market share in the base year.
RIA - Research AI Assistant
Ask RIA
