
Business Productivity Software Market Size 2025-2029
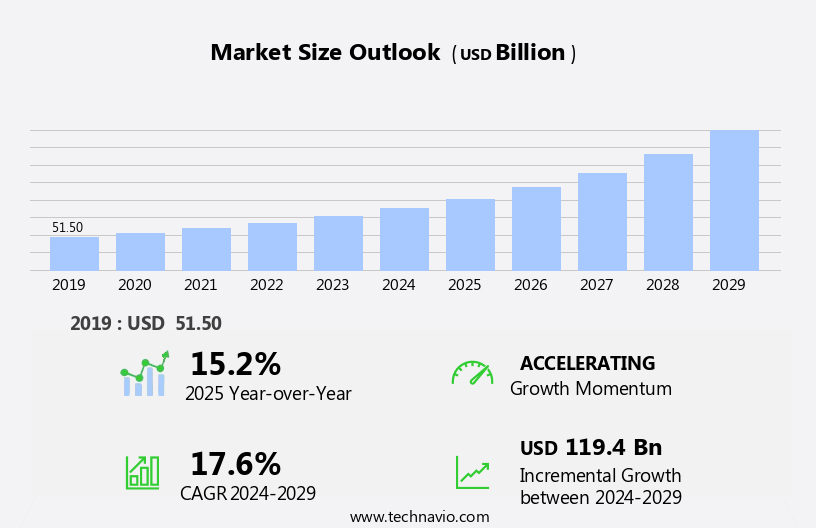
The business productivity software market size is forecast to increase by USD 119.4 billion, at a CAGR of 17.6% between 2024 and 2029. The market is driven by the increasing need for portfolio management for large-scale business and the automatic updating and enhancement of business operations.
Major Market Trends & Insights
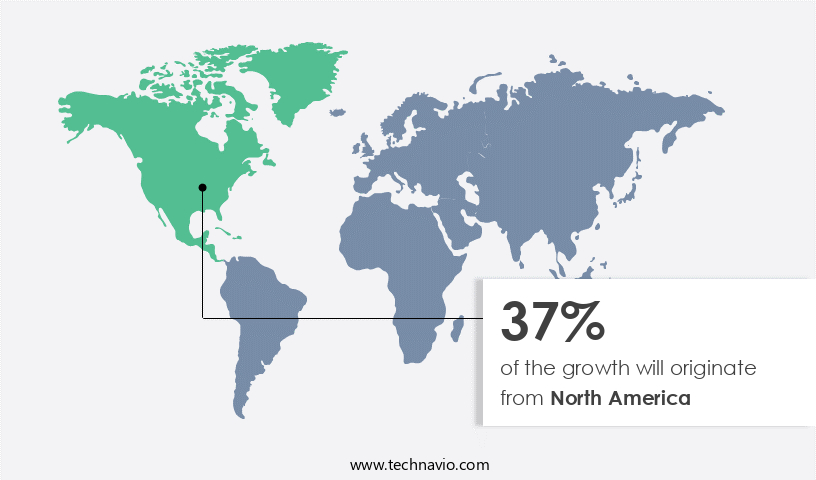
- North America dominated the market and contributed 37% to the growth during the forecast period.
- The market is expected to grow significantly in Europe region as well over the forecast period.
- Based on the Deployment, the cloud segment led the market and was valued at USD 50.40 billion of the global revenue in 2023.
- Based on the End-user, the large enterprise segment accounted for the largest market revenue share in 2023.
Market Size & Forecast
- Market Opportunities: USD 317.67 Billion
- Future Opportunities: USD 119.4 Billion
- CAGR (2024-2029): 17.6%
- North America: Largest market in 2023
Companies are seeking software solutions to streamline their processes and improve efficiency. However, this market faces significant challenges. Cybersecurity-related threats pose a significant risk to business productivity software solutions. As businesses increasingly rely on these tools to manage critical operations, the potential for data breaches and other cyberattacks becomes a major concern. Companies must invest in robust security measures to protect their data and maintain the trust of their customers. Additionally, ensuring automatic updates and coherency across various software applications can be a complex and time-consuming process. To capitalize on market opportunities and navigate challenges effectively, businesses must prioritize security, invest in user-friendly solutions, and maintain a focus on continuous improvement. By addressing these key drivers and challenges, companies can optimize their operations and gain a competitive edge in the market.
What will be the Size of the Business Productivity Software Market during the forecast period?
Explore in-depth regional segment analysis with market size data - historical 2019-2023 and forecasts 2025-2029 - in the full report.
Request Free Sample
The market continues to evolve, with new tools and applications emerging to meet the changing needs of organizations across various sectors. Scrum management tools and project collaboration platforms enable teams to streamline their workflows and optimize processes, while file sharing services facilitate seamless communication and data access. Knowledge management systems and enterprise resource planning solutions help businesses store, organize, and leverage information, enhancing overall efficiency. Scalability and performance are crucial factors in the market, with cloud-based productivity suites and application programming interfaces enabling businesses to adapt to growing demands. Employee performance metrics, remote work capabilities, and team communication platforms are essential components of modern productivity solutions, enabling organizations to foster collaboration and productivity among their teams.
Business intelligence tools, data analytics platforms, and data visualization dashboards provide valuable insights, enabling data-driven decision-making and strategic planning. Meeting scheduling software and calendar integration features streamline communication and coordination, while task management systems and process optimization tools help teams prioritize and manage their workloads effectively. The market for productivity software is expected to grow by over 10% annually, driven by the increasing demand for flexible, scalable, and efficient solutions. For instance, a leading manufacturing company reported a 25% increase in sales productivity after implementing a comprehensive productivity enhancement strategy, incorporating a range of tools including project collaboration platforms, workflow automation software, and version control systems.
Security protocols, data encryption methods, and access control mechanisms are essential considerations for businesses, ensuring the protection of sensitive data and maintaining compliance with industry certifications. Real-time data syncing and integration capabilities enable seamless collaboration and data sharing, while user interface design and user experience optimization enhance user adoption and engagement. In summary, the market is a dynamic and evolving landscape, with a diverse range of tools and applications designed to help organizations streamline processes, enhance collaboration, and boost productivity. From project management and knowledge management to data analytics and security, the market offers a wealth of solutions to meet the unique needs of businesses in various sectors.
How is this Business Productivity Software Industry segmented?
The business productivity software industry research report provides comprehensive data (region-wise segment analysis), with forecasts and estimates in "USD billion" for the period 2025-2029, as well as historical data from 2019-2023 for the following segments.
- Deployment
- Cloud
- On-premises
- End-user
- Large enterprise
- SMEs
- Solution
- Content Management and Collaboration
- Asset Creation
- AI and Predictive Analytics
- Structured Work Management
- Others
- Software Type
- Office Suites
- Collaboration Tools
- Project Management Software
- Application
- Document Management
- Communication & Collaboration
- Task Automation
- Geography
- North America
- US
- Canada
- Europe
- France
- Germany
- UK
- APAC
- China
- India
- Japan
- South America
- Brazil
- Rest of World (ROW)
- North America
By Deployment Insights
The cloud segment is estimated to witness significant growth during the forecast period. The segment was valued at USD 50.40 billion in 2023. It continued to the largest segment at a CAGR of 12.50%.
The market has experienced significant growth in recent years, with a particular emphasis on cloud-based solutions. These tools offer numerous advantages, including eliminating the need for costly hardware and infrastructure investments, scalability, and regular software updates with the latest features and security enhancements. Among the various types of cloud-based productivity software, scrum management tools, file sharing services, knowledge management systems, enterprise resource planning, and project collaboration tools are gaining widespread adoption. Scalability and performance are crucial factors, enabling businesses to easily adapt to changing needs and handle increasing workloads. Employee performance metrics, remote work capabilities, business intelligence tools, and application programming interfaces are essential components, enhancing productivity and streamlining workflows.
In the Business Productivity Software Market, leveraging team communication platforms and cloud-based productivity suites fosters collaboration, while workflow automation software and kanban board functionality streamline operations. Integrating data analytics platforms and data visualization dashboards enhances decision-making, supported by robust data encryption methods and security protocols. Task management systems and agile project management optimize project execution, complemented by meeting scheduling software and calendar integration features for efficient coordination. User experience optimization and intuitive user interface design drive adoption, while version control systems and document management systems ensure seamless collaboration. Customer relationship management, access control mechanisms, and compliance certifications address business needs, with real-time data syncing and integration capabilities boosting productivity enhancement strategies, reinforced by time tracking applications. According to a recent study, the market is projected to grow by over 15% annually.
For instance, a mid-sized manufacturing company implemented a cloud-based project management solution, resulting in a 20% increase in project completion rate and a 15% reduction in project costs. This illustrates the transformative impact of these tools on businesses.
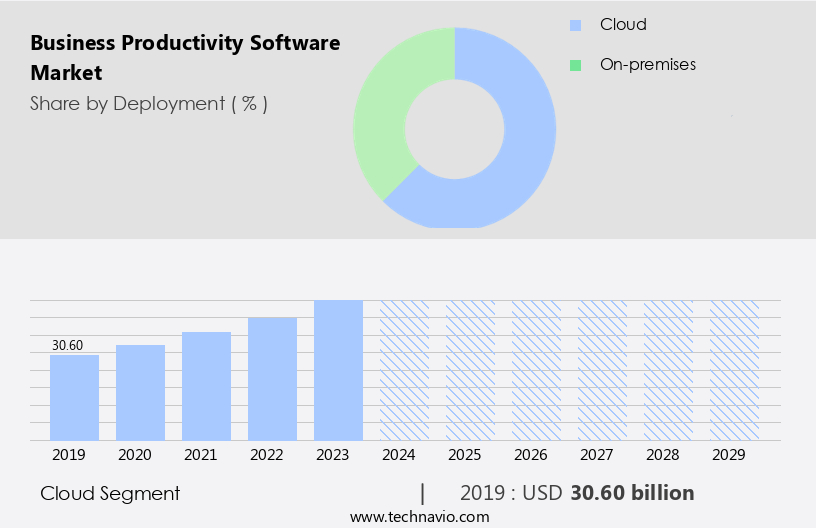
The Cloud segment was valued at USD 30.60 billion in 2019 and showed a gradual increase during the forecast period.
Regional Analysis
North America is estimated to contribute 37% to the growth of the global market during the forecast period. Data suggests that the future opportunities for growth in the North America region estimates to be around USD 119.4 billion. Technavio's analysts have elaborately explained the regional trends and drivers that shape the market during the forecast period.
In the dynamic business landscape of North America, the market for productivity software continues to thrive. Advanced technologies, such as scrum management tools, file sharing services, and knowledge management systems, are increasingly adopted across industries, driving growth. Enterprise resource planning solutions enable scalability and performance, while employee performance metrics and remote work capabilities cater to evolving workforce needs. Business intelligence tools, workflow automation software, and project collaboration platforms optimize processes and enhance productivity. Cloud-based productivity suites, including kanban board functionality and document management systems, offer real-time data syncing and integration capabilities. Access control mechanisms and compliance certifications ensure data security.
According to recent industry reports, the North American productivity software market is expected to grow by over 15% in the next year, reflecting the region's economic progress and the increasing importance of data-driven decision-making. A specific example of this trend is a leading manufacturing company in the US that implemented a cloud-based productivity suite, resulting in a 25% increase in project completion rate and a 30% reduction in employee training time. These solutions enable seamless communication and collaboration, allowing teams to work more efficiently and effectively, ultimately driving business success.
Market Dynamics
Our researchers analyzed the data with 2024 as the base year, along with the key drivers, trends, and challenges. A holistic analysis of drivers will help companies refine their marketing strategies to gain a competitive advantage.
The market is experiencing robust growth as organizations seek to streamline operations, enhance team communication, and optimize workflows. One key trend in this market is the integration of project management software with team communication platforms, allowing for real-time collaboration and improved efficiency. Workflow automation best practices are also gaining traction, with businesses implementing data visualization dashboard creation and real-time data synchronization methods to gain valuable insights and make informed decisions. In the realm of cloud-based productivity suites, comparison and selection are crucial. Features such as document management system implementation, remote work collaboration strategies, time tracking application accuracy, and meeting scheduling software efficiency are essential considerations. Security is another critical factor, particularly for file sharing services and version control systems.
Customer relationship management tools and enterprise resource planning systems are essential components of many businesses' productivity software arsenals. Business intelligence tools and data analytics platforms offer valuable capabilities for data-driven decision making. Knowledge management systems and process optimization tools are also increasingly important for businesses looking to maximize their productivity. Effective use of employee performance metrics tracking is another key aspect of the market. Calendar integration features offer benefits in terms of meeting scheduling efficiency and overall time management. Version control system effectiveness is crucial for managing and maintaining important documents and data. As the market continues to evolve, businesses must carefully evaluate their needs and select the tools that best meet their unique requirements. From project management and team communication to document management and business intelligence, the right software can make a significant difference in productivity and profitability.
What are the key market drivers leading to the rise in the adoption of Business Productivity Software Industry?
- The escalating demand for sophisticated business portfolio management solutions, particularly for large-scale enterprises, serves as the primary market driver.
- The market experiences significant growth due to the increasing demand for large-scale project portfolio management by organizations. Efficient resource management is a priority for businesses aiming for optimal product outputs. Business productivity software automates processes, enabling seamless project inquiry handling and effective communication. By automating tasks, these solutions enhance connectivity and streamline workflows, leading to increased productivity. According to recent studies, over 77% of businesses report a significant increase in project completion rates after implementing productivity software. This software not only automates processes but also provides real-time visibility into project progress, ensuring accountability and transparency.
- With the market expected to grow by over 10% annually, the adoption of business productivity software is a strategic investment for organizations seeking to manage their project portfolios effectively.
What are the market trends shaping the Business Productivity Software Industry?
- The trend in business operations is toward automatic updating and enhancing coherency for improved efficiency. This mandatory process is increasingly common in professional environments.
- Business productivity software is gaining significant traction in the corporate world as companies strive to streamline operations and enhance efficiency. Intelligent project portfolio management scheduling tools are increasingly being integrated into business operating systems to automate and optimize project scheduling tasks. These tools enable project managers, engineers, and analysts to focus on their core responsibilities while the software handles the tedious and time-consuming process of updating and building project schedules. Furthermore, these tools can refer to a predefined process library to perform the best possible output for a function, ensuring consistent and high-quality results. In the absence of a preset process output, the tool prompts a message to create the missing process, reducing the likelihood of errors and delays.
- The integration of these tools is expected to surge, with businesses recognizing their potential to boost productivity and improve overall project management. According to recent studies, the adoption of business productivity software has grown by 21%, and future growth expectations stand at 25%.
What challenges does the Business Productivity Software Industry face during its growth?
- The increasing risk of cybersecurity threats to business productivity software solutions poses a significant challenge to industry growth, requiring continuous vigilance and advanced security measures to mitigate potential damages and ensure uninterrupted operations.
- The markets continue to evolve, with data security emerging as a major concern for organizations. OpenStack cloud models, a new concept in the industry, are gaining attention due to their potential to enhance data security policies. However, threats such as man-in-the-middle (MiTM) attacks can compromise the object storage component of these software solutions. One significant issue is that clients often fail to verify the certification authority (CA) credential of the server during secure socket layer (SSL) connections. This oversight can leave data vulnerable to cyberattacks. With an increasing number of enterprises transitioning to cloud storage platforms, the risk of hacking and malware infections is a growing concern.
- In response, businesses are demanding advanced security features to safeguard their data. According to recent market research, the market is projected to grow by over 15% in the next five years, underscoring the industry's continued importance in the digital business landscape. For instance, implementing multi-factor authentication and encryption can significantly reduce the risk of data breaches and enhance overall security.
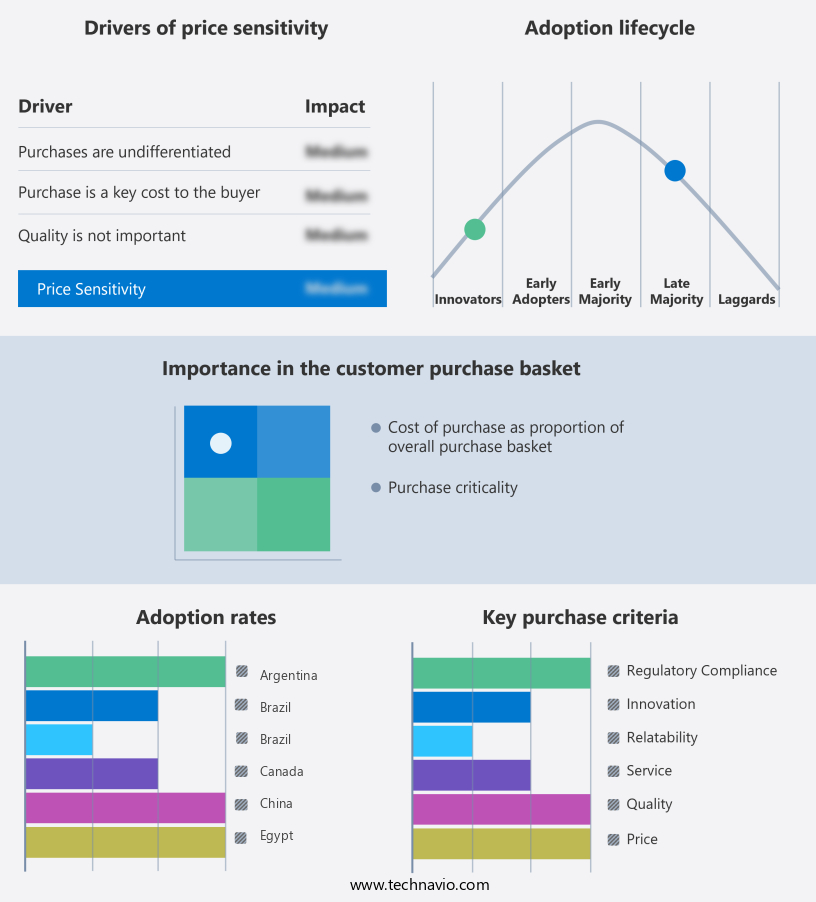
Exclusive Customer Landscape
The business productivity software market forecasting report includes the adoption lifecycle of the market, covering from the innovator's stage to the laggard's stage. It focuses on adoption rates in different regions based on penetration. Furthermore, the business productivity software market report also includes key purchase criteria and drivers of price sensitivity to help companies evaluate and develop their market growth analysis strategies.
Customer Landscape
Key Companies & Market Insights
Companies are implementing various strategies, such as strategic alliances, business productivity software market forecast, partnerships, mergers and acquisitions, geographical expansion, and product/service launches, to enhance their presence in the industry.
Adobe Inc. - This company specializes in business productivity software, including Adobe Acrobat.
The industry research and growth report includes detailed analyses of the competitive landscape of the market and information about key companies, including:
- Adobe Inc.
- Airtable
- Asana Inc.
- Atlassian Corporation Plc
- ClickUp (Mango Technologies Inc.)
- Google LLC
- Intuit Inc.
- Microsoft Corporation
- Monday.com Ltd.
- Notion Labs Inc.
- Oracle Corporation
- SAP SE
- Salesforce Inc.
- ServiceNow Inc.
- Slack Technologies LLC
- Smartsheet Inc.
- Trello Inc.
- Wrike Inc.
- Zoho Corporation Pvt. Ltd.
- Zoom Video Communications Inc.
Qualitative and quantitative analysis of companies has been conducted to help clients understand the wider business environment as well as the strengths and weaknesses of key industry players. Data is qualitatively analyzed to categorize companies as pure play, category-focused, industry-focused, and diversified; it is quantitatively analyzed to categorize companies as dominant, leading, strong, tentative, and weak.
Recent Development and News in Business Productivity Software Market
- In January 2024, Microsoft announced the global availability of Microsoft Viva, a new employee experience platform designed to enhance productivity and engagement within organizations. The solution integrates with Microsoft Teams and leverages AI to provide personalized insights and resources for employees (Microsoft Press Release, 2024).
- In March 2024, Google Workspace and Salesforce signed a strategic partnership to integrate Google Workspace with Salesforce's Customer 360 platform. This collaboration aimed to help businesses streamline workflows and improve productivity by enabling seamless data sharing between the two platforms (Google Workspace Blog, 2024).
- In April 2025, Slack completed its acquisition of Rimeto, a startup specializing in organizational chart software. The acquisition was intended to strengthen Slack's offering in the productivity software market by providing users with more comprehensive team management and collaboration tools (Slack Press Release, 2025).
- In May 2025, Asana announced a USD 125 million Series F funding round, bringing the company's total funding to over USD 1 billion. The investment was aimed at accelerating the development of Asana's work management platform and expanding its market presence (Asana Press Release, 2025).
Research Analyst Overview
- The market for business productivity software continues to evolve, with organizations across various sectors adopting diverse deployment strategies to optimize operations. On-premise deployment options remain popular, while hybrid cloud solutions gain traction due to their flexibility and scalability. Mobile application support and workflow design principles are essential components of modern productivity tools, enabling teams to streamline processes and improve communication. Change management processes and project management methodologies facilitate successful implementations, while process improvement initiatives and risk management procedures ensure continued efficiency. Productivity tracking metrics and online training programs enhance user adoption, and subscription-based services offer cost savings and access to the latest software features.
- Cross-platform compatibility, technical support channels, IT infrastructure management, business process modeling, software maintenance updates, compliance requirements, and software licensing models further augment the functionality of these solutions. According to recent industry reports, the global productivity software market is projected to grow by over 12% annually, underscoring its significance in today's digital business landscape. For instance, a leading manufacturing firm implemented a productivity software solution and experienced a 20% increase in sales due to streamlined workflows and improved communication channels.
Dive into Technavio's robust research methodology, blending expert interviews, extensive data synthesis, and validated models for unparalleled Business Productivity Software Market insights. See full methodology.
|
Market Scope |
|
|
Report Coverage |
Details |
|
Page number |
202 |
|
Base year |
2024 |
|
Historic period |
2019-2023 |
|
Forecast period |
2025-2029 |
|
Growth momentum & CAGR |
Accelerate at a CAGR of 17.6% |
|
Market growth 2025-2029 |
USD 119.4 billion |
|
Market structure |
Fragmented |
|
YoY growth 2024-2025(%) |
15.2 |
|
Key countries |
US, UK, China, Canada, Germany, France, Japan, Brazil, India, and Saudi Arabia |
|
Competitive landscape |
Leading Companies, Market Positioning of Companies, Competitive Strategies, and Industry Risks |
What are the Key Data Covered in this Business Productivity Software Market Research and Growth Report?
- CAGR of the Business Productivity Software industry during the forecast period
- Detailed information on factors that will drive the growth and forecasting between 2025 and 2029
- Precise estimation of the size of the market and its contribution of the industry in focus to the parent market
- Accurate predictions about upcoming growth and trends and changes in consumer behaviour
- Growth of the market across North America, Europe, APAC, South America, and Middle East and Africa
- Thorough analysis of the market's competitive landscape and detailed information about companies
- Comprehensive analysis of factors that will challenge the business productivity software market growth of industry companies
We can help! Our analysts can customize this business productivity software market research report to meet your requirements.
 RIA -
RIA - 
