
Online Travel Booking Platform Market Analysis, Size, and Forecast 2026-2030: APAC (China, Japan, and India), North America (US, Canada, and Mexico), Europe (UK, Germany, and France), South America (Brazil, Argentina, and Colombia), Middle East and Africa (UAE, Saudi Arabia, and South Africa), and Rest of World (ROW)

Online Travel Booking Platform Market Analysis, Size, and Forecast 2026-2030:
APAC (China, Japan, and India), North America (US, Canada, and Mexico), Europe (UK, Germany, and France), South America (Brazil, Argentina, and Colombia), Middle East and Africa (UAE, Saudi Arabia, and South Africa), and Rest of World (ROW)

Published: Oct 2026 309 Pages SKU: IRTNTR44504

Market Overview at a Glance

$53.48 B
Market Opportunity
10.4%
CAGR 2025 - 2030
49.9%
APAC Growth
$50.22 B
Mobile or tablet segment 2024

Online Travel Booking Platform Market Size 2026-2030

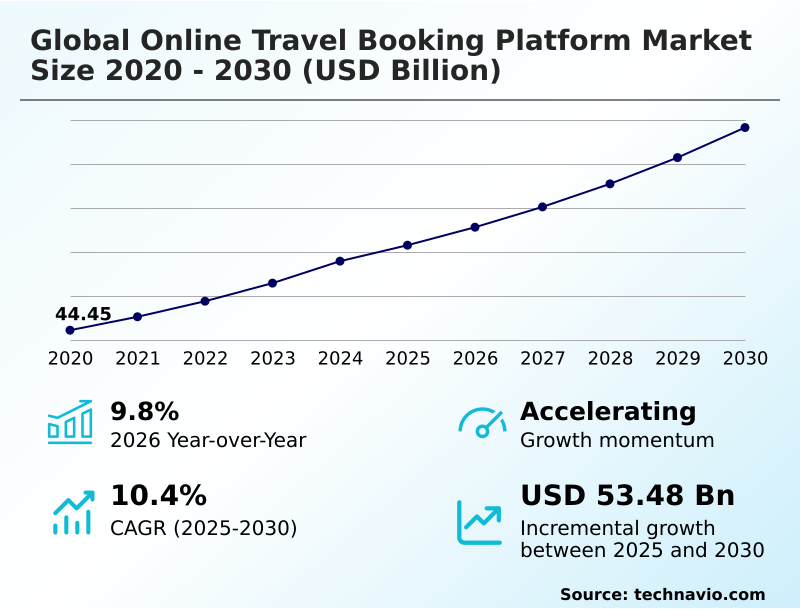
The online travel booking platform market size is valued to increase by USD 53.48 billion, at a CAGR of 10.4% from 2025 to 2030. Proliferation of mobile device penetration and dedicated applications will drive the online travel booking platform market.

Major Market Trends & Insights

  • APAC dominated the market and accounted for a 49.9% growth during the forecast period.
  • By Platform - Mobile or tablet segment was valued at USD 50.22 billion in 2024
  • By Service - Transportation booking segment accounted for the largest market revenue share in 2024

Market Size & Forecast

  • Market Opportunities: USD 92.12 billion
  • Market Future Opportunities: USD 53.48 billion
  • CAGR from 2025 to 2030 : 10.4%

Market Summary

  • The Online Travel Booking Platform operates as a hyper-connected digital ecosystem that continuously synchronizes disparate hospitality and transportation inventories into unified consumer interfaces. Driven heavily by the proliferation of mobile applications and digital wallet ecosystems, consumer procurement behavior has shifted decisively toward spontaneous, on-the-move itinerary management.
  • Consequently, platform operators successfully deploying native mobile reservation environments have documented customer retention rates improving by up to 22% compared to legacy desktop-only booking channels. In real-world operational scenarios, enterprise corporate travel managers utilize these consolidated portals to enforce localized compliance policies and automate managerial approval workflows, drastically reducing administrative overhead.
  • However, the sector faces a formidable challenge from sophisticated cybersecurity threats and credential-stuffing attacks that exploit fragmented legacy travel networks. When third-party application programming interfaces are compromised, systemic data breaches immediately erode consumer trust and trigger severe regulatory penalties.
  • To safeguard transactional integrity, platforms are compelled to allocate significant resources toward multi-factor biometric security protocols, dynamically balancing the demand for frictionless checkout with rigorous data privacy compliance.

What will be the Size of the Online Travel Booking Platform Market during the forecast period?
Get Key Insights on Market Forecast (PDF) Get Free Sample

How is the Online Travel Booking Platform Market Segmented?

The online travel booking platform industry research report provides comprehensive data (region-wise segment analysis), with forecasts and estimates in "USD million" for the period 2026-2030, as well as historical data from 2020-2024 for the following segments.

  • Platform
    • Mobile or tablet
    • Desktop or laptop
  • Service
    • Transportation booking
    • Accommodation booking
    • Vacation packages
    • Others
  • End-user
    • Leisure
    • Business
  • Mode of booking
    • Direct
    • Third-party
  • Geography
    • APAC
      • China
      • Japan
      • India
      • Australia
      • South Korea
      • Singapore
    • North America
      • US
      • Canada
      • Mexico
    • Europe
      • UK
      • Germany
      • France
      • Italy
      • Spain
      • The Netherlands
    • South America
      • Brazil
      • Argentina
      • Colombia
    • Middle East and Africa
      • UAE
      • Saudi Arabia
      • South Africa
      • Israel
      • Egypt

By Platform Insights

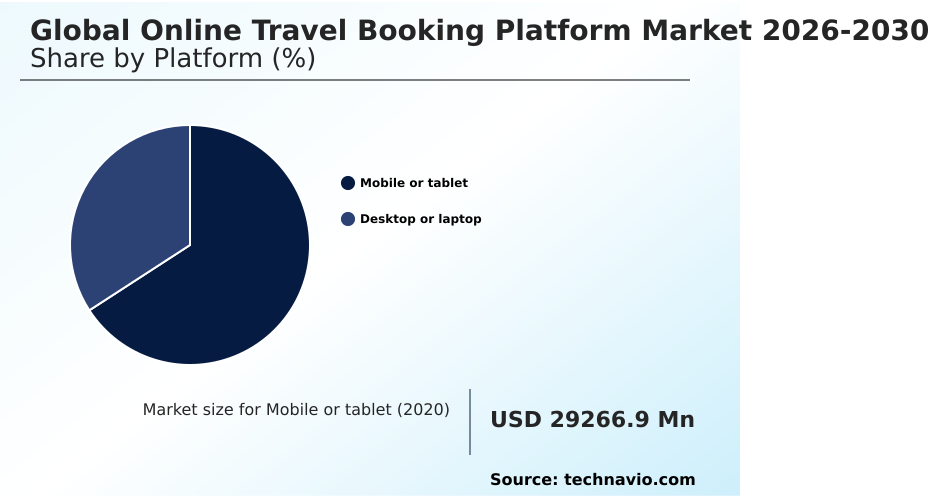
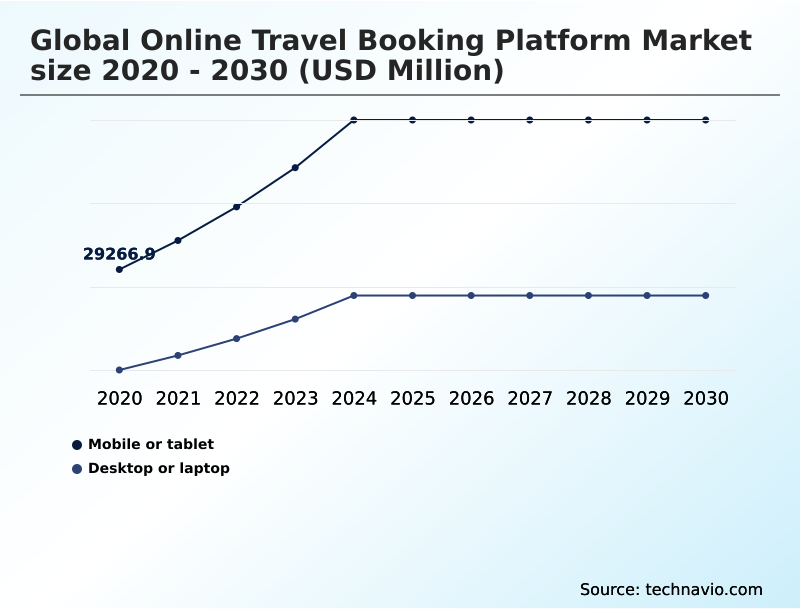
The mobile or tablet segment is estimated to witness significant growth during the forecast period.

The mobile or tablet interface represents an exponentially expanding access channel within the Online Travel Booking Platform landscape, fundamentally altering how modern consumers discover and execute itineraries.

Engineered to deliver rapid information retrieval, these digital storefront architectures leverage progressive web technologies to minimize transaction friction across global inventories. A critical operational advantage of this channel is its capacity to facilitate spontaneous, situational arrangements while already in transit.

Through precise location-based tracking and centralized itinerary assembly, operators have witnessed cart abandonment rates decline by up to 18% during high-traffic holiday periods.

To capitalize on immediate transactional behavior, enterprises continuously update their ecosystems with cross-channel loyalty point incentives and integrate unified invoicing interface capabilities directly into native applications. This structural focus on seamless procurement ensures multi-destination international planning remains highly intuitive.
Get Free Sample

The Mobile or tablet segment was valued at USD 50.22 billion in 2024 and showed a gradual increase during the forecast period.
Get Free Sample

Regional Analysis

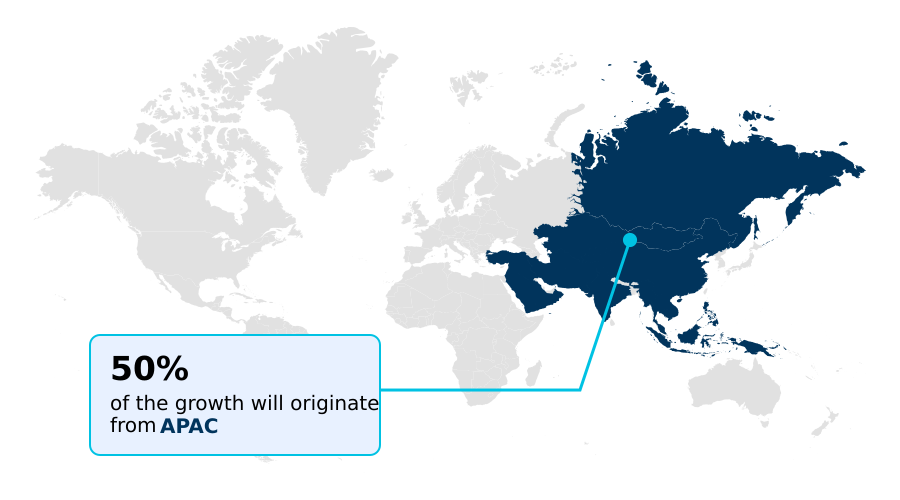
APAC is estimated to contribute 49.9% to the growth of the global market during the forecast period.Technavio’s analysts have elaborately explained the regional trends and drivers that shape the market during the forecast period.
See How Online Travel Booking Platform Market Demand is Rising in APAC Get Free Sample

The geographic landscape of the Online Travel Booking Platform is primarily defined by rapid structural digitization, with the APAC region exhibiting distinct behavioral shifts compared to the highly regulated European sector.

In APAC, the dominance of mobile-first consumer groups utilizing hyper-personalized property recommendations has accelerated transaction velocities, driving localized platform engagement 35% higher than traditional desktop interfaces.

To capture this volume, operators are extensively deploying algorithmic pricing modules and localized language support. Conversely, the European market is heavily shaped by environmental compliance, where strict mandates necessitate the integration of eco-certified lodging choices into unified consumer touchpoints.

European platforms implementing verified sustainability filtering have observed a 24% increase in compliant corporate travel conversions.

While APAC prioritizes frictionless checkout via localized super-apps, European development centers on robust data privacy and transparent carbon footprint reporting, compelling digital travel aggregators to continuously adapt their regional architectural strategies to maintain operational momentum.

Market Dynamics

Our researchers analyzed the data with 2025 as the base year, along with the key drivers, trends, and challenges. A holistic analysis of drivers will help companies refine their marketing strategies to gain a competitive advantage.

  • The foundational architecture of the Online Travel Booking Platform is undergoing a massive paradigm shift, driven fundamentally by the integration of embedded financial technologies and localized language support booking functionalities. As enterprise digital platforms expand to capture diverse international demographics, they increasingly rely on sophisticated application programming interfaces connectivity to ensure seamless data exchange across fragmented hospitality sectors.
  • A critical evolution is the deployment of automated agentic artificial intelligence systems alongside machine learning algorithmic recommendation engines, which dynamically process millions of variables to present optimized routes. This shift translates into tangible operational efficiency, as platforms utilizing unified global distribution system connections report inventory synchronization speeds processing 40% faster than those relying on manual ledger updates.
  • For corporate procurement, the implementation of dynamic pricing mechanisms for corporate travel and real-time tracking of employee logistics allows enterprise travel managers to strictly enforce policy compliance. Furthermore, the integration of centralized corporate enterprise resource planning with secure multi-currency payment clearinghouses architecture drastically mitigates cross-border settlement friction.
  • In the leisure sector, consumer demand for sustainable options has accelerated the development of eco-tourism and nature-based travel platforms featuring verified environmental metrics comparison shopping. As travelers seek frictionless interactions, operators are deploying biometric security protocols for frictionless check-in and digital multi-leg flight combinations to eliminate traditional airport bottlenecks.
  • Finally, the inclusion of automated conversational customer service agents acts as a frontline defense against booking disruptions, providing autonomous digital travel consultants integration that ensures uninterrupted, highly personalized client support throughout the journey lifecycle.
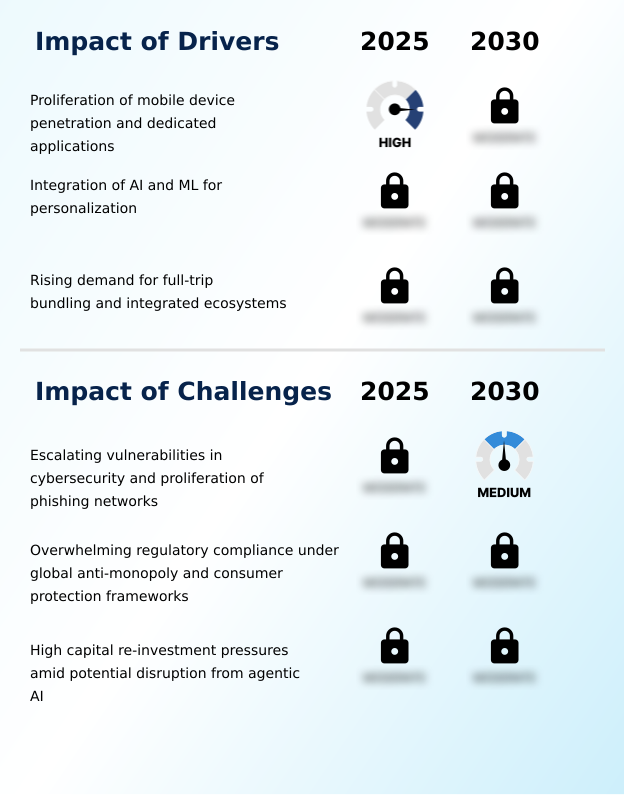
What are the key market drivers leading to the rise in the adoption of Online Travel Booking Platform Industry?

  • The proliferation of mobile device penetration and dedicated application ecosystems serves as a primary catalyst, enabling frictionless, real-time travel procurement across diverse demographic segments.

  • The rapid proliferation of digital wallet ecosystems acts as a primary catalyst accelerating transactional volume across the Online Travel Booking Platform.
  • As consumers increasingly expect fluid, on-the-go financial flexibility, digital aggregators are aggressively integrating multi-currency payment clearinghouses to bypass traditional banking barriers. This strategic modernization enables seamless cross-border settlements, resulting in checkout abandonment rates dropping by 18% in heavily mobile-dependent regions.
  • Furthermore, the implementation of dynamic pricing transparency and location-based personalization allows platforms to push highly relevant, situational offers to travelers while in transit.
  • By combining these frictionless checkout protocols with immediate purchase capabilities, operators effectively expand digital distribution margins and capture impulsive leisure spending, driving robust operational profitability and sustained user engagement worldwide.

What are the market trends shaping the Online Travel Booking Platform Industry?

  • The accelerated emergence of autonomous agentic artificial intelligence represents a structural trend fundamentally reshaping travel planning operations. These intelligent systems transition digital platforms from passive directories to proactive, personalized logistics coordinators.

  • The adoption of conversational artificial intelligence represents a profound structural evolution within the Online Travel Booking Platform, fundamentally transforming how digital marketplaces execute complex reservation logistics. Driven by escalating consumer demand for immediate, personalized curation, operators are rapidly integrating autonomous agentic frameworks capable of negotiating rates and managing real-time disruptions.
  • By deploying these predictive pricing analytics and intelligent search layers, leading enterprise platforms have successfully reduced itinerary modification times by 35%. Furthermore, the implementation of automated bundling algorithms allows aggregators to dynamically package commercial flights with localized accommodations, subsequently improving ancillary service conversion rates by 22%.
  • This technological migration shifts the industry away from manual, passive search directories toward proactive digital consultancy. Ultimately, these advanced computational systems alleviate cognitive fatigue for the consumer while generating highly targeted revenue streams for service providers.

What challenges does the Online Travel Booking Platform Industry face during its growth?

  • Escalating cybersecurity vulnerabilities and the rapid proliferation of sophisticated phishing networks severely threaten digital commerce integrity, representing a critical challenge for global booking operators.

  • Navigating the severe fragmentation of legacy travel networks remains a formidable structural limitation for operators within the Online Travel Booking Platform. The intricate synchronization of computerized reservation systems across thousands of independent hoteliers, airlines, and local tour operators frequently introduces data latency.
  • Consequently, misaligned application programming interfaces have been shown to increase double-booking error rates by up to 14% during peak seasonal demand. Furthermore, rigid supplier exclusivity constraints and unpredictable behavioral profiling algorithms severely complicate the delivery of consistent cross-platform parity.
  • To mitigate these systemic vulnerabilities, digital aggregators must continuously invest heavy capital into biometric security protocols and redundant data validation layers, driving total infrastructure maintenance costs 20% higher and continuously straining the operational liquidity required for rapid global expansion.

Exclusive Technavio Analysis on Customer Landscape

The online travel booking platform market forecasting report includes the adoption lifecycle of the market, covering from the innovator’s stage to the laggard’s stage. It focuses on adoption rates in different regions based on penetration. Furthermore, the online travel booking platform market report also includes key purchase criteria and drivers of price sensitivity to help companies evaluate and develop their market growth analysis strategies.
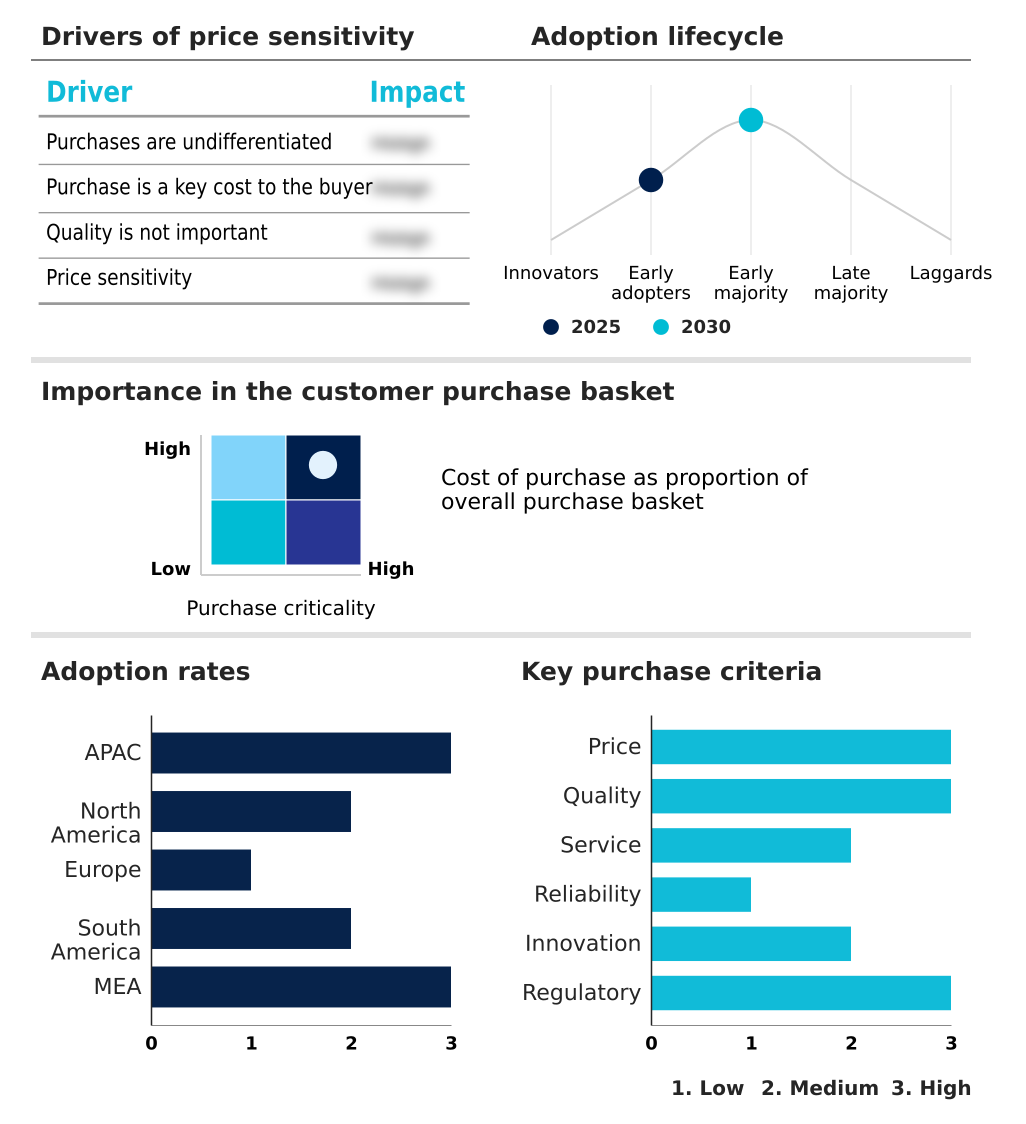
Customer Landscape of Online Travel Booking Platform Industry

Competitive Landscape

Companies are implementing various strategies, such as strategic alliances, online travel booking platform market forecast, partnerships, mergers and acquisitions, geographical expansion, and product/service launches, to enhance their presence in the industry.

BCD Travel - The provider delivers a comprehensive online travel booking platform featuring advanced accommodation reservations, flight coordination, and dynamic travel packaging tailored for leisure and corporate demographics.

The industry research and growth report includes detailed analyses of the competitive landscape of the market and information about key companies, including:

  • BCD Travel
  • Booking Holdings Inc.
  • Despegar.com Corp
  • Easy Trip Planners Ltd
  • eDreams
  • Expedia Group Inc.
  • Flight Centre Travel Group Ltd.
  • GetYourGuide GmbH
  • Hopper Inc.
  • Hostelworld.com Ltd.
  • Kiwi.com sro
  • Klook
  • lastminute.com NV
  • MakeMyTrip Ltd.
  • Navan Inc.
  • Omio
  • Perk
  • TourRadar GmbH
  • Traveloka
  • Yatra Online Inc.

Qualitative and quantitative analysis of companies has been conducted to help clients understand the wider business environment as well as the strengths and weaknesses of key industry players. Data is qualitatively analyzed to categorize companies as pure play, category-focused, industry-focused, and diversified; it is quantitatively analyzed to categorize companies as dominant, leading, strong, tentative, and weak.

Recent Development and News in Online travel booking platform market

  • In the Hotels, Resorts and Cruise Lines industry, the accelerated integration of smart room technologies and automated property management systems has digitized localized property inventory, directly impacting Online Travel Booking Platform demand by requiring seamless backend data exchange between independent hoteliers and global distribution networks.
  • The widespread implementation of strict environmental sustainability metrics across corporate hospitality properties has mandated transparent ecological performance reporting, forcing digital travel aggregators to rapidly redesign search interfaces to highlight eco-certified lodging choices and carbon-neutral transit alternatives.
  • Intensifying regulatory scrutiny over dynamic room pricing models and artificial scarcity indicators has compelled major hospitality chains to standardize direct booking tariffs, subsequently limiting the digital distribution margins historically leveraged by third-party reservation platforms.
  • A systemic shortage of skilled on-site management personnel has driven resorts to adopt self-service kiosk infrastructures and mobile check-in protocols, expanding the necessity for structured data synthesis between native hotel applications and centralized digital storefront architectures to ensure absolute reservation accuracy.

Dive into Technavio’s robust research methodology, blending expert interviews, extensive data synthesis, and validated models for unparalleled Online Travel Booking Platform Market insights. See full methodology.

Market Scope
Page number 309
Base year 2025
Historic period 2020-2024
Forecast period 2026-2030
Growth momentum & CAGR Accelerate at a CAGR of 10.4%
Market growth 2026-2030 USD 53480.1 million
Market structure Fragmented
YoY growth 2025-2026(%) 9.8%
Key countries China, Japan, India, Australia, South Korea, Singapore, US, Canada, Mexico, UK, Germany, France, Italy, Spain, The Netherlands, Brazil, Argentina, Colombia, UAE, Saudi Arabia, South Africa, Israel and Egypt
Competitive landscape Leading Companies, Market Positioning of Companies, Competitive Strategies, and Industry Risks

Request Free Sample

Research Analyst Overview

  • The structural mechanics of the Online Travel Booking Platform are continuously evolving, transitioning from static directories into predictive, highly autonomous retail environments. Modern aggregators increasingly prioritize the deployment of generative AI assistants and conversational artificial intelligence to synthesize complex logistical requests into instantly actionable itineraries.
  • This technological modernization directly impacts boardroom-level budgeting strategies; enterprise travel divisions utilizing these intelligent platforms report a 32% reduction in administrative processing time for multi-leg corporate reservations. To maintain competitive integrity, operators are rapidly embedding multi-currency payment clearinghouses and mobile payment integration directly within their digital storefront architectures. This strategy effectively bypasses traditional cross-border settlement delays and minimizes cart abandonment.
  • Furthermore, as global consumers demand integrated logistical support, platforms leverage real-time inventory synchronization and algorithmic pricing modules to construct seamless multimodal transport integration. The shift toward holistic travel orchestration dictates that platforms must consolidate disparate lodging, transit, and ancillary services into unified consumer touchpoints.
  • By continuously upgrading these underlying computational infrastructures, digital travel marketplaces secure robust operational resilience and maximize transaction volumes across diverse global demographics.

What are the Key Data Covered in this Online Travel Booking Platform Market Research and Growth Report?

  • What is the expected growth of the Online Travel Booking Platform Market between 2026 and 2030?

    • USD 53.48 billion, at a CAGR of 10.4%

  • What segmentation does the market report cover?

    • The report is segmented by Platform (Mobile or tablet, and Desktop or laptop), Service (Transportation booking, Accommodation booking, Vacation packages, and Others), End-user (Leisure, and Business), Mode of Booking (Direct, and Third-party) and Geography (APAC, North America, Europe, South America, Middle East and Africa)

  • Which regions are analyzed in the report?

    • APAC, North America, Europe, South America and Middle East and Africa

  • What are the key growth drivers and market challenges?

    • Proliferation of mobile device penetration and dedicated applications, Escalating vulnerabilities in cybersecurity and proliferation of phishing networks

  • Who are the major players in the Online Travel Booking Platform Market?

    • BCD Travel, Booking Holdings Inc., Despegar.com Corp, Easy Trip Planners Ltd, eDreams, Expedia Group Inc., Flight Centre Travel Group Ltd., GetYourGuide GmbH, Hopper Inc., Hostelworld.com Ltd., Kiwi.com sro, Klook, lastminute.com NV, MakeMyTrip Ltd., Navan Inc., Omio, Perk, TourRadar GmbH, Traveloka and Yatra Online Inc.

Market Research Insights

  • The Online Travel Booking Platform landscape demonstrates robust operational evolution driven by intelligent search layers and autonomous agentic frameworks. As platforms shift away from legacy travel networks, organizations deploying integrated application programming interfaces have achieved a 28% reduction in multi-destination routing errors.
  • The adoption of embedded financial technologies enables seamless, cross-border transactions, reducing cart abandonment by 15% among mobile-first consumer groups. Furthermore, operators executing structured data synthesis to track transparent ecological performance have noted a 20% increase in premium corporate bookings. By optimizing these complex multi-city logistical paths, digital aggregators consistently streamline procurement processes and fortify compliance alignment for enterprise clients worldwide.

We can help! Our analysts can customize this online travel booking platform market research report to meet your requirements.

Get in touch

1. Executive Summary

1.1 Market overview

Executive Summary - Chart on Market Overview
Executive Summary - Data Table on Market Overview
Executive Summary - Chart on Global Market Characteristics
Executive Summary - Chart on Market by Geography
Executive Summary - Chart on Market Segmentation by Platform
Executive Summary - Chart on Market Segmentation by Service
Executive Summary - Chart on Market Segmentation by End-user
Executive Summary - Chart on Market Segmentation by Mode of Booking
Executive Summary - Chart on Incremental Growth
Executive Summary - Data Table on Incremental Growth
Executive Summary - Chart on Company Market Positioning

2. Technavio Analysis

2.1 Analysis of price sensitivity, lifecycle, customer purchase basket, adoption rates, and purchase criteria

2.2 Criticality of inputs and Factors of differentiation

Chart on Overview on criticality of inputs and factors of differentiation

2.3 Factors of disruption

Chart on Overview on factors of disruption

2.4 Impact of drivers and challenges

Chart on Impact of drivers and challenges in 2025 and 2030

3. Market Landscape

3.1 Market ecosystem

Chart on Parent Market
Data Table on - Parent Market

3.2 Market characteristics

Chart on Market characteristics analysis

3.3 Value chain analysis

Chart on Value chain analysis

4. Market Sizing

4.1 Market definition

Data Table on Offerings of companies included in the market definition

4.2 Market segment analysis

Market segments

4.3 Market size 2025

4.4 Market outlook: Forecast for 2025-2030

Chart on Global - Market size and forecast 2025-2030 ($ million)
Data Table on Global - Market size and forecast 2025-2030 ($ million)
Chart on Global Market: Year-over-year growth 2025-2030 (%)
Data Table on Global Market: Year-over-year growth 2025-2030 (%)

5. Historic Market Size

5.1 Global Online Travel Booking Platform Market 2020 - 2024

Historic Market Size - Data Table on Global Online Travel Booking Platform Market 2020 - 2024 ($ million)

5.2 Platform segment analysis 2020 - 2024

Historic Market Size - Platform Segment 2020 - 2024 ($ million)

5.3 Service segment analysis 2020 - 2024

Historic Market Size - Service Segment 2020 - 2024 ($ million)

5.4 End-user segment analysis 2020 - 2024

Historic Market Size - End-user Segment 2020 - 2024 ($ million)

5.5 Mode of Booking segment analysis 2020 - 2024

Historic Market Size - Mode of Booking Segment 2020 - 2024 ($ million)

5.6 Geography segment analysis 2020 - 2024

Historic Market Size - Geography Segment 2020 - 2024 ($ million)

5.7 Country segment analysis 2020 - 2024

Historic Market Size - Country Segment 2020 - 2024 ($ million)

6. Qualitative Analysis

6.1 Impact of AI on global online travel booking platform market

6.2 Impact of geopolitical conflicts on global online travel booking platform market

7. Five Forces Analysis

7.1 Five forces summary

Five forces analysis - Comparison between 2025 and 2030

7.2 Bargaining power of buyers

Bargaining power of buyers - Impact of key factors 2025 and 2030

7.3 Bargaining power of suppliers

Bargaining power of suppliers - Impact of key factors in 2025 and 2030

7.4 Threat of new entrants

Threat of new entrants - Impact of key factors in 2025 and 2030

7.5 Threat of substitutes

Threat of substitutes - Impact of key factors in 2025 and 2030

7.6 Threat of rivalry

Threat of rivalry - Impact of key factors in 2025 and 2030

7.7 Market condition

Chart on Market condition - Five forces 2025 and 2030

8. Market Segmentation by Platform

8.1 Market segments

Chart on Platform - Market share 2025-2030 (%)
Data Table on Platform - Market share 2025-2030 (%)

8.2 Comparison by Platform

Chart on Comparison by Platform
Data Table on Comparison by Platform

8.3 Mobile or tablet - Market size and forecast 2025-2030

Chart on Mobile or tablet - Market size and forecast 2025-2030 ($ million)
Data Table on Mobile or tablet - Market size and forecast 2025-2030 ($ million)
Chart on Mobile or tablet - Year-over-year growth 2025-2030 (%)
Data Table on Mobile or tablet - Year-over-year growth 2025-2030 (%)

8.4 Desktop or laptop - Market size and forecast 2025-2030

Chart on Desktop or laptop - Market size and forecast 2025-2030 ($ million)
Data Table on Desktop or laptop - Market size and forecast 2025-2030 ($ million)
Chart on Desktop or laptop - Year-over-year growth 2025-2030 (%)
Data Table on Desktop or laptop - Year-over-year growth 2025-2030 (%)

8.5 Market opportunity by Platform

Market opportunity by Platform ($ million)
Data Table on Market opportunity by Platform ($ million)

9. Market Segmentation by Service

9.1 Market segments

Chart on Service - Market share 2025-2030 (%)
Data Table on Service - Market share 2025-2030 (%)

9.2 Comparison by Service

Chart on Comparison by Service
Data Table on Comparison by Service

9.3 Transportation booking - Market size and forecast 2025-2030

Chart on Transportation booking - Market size and forecast 2025-2030 ($ million)
Data Table on Transportation booking - Market size and forecast 2025-2030 ($ million)
Chart on Transportation booking - Year-over-year growth 2025-2030 (%)
Data Table on Transportation booking - Year-over-year growth 2025-2030 (%)

9.4 Accommodation booking - Market size and forecast 2025-2030

Chart on Accommodation booking - Market size and forecast 2025-2030 ($ million)
Data Table on Accommodation booking - Market size and forecast 2025-2030 ($ million)
Chart on Accommodation booking - Year-over-year growth 2025-2030 (%)
Data Table on Accommodation booking - Year-over-year growth 2025-2030 (%)

9.5 Vacation packages - Market size and forecast 2025-2030

Chart on Vacation packages - Market size and forecast 2025-2030 ($ million)
Data Table on Vacation packages - Market size and forecast 2025-2030 ($ million)
Chart on Vacation packages - Year-over-year growth 2025-2030 (%)
Data Table on Vacation packages - Year-over-year growth 2025-2030 (%)

9.6 Others - Market size and forecast 2025-2030

Chart on Others - Market size and forecast 2025-2030 ($ million)
Data Table on Others - Market size and forecast 2025-2030 ($ million)
Chart on Others - Year-over-year growth 2025-2030 (%)
Data Table on Others - Year-over-year growth 2025-2030 (%)

9.7 Market opportunity by Service

Market opportunity by Service ($ million)
Data Table on Market opportunity by Service ($ million)

10. Market Segmentation by End-user

10.1 Market segments

Chart on End-user - Market share 2025-2030 (%)
Data Table on End-user - Market share 2025-2030 (%)

10.2 Comparison by End-user

Chart on Comparison by End-user
Data Table on Comparison by End-user

10.3 Leisure - Market size and forecast 2025-2030

Chart on Leisure - Market size and forecast 2025-2030 ($ million)
Data Table on Leisure - Market size and forecast 2025-2030 ($ million)
Chart on Leisure - Year-over-year growth 2025-2030 (%)
Data Table on Leisure - Year-over-year growth 2025-2030 (%)

10.4 Business - Market size and forecast 2025-2030

Chart on Business - Market size and forecast 2025-2030 ($ million)
Data Table on Business - Market size and forecast 2025-2030 ($ million)
Chart on Business - Year-over-year growth 2025-2030 (%)
Data Table on Business - Year-over-year growth 2025-2030 (%)

10.5 Market opportunity by End-user

Market opportunity by End-user ($ million)
Data Table on Market opportunity by End-user ($ million)

11. Market Segmentation by Mode of Booking

11.1 Market segments

Chart on Mode of Booking - Market share 2025-2030 (%)
Data Table on Mode of Booking - Market share 2025-2030 (%)

11.2 Comparison by Mode of Booking

Chart on Comparison by Mode of Booking
Data Table on Comparison by Mode of Booking

11.3 Direct - Market size and forecast 2025-2030

Chart on Direct - Market size and forecast 2025-2030 ($ million)
Data Table on Direct - Market size and forecast 2025-2030 ($ million)
Chart on Direct - Year-over-year growth 2025-2030 (%)
Data Table on Direct - Year-over-year growth 2025-2030 (%)

11.4 Third-party - Market size and forecast 2025-2030

Chart on Third-party - Market size and forecast 2025-2030 ($ million)
Data Table on Third-party - Market size and forecast 2025-2030 ($ million)
Chart on Third-party - Year-over-year growth 2025-2030 (%)
Data Table on Third-party - Year-over-year growth 2025-2030 (%)

11.5 Market opportunity by Mode of Booking

Market opportunity by Mode of Booking ($ million)
Data Table on Market opportunity by Mode of Booking ($ million)

12. Customer Landscape

12.1 Customer landscape overview

Analysis of price sensitivity, lifecycle, customer purchase basket, adoption rates, and purchase criteria

13. Geographic Landscape

13.1 Geographic segmentation

Chart on Market share by geography 2025-2030 (%)
Data Table on Market share by geography 2025-2030 (%)

13.2 Geographic comparison

Chart on Geographic comparison
Data Table on Geographic comparison

13.3 APAC - Market size and forecast 2025-2030

Chart on APAC - Market size and forecast 2025-2030 ($ million)
Data Table on APAC - Market size and forecast 2025-2030 ($ million)
Chart on APAC - Year-over-year growth 2025-2030 (%)
Data Table on APAC - Year-over-year growth 2025-2030 (%)
Chart on Regional Comparison - APAC
Data Table on Regional Comparison - APAC

13.3.1 China - Market size and forecast 2025-2030

Chart on China - Market size and forecast 2025-2030 ($ million)
Data Table on China - Market size and forecast 2025-2030 ($ million)
Chart on China - Year-over-year growth 2025-2030 (%)
Data Table on China - Year-over-year growth 2025-2030 (%)

13.3.2 Japan - Market size and forecast 2025-2030

Chart on Japan - Market size and forecast 2025-2030 ($ million)
Data Table on Japan - Market size and forecast 2025-2030 ($ million)
Chart on Japan - Year-over-year growth 2025-2030 (%)
Data Table on Japan - Year-over-year growth 2025-2030 (%)

13.3.3 India - Market size and forecast 2025-2030

Chart on India - Market size and forecast 2025-2030 ($ million)
Data Table on India - Market size and forecast 2025-2030 ($ million)
Chart on India - Year-over-year growth 2025-2030 (%)
Data Table on India - Year-over-year growth 2025-2030 (%)

13.3.4 Australia - Market size and forecast 2025-2030

Chart on Australia - Market size and forecast 2025-2030 ($ million)
Data Table on Australia - Market size and forecast 2025-2030 ($ million)
Chart on Australia - Year-over-year growth 2025-2030 (%)
Data Table on Australia - Year-over-year growth 2025-2030 (%)

13.3.5 South Korea - Market size and forecast 2025-2030

Chart on South Korea - Market size and forecast 2025-2030 ($ million)
Data Table on South Korea - Market size and forecast 2025-2030 ($ million)
Chart on South Korea - Year-over-year growth 2025-2030 (%)
Data Table on South Korea - Year-over-year growth 2025-2030 (%)

13.3.6 Singapore - Market size and forecast 2025-2030

Chart on Singapore - Market size and forecast 2025-2030 ($ million)
Data Table on Singapore - Market size and forecast 2025-2030 ($ million)
Chart on Singapore - Year-over-year growth 2025-2030 (%)
Data Table on Singapore - Year-over-year growth 2025-2030 (%)

13.4 North America - Market size and forecast 2025-2030

Chart on North America - Market size and forecast 2025-2030 ($ million)
Data Table on North America - Market size and forecast 2025-2030 ($ million)
Chart on North America - Year-over-year growth 2025-2030 (%)
Data Table on North America - Year-over-year growth 2025-2030 (%)
Chart on Regional Comparison - North America
Data Table on Regional Comparison - North America

13.4.1 US - Market size and forecast 2025-2030

Chart on US - Market size and forecast 2025-2030 ($ million)
Data Table on US - Market size and forecast 2025-2030 ($ million)
Chart on US - Year-over-year growth 2025-2030 (%)
Data Table on US - Year-over-year growth 2025-2030 (%)

13.4.2 Canada - Market size and forecast 2025-2030

Chart on Canada - Market size and forecast 2025-2030 ($ million)
Data Table on Canada - Market size and forecast 2025-2030 ($ million)
Chart on Canada - Year-over-year growth 2025-2030 (%)
Data Table on Canada - Year-over-year growth 2025-2030 (%)

13.4.3 Mexico - Market size and forecast 2025-2030

Chart on Mexico - Market size and forecast 2025-2030 ($ million)
Data Table on Mexico - Market size and forecast 2025-2030 ($ million)
Chart on Mexico - Year-over-year growth 2025-2030 (%)
Data Table on Mexico - Year-over-year growth 2025-2030 (%)

13.5 Europe - Market size and forecast 2025-2030

Chart on Europe - Market size and forecast 2025-2030 ($ million)
Data Table on Europe - Market size and forecast 2025-2030 ($ million)
Chart on Europe - Year-over-year growth 2025-2030 (%)
Data Table on Europe - Year-over-year growth 2025-2030 (%)
Chart on Regional Comparison - Europe
Data Table on Regional Comparison - Europe

13.5.1 UK - Market size and forecast 2025-2030

Chart on UK - Market size and forecast 2025-2030 ($ million)
Data Table on UK - Market size and forecast 2025-2030 ($ million)
Chart on UK - Year-over-year growth 2025-2030 (%)
Data Table on UK - Year-over-year growth 2025-2030 (%)

13.5.2 Germany - Market size and forecast 2025-2030

Chart on Germany - Market size and forecast 2025-2030 ($ million)
Data Table on Germany - Market size and forecast 2025-2030 ($ million)
Chart on Germany - Year-over-year growth 2025-2030 (%)
Data Table on Germany - Year-over-year growth 2025-2030 (%)

13.5.3 France - Market size and forecast 2025-2030

Chart on France - Market size and forecast 2025-2030 ($ million)
Data Table on France - Market size and forecast 2025-2030 ($ million)
Chart on France - Year-over-year growth 2025-2030 (%)
Data Table on France - Year-over-year growth 2025-2030 (%)

13.5.4 Italy - Market size and forecast 2025-2030

Chart on Italy - Market size and forecast 2025-2030 ($ million)
Data Table on Italy - Market size and forecast 2025-2030 ($ million)
Chart on Italy - Year-over-year growth 2025-2030 (%)
Data Table on Italy - Year-over-year growth 2025-2030 (%)

13.5.5 Spain - Market size and forecast 2025-2030

Chart on Spain - Market size and forecast 2025-2030 ($ million)
Data Table on Spain - Market size and forecast 2025-2030 ($ million)
Chart on Spain - Year-over-year growth 2025-2030 (%)
Data Table on Spain - Year-over-year growth 2025-2030 (%)

13.5.6 The Netherlands - Market size and forecast 2025-2030

Chart on The Netherlands - Market size and forecast 2025-2030 ($ million)
Data Table on The Netherlands - Market size and forecast 2025-2030 ($ million)
Chart on The Netherlands - Year-over-year growth 2025-2030 (%)
Data Table on The Netherlands - Year-over-year growth 2025-2030 (%)

13.6 South America - Market size and forecast 2025-2030

Chart on South America - Market size and forecast 2025-2030 ($ million)
Data Table on South America - Market size and forecast 2025-2030 ($ million)
Chart on South America - Year-over-year growth 2025-2030 (%)
Data Table on South America - Year-over-year growth 2025-2030 (%)
Chart on Regional Comparison - South America
Data Table on Regional Comparison - South America

13.6.1 Brazil - Market size and forecast 2025-2030

Chart on Brazil - Market size and forecast 2025-2030 ($ million)
Data Table on Brazil - Market size and forecast 2025-2030 ($ million)
Chart on Brazil - Year-over-year growth 2025-2030 (%)
Data Table on Brazil - Year-over-year growth 2025-2030 (%)

13.6.2 Argentina - Market size and forecast 2025-2030

Chart on Argentina - Market size and forecast 2025-2030 ($ million)
Data Table on Argentina - Market size and forecast 2025-2030 ($ million)
Chart on Argentina - Year-over-year growth 2025-2030 (%)
Data Table on Argentina - Year-over-year growth 2025-2030 (%)

13.6.3 Colombia - Market size and forecast 2025-2030

Chart on Colombia - Market size and forecast 2025-2030 ($ million)
Data Table on Colombia - Market size and forecast 2025-2030 ($ million)
Chart on Colombia - Year-over-year growth 2025-2030 (%)
Data Table on Colombia - Year-over-year growth 2025-2030 (%)

13.7 Middle East and Africa - Market size and forecast 2025-2030

Chart on Middle East and Africa - Market size and forecast 2025-2030 ($ million)
Data Table on Middle East and Africa - Market size and forecast 2025-2030 ($ million)
Chart on Middle East and Africa - Year-over-year growth 2025-2030 (%)
Data Table on Middle East and Africa - Year-over-year growth 2025-2030 (%)
Chart on Regional Comparison - Middle East and Africa
Data Table on Regional Comparison - Middle East and Africa

13.7.1 UAE - Market size and forecast 2025-2030

Chart on UAE - Market size and forecast 2025-2030 ($ million)
Data Table on UAE - Market size and forecast 2025-2030 ($ million)
Chart on UAE - Year-over-year growth 2025-2030 (%)
Data Table on UAE - Year-over-year growth 2025-2030 (%)

13.7.2 Saudi Arabia - Market size and forecast 2025-2030

Chart on Saudi Arabia - Market size and forecast 2025-2030 ($ million)
Data Table on Saudi Arabia - Market size and forecast 2025-2030 ($ million)
Chart on Saudi Arabia - Year-over-year growth 2025-2030 (%)
Data Table on Saudi Arabia - Year-over-year growth 2025-2030 (%)

13.7.3 South Africa - Market size and forecast 2025-2030

Chart on South Africa - Market size and forecast 2025-2030 ($ million)
Data Table on South Africa - Market size and forecast 2025-2030 ($ million)
Chart on South Africa - Year-over-year growth 2025-2030 (%)
Data Table on South Africa - Year-over-year growth 2025-2030 (%)

13.7.4 Israel - Market size and forecast 2025-2030

Chart on Israel - Market size and forecast 2025-2030 ($ million)
Data Table on Israel - Market size and forecast 2025-2030 ($ million)
Chart on Israel - Year-over-year growth 2025-2030 (%)
Data Table on Israel - Year-over-year growth 2025-2030 (%)

13.7.5 Egypt - Market size and forecast 2025-2030

Chart on Egypt - Market size and forecast 2025-2030 ($ million)
Data Table on Egypt - Market size and forecast 2025-2030 ($ million)
Chart on Egypt - Year-over-year growth 2025-2030 (%)
Data Table on Egypt - Year-over-year growth 2025-2030 (%)

13.8 Market opportunity by geography

Market opportunity by geography ($ million)
Data Tables on Market opportunity by geography ($ million)

14. Drivers, Challenges, and Opportunity

14.1 Market drivers

Proliferation of mobile device penetration and dedicated applications
Integration of AI and ML for personalization
Rising demand for full-trip bundling and integrated ecosystems

14.2 Market challenges

Escalating vulnerabilities in cybersecurity and proliferation of phishing networks
Overwhelming regulatory compliance under global anti-monopoly and consumer protection frameworks
High capital re-investment pressures amid potential disruption from agentic AI

14.3 Impact of drivers and challenges

Impact of drivers and challenges in 2025 and 2030

14.4 Market opportunities

Accelerated emergence of autonomous agentic AI in travel planning
Mainstream adoption of comprehensive sustainability metrics and eco-centric filters
Expansion of embedded financial solutions and flexible alternative payment ecosystems

15. Competitive Landscape

15.1 Overview

15.2

Overview on criticality of inputs and factors of differentiation

15.3 Landscape disruption

Overview on factors of disruption

15.4 Industry risks

Impact of key risks on business

16. Competitive Analysis

16.1 Companies profiled

Companies covered

16.2 Company ranking index

16.3 Market positioning of companies

Matrix on companies position and classification

16.4 BCD Travel

BCD Travel - Overview
BCD Travel - Product / Service
BCD Travel - Key offerings
SWOT

16.5 Booking Holdings Inc.

Booking Holdings Inc. - Overview
Booking Holdings Inc. - Product / Service
Booking Holdings Inc. - Key offerings
SWOT

16.6 Despegar.com Corp

Despegar.com Corp - Overview
Despegar.com Corp - Product / Service
Despegar.com Corp - Key offerings
SWOT

16.7 Easy Trip Planners Ltd

Easy Trip Planners Ltd - Overview
Easy Trip Planners Ltd - Business segments
Easy Trip Planners Ltd - Key offerings
Easy Trip Planners Ltd - Segment focus
SWOT

16.8 eDreams

eDreams - Overview
eDreams - Product / Service
eDreams - Key offerings
SWOT

16.9 Expedia Group Inc.

Expedia Group Inc. - Overview
Expedia Group Inc. - Business segments
Expedia Group Inc. - Key offerings
Expedia Group Inc. - Segment focus
SWOT

16.10 Flight Centre Travel Group Ltd.

Flight Centre Travel Group Ltd. - Overview
Flight Centre Travel Group Ltd. - Business segments
Flight Centre Travel Group Ltd. - Key offerings
Flight Centre Travel Group Ltd. - Segment focus
SWOT

16.11 GetYourGuide GmbH

GetYourGuide GmbH - Overview
GetYourGuide GmbH - Product / Service
GetYourGuide GmbH - Key offerings
SWOT

16.12 Hopper Inc.

Hopper Inc. - Overview
Hopper Inc. - Product / Service
Hopper Inc. - Key offerings
SWOT

16.13 Hostelworld.com Ltd.

Hostelworld.com Ltd. - Overview
Hostelworld.com Ltd. - Product / Service
Hostelworld.com Ltd. - Key offerings
SWOT

16.14 Klook

Klook - Overview
Klook - Product / Service
Klook - Key offerings
SWOT

16.15 Navan Inc.

Navan Inc. - Overview
Navan Inc. - Product / Service
Navan Inc. - Key offerings
SWOT

16.16 Omio

Omio - Overview
Omio - Product / Service
Omio - Key offerings
SWOT

16.17 Perk

Perk - Overview
Perk - Product / Service
Perk - Key offerings
SWOT

16.18 TourRadar GmbH

TourRadar GmbH - Overview
TourRadar GmbH - Product / Service
TourRadar GmbH - Key offerings
SWOT

17. Appendix

17.1 Scope of the report

Market definition
Objectives
Notes and caveats

17.2 Inclusions and exclusions checklist

Inclusions checklist
Exclusions checklist

17.3 Currency conversion rates for US$

17.4 Research methodology

17.5 Data procurement

Information sources

17.6 Data validation

17.7 Validation techniques employed for market sizing

17.8 Data synthesis

17.9 360 degree market analysis

17.10 List of abbreviations

Research Methodology

Technavio presents a detailed picture of the market by way of study, synthesis, and summation of data from multiple sources. The analysts have presented the various facets of the market with a particular focus on identifying the key industry influencers. The data thus presented is comprehensive, reliable, and the result of extensive research, both primary and secondary.

INFORMATION SOURCES

Primary sources

  • Manufacturers and suppliers
  • Channel partners
  • Industry experts
  • Strategic decision makers

Secondary sources

  • Industry journals and periodicals
  • Government data
  • Financial reports of key industry players
  • Historical data
  • Press releases

DATA ANALYSIS

Data Synthesis

  • Collation of data
  • Estimation of key figures
  • Analysis of derived insights

Data Validation

  • Triangulation with data models
  • Reference against proprietary databases
  • Corroboration with industry experts

REPORT WRITING

Qualitative

  • Market drivers
  • Market challenges
  • Market trends
  • Five forces analysis

Quantitative

  • Market size and forecast
  • Market segmentation
  • Geographical insights
  • Competitive landscape

Interested in this report?

Get your sample now to see our research methodology and insights!

Download Now

Frequently Asked Questions

Online Travel Booking Platform market growth will increase by USD 53480.1 million during 2026-2030.

The Online Travel Booking Platform market is expected to grow at a CAGR of 10.4% during 2026-2030.

Online Travel Booking Platform market is segmented by Platform (Mobile or tablet, Desktop or laptop) Service (Transportation booking, Accommodation booking, Vacation packages, Others) End-user (Leisure, Business) Mode of booking (Direct, Third-party)

BCD Travel, Booking Holdings Inc., Despegar.com Corp, Easy Trip Planners Ltd, eDreams, Expedia Group Inc., Flight Centre Travel Group Ltd., GetYourGuide GmbH, Hopper Inc., Hostelworld.com Ltd., Kiwi.com sro, Klook, lastminute.com NV, MakeMyTrip Ltd., Navan Inc., Omio, Perk, TourRadar GmbH, Traveloka, Yatra Online Inc. are a few of the key vendors in the Online Travel Booking Platform market.

APAC will register the highest growth rate of 49.9% among the other regions. Therefore, the Online Travel Booking Platform market in APAC is expected to garner significant business opportunities for the vendors during the forecast period.

China, Japan, India, Australia, South Korea, Singapore, US, Canada, Mexico, UK, Germany, France, Italy, Spain, The Netherlands, Brazil, Argentina, Colombia, UAE, Saudi Arabia, South Africa, Israel, Egypt

  • Proliferation of mobile device penetration and dedicated applications is the driving factor this market.

The Online Travel Booking Platform market vendors should focus on grabbing business opportunities from the Platform segment as it accounted for the largest market share in the base year.
RIA - Research AI Assistant
Ask RIA
