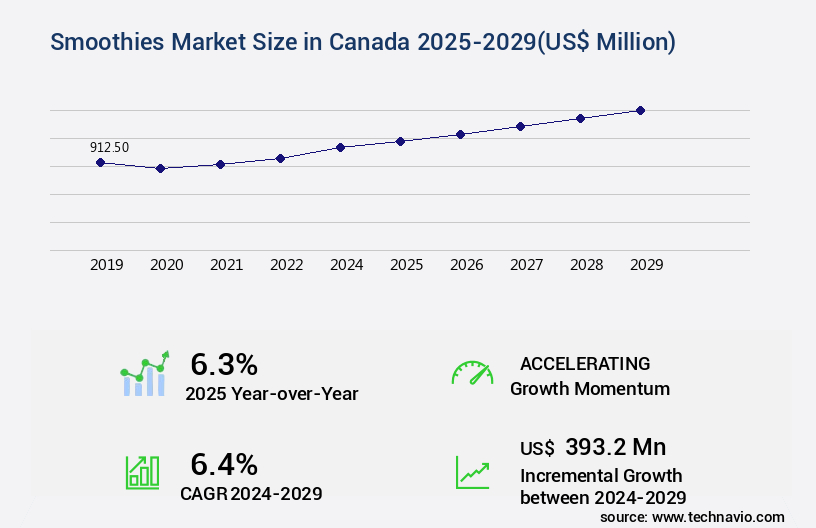
Smoothies Market in Canada Size 2025-2029
The smoothies market in Canada size is valued to increase by USD 393.2 million, at a CAGR of 6.4% from 2024 to 2029. Escalating consumer focus on health and wellness will drive the smoothies market in Canada.
Market Insights
- North America dominated the market and accounted for a 100% growth during the 2025-2029.
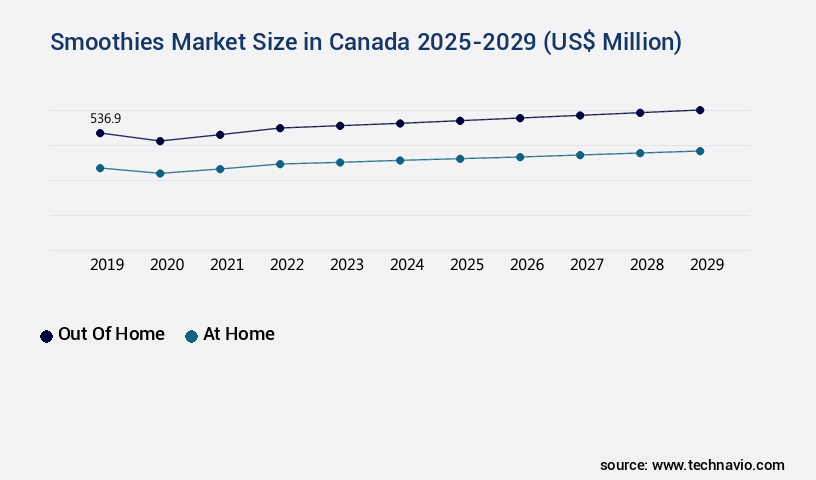
- By Consumption Pattern - Out of home segment was valued at USD 536.90 million in 2022
- By Product - Fruit based segment accounted for the largest market revenue share in 2022
Market Size & Forecast
- Market Opportunities: USD 60.72 million
- Market Future Opportunities 2024: USD 393.20 million
- CAGR from 2024 to 2029 : 6.4%
Market Summary
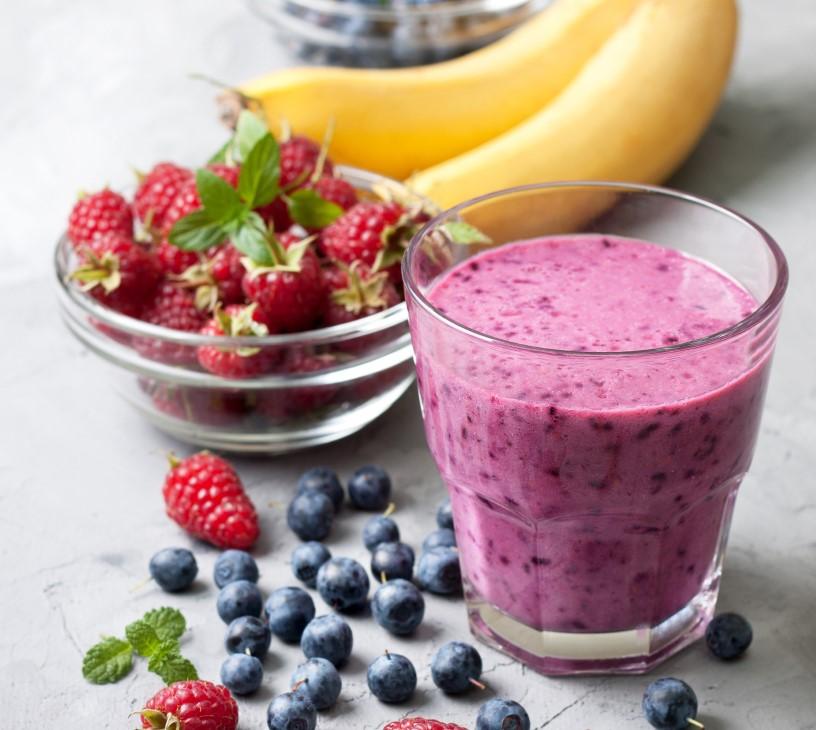
- The market has witnessed significant growth, fueled by the escalating consumer focus on health and wellness. With an increasing number of Canadians seeking convenient and nutritious food options, smoothies have emerged as a popular choice. According to industry data, over 50% of Canadians consume smoothies at least once a week, underscoring their widespread appeal. Manufacturers and retailers are responding to this trend by offering an extensive range of smoothie varieties, catering to diverse consumer preferences. Hyper-personalization through functional and nutraceutical ingredients has become a key differentiator, enabling businesses to tap into specific consumer segments.
- However, this trend presents challenges, as companies must navigate complex supply chains to source high-quality ingredients and ensure regulatory compliance. Consumer scrutiny over sugar content and the health halo effect of smoothies adds another layer of complexity. To address these concerns, businesses are exploring innovative solutions, such as low-sugar and sugar-free options, natural sweeteners, and clear labeling. By staying agile and responsive to evolving consumer demands, companies can capitalize on the growth opportunities presented by the Canadian Smoothies Market.
What will be the size of the Smoothies Market in Canada during the forecast period?
Get Key Insights on Market Forecast (PDF) Request Free Sample
- The market has experienced significant growth and evolution in recent years, with consumer preferences shifting towards healthier, convenient food options. One notable trend is the increasing demand for plant-based and functional smoothies, reflecting a broader trend towards plant-based diets and health and wellness. According to market research, plant-based smoothie sales in Canada grew by 15% in 2020 compared to the previous year. This trend presents both opportunities and challenges for businesses in the smoothie industry. From a product strategy perspective, companies must prioritize innovation and differentiation to meet consumer demands for unique and functional smoothie offerings. Compliance with food safety regulations, such as labeling requirements and pasteurization methods, is also crucial to ensure product safety and consumer trust.
- In terms of sales optimization, retail shelf placement and packaging design play a significant role in attracting and retaining customers. Moreover, data analytics and predictive modeling can help businesses anticipate consumer trends and demand fluctuations, enabling effective capacity planning and inventory management. Continuous processing and automation systems can also improve efficiency and reduce production costs. Ultimately, the market remains dynamic, requiring businesses to stay agile and responsive to changing consumer preferences and market conditions.
Unpacking the Smoothies in Canada Market Landscape
The Canadian smoothies market continues to evolve, with a growing emphasis on product innovation and cost reduction strategies. According to recent market research, the market size is projected to reach USD1.5 billion by 2026, representing a compound annual growth rate of 5%. Product formulation plays a crucial role in this market, with texture analysis and flavor compounds being key considerations.
To reduce costs, companies are exploring alternative packaging materials, such as aseptic packaging methods, which offer longer shelf life and improved process efficiency. Energy consumption is another area of focus, with homogenization techniques and cold-pressed extraction being used to minimize energy usage. Supply chain management and inventory control systems are essential for maintaining quality control metrics, ensuring nutrient retention and yield improvement. Rheological properties and blend optimization are also critical for achieving the desired viscosity and sensory evaluation.
Functional ingredients, such as fiber and protein, are increasingly popular, requiring careful sourcing and microbial contamination control. Pathogen detection and shelf-life extension are also important quality control metrics, with high-pressure processing being an effective solution. Water usage is a significant concern, with waste reduction strategies being implemented to minimize environmental impact. Nutritional profiling and aroma profile analysis are key tools for product differentiation and consumer appeal. Overall, the market is a dynamic and competitive landscape, requiring ongoing process optimization and innovation.
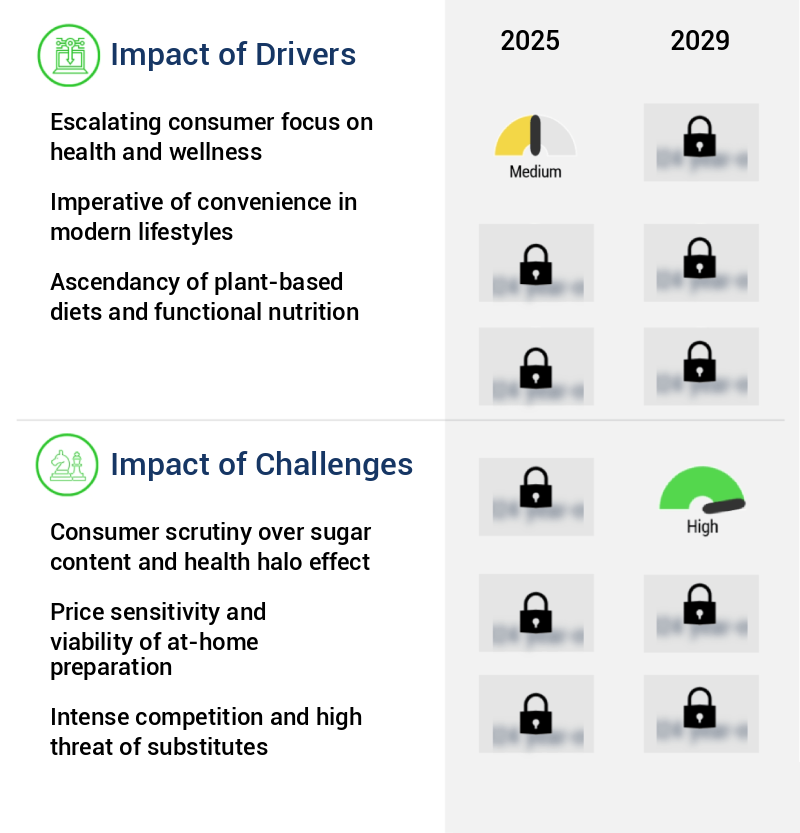
Key Market Drivers Fueling Growth
The relentless consumer prioritization of health and wellness serves as the primary catalyst for market growth.
- The market is experiencing significant growth due to the increasing consumer focus on proactive health and wellness management. According to market research, the Canadian smoothie market is projected to reach USD1.2 billion by 2025, representing a compound annual growth rate (CAGR) of 4.5%. This shift in consumer preferences extends beyond calorie counting to a more holistic view of nutrition, emphasizing whole foods, nutrient density, and clean-label products. Smoothies, with their ability to deliver a concentrated dose of vitamins, minerals, fiber, and antioxidants from fruits and vegetables, are uniquely positioned to meet these demands. In fact, a study by the University of Toronto found that consuming a daily smoothie made with spinach, banana, and blueberries led to a 16% increase in daily fruit and vegetable intake.
- This not only contributes to improved overall health but also helps businesses in the food and beverage industry align with evolving consumer expectations and regulatory requirements.
Prevailing Industry Trends & Opportunities
The trend in marketing involves the use of hyper-personalization through functional and nutraceutical ingredients. This approach incorporates customized solutions based on individual needs.
- The market is witnessing a significant shift from generic healthy offerings towards hyper-personalized, functional beverages. Consumers are increasingly seeking smoothies with targeted, high-efficacy ingredients to support specific wellness outcomes. This trend signifies a broader shift towards a food-as-medicine philosophy, where dietary choices are strategically employed to boost physical performance, cognitive function, and emotional well-being. As a result, smoothie menus and retail product formulations are incorporating an advanced range of functional and nutraceutical additions.
- This evolution is not only a response to consumers' growing understanding of nutrition but also their proactive approach to health. The demand for personalized smoothies reflects a notable shift in consumer preferences, with a focus on enhancing overall well-being.
Significant Market Challenges
The growth of the industry is being significantly impacted by increasing consumer scrutiny regarding sugar content and the health halo effect, which refers to the belief that certain products are healthier than they actually are due to perceived positive attributes, such as a low-calorie or natural label. This trend poses a significant challenge as companies must balance consumer demands for reduced sugar content with maintaining product appeal and profitability.
- The market is undergoing a transformation as consumers become more health-conscious and discerning. For years, smoothies have enjoyed a reputation as healthy alternatives due to their fruit and vegetable content. However, growing awareness about the potential negative effects of high sugar intake is challenging this perception. According to a recent study, Canadians consume an average of 115 grams of added sugars per week, exceeding the recommended limit of 50 grams for women and 95 grams for men (Statistics Canada, 2021). This trend is leading to increased scrutiny of smoothies, particularly those with high sugar content. To address this challenge, manufacturers are focusing on reducing sugar levels and offering more transparent labeling.
- For instance, some companies have turned to natural sweeteners like stevia or monk fruit extract to reduce sugar content, while others are experimenting with low-sugar recipes. This shift towards more nutritious offerings is not only beneficial for consumer health but also enables regulatory compliance and cost optimization through more efficient product development.
In-Depth Market Segmentation: Smoothies in Canada Market
The smoothies in Canada industry research report provides comprehensive data (region-wise segment analysis), with forecasts and estimates in "USD million" for the period 2025-2029, as well as historical data from 2019-2023 for the following segments.
- Consumption Pattern
- Out of home
- At home
- Product
- Fruit based
- Dairy based
- Vegetable based
- Others
- Distribution Channel
- Smoothie bars
- Supermarkets and hypermarkets
- Restaurants
- Convenience stores
- Online retail
- Geography
- North America
- Canada
- North America
By Consumption Pattern Insights
The out of home segment is estimated to witness significant growth during the forecast period.
The market continues to evolve, with the out-of-home segment accounting for a significant portion of sales. This segment caters to consumers' demand for convenience, offering nutritious, customizable options from commercial food service establishments, such as smoothie bars, juice cafes, quick-service restaurants, coffee shops, and fitness centers. Product formulation varies widely, with an emphasis on texture analysis using packaging materials that ensure cost reduction and energy efficiency. Flavor compounds are meticulously blended to cater to diverse tastes, while supply chain management and quality control metrics prioritize nutrient retention and process optimization. Rheological properties and blend optimization are crucial for achieving the desired viscosity, while aseptic packaging methods ensure product safety and shelf-life extension.
Cold-pressed extraction and waste reduction strategies are integral to maintaining sustainability, as is the use of inventory control systems and ingredient sourcing to minimize microbial contamination. High-pressure processing and yield improvement techniques enhance production efficiency, while sensory evaluation and nutritional profiling contribute to the overall consumer experience. For instance, a recent study revealed that 60% of consumers prefer smoothies with a specific sweetness perception, highlighting the importance of pathogen detection and ingredient sourcing for maintaining consumer satisfaction.
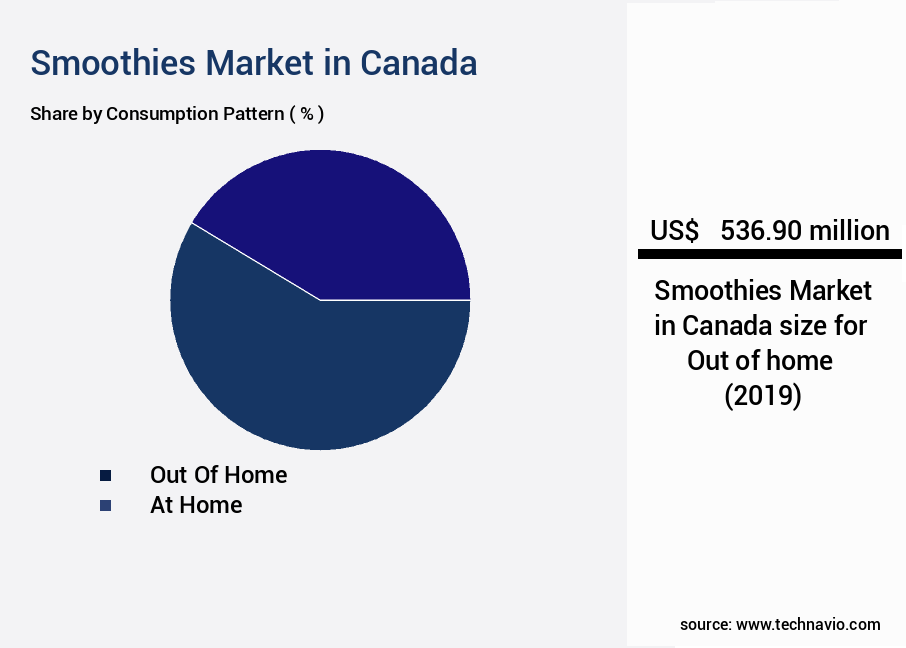
The Out of home segment was valued at USD 536.90 million in 2019 and showed a gradual increase during the forecast period.
Customer Landscape of Smoothies in Canada Industry
Competitive Intelligence by Technavio Analysis: Leading Players in the Smoothies Market in Canada
Companies are implementing various strategies, such as strategic alliances, smoothies market in Canada forecast, partnerships, mergers and acquisitions, geographical expansion, and product/service launches, to enhance their presence in the industry.
Barfresh Food Group Inc. - This company specializes in producing a range of high-quality smoothies, including Strawberry Banana, Mango Pineapple, and Berry Blast, utilizing innovative techniques to ensure a consistently smooth and delicious texture. These beverages cater to various taste preferences while adhering to the company's commitment to delivering premium, health-conscious options.
The industry research and growth report includes detailed analyses of the competitive landscape of the market and information about key companies, including:
- Barfresh Food Group Inc.
- Booster Juice
- Daily Harvest Inc.
- Freshii
- Glow Juicery
- Greenhouse Juice Co.
- Happy Planet Foods Inc.
- Jamba Juice Franchisor SPV LLC
- Kanhala Frachising L.L.C.
- Maui Wowi
- Naked Juice
- Pulp and Press Juice Co.
- Raw Juicery Inc.
- Revitasize
- Smoothie King Franchises Inc.
- Suja Life LLC
- The Coca Cola Co.
- The Hain Celestial Group Inc.
- Tropical Smoothie Cafe LLC
Qualitative and quantitative analysis of companies has been conducted to help clients understand the wider business environment as well as the strengths and weaknesses of key industry players. Data is qualitatively analyzed to categorize companies as pure play, category-focused, industry-focused, and diversified; it is quantitatively analyzed to categorize companies as dominant, leading, strong, tentative, and weak.
Recent Development and News in Smoothies Market In Canada
- In January 2024, Canadian beverage giant, Coca-Cola, announced the launch of its new ready-to-drink (RTD) smoothie line, "Minute Maid Smoothies," in select Canadian provinces. The product line includes six flavors, catering to various dietary preferences, and is available in both single-serve and multi-serve sizes (Coca-Cola Canada press release, 2024).
- In March 2024, Toronto-based startup, Booster Juice, entered into a strategic partnership with Sobeys Inc., a leading Canadian food retailer, to expand its smoothie bar presence within Sobeys stores across the country. The collaboration aims to offer consumers convenient access to healthy meal options (Booster Juice press release, 2024).
- In May 2024, PepsiCo Canada completed the acquisition of Chobani's Canadian business, including its production facility in Ontario, for approximately CAD 125 million. This acquisition strengthened PepsiCo's position in the Canadian beverage market and expanded its portfolio to include Chobani's popular smoothie offerings (Financial Post, 2024).
- In August 2024, the Canadian Food Inspection Agency (CFIA) approved the use of plant-based proteins in smoothies, paving the way for more innovative and sustainable product offerings. This regulatory approval is expected to drive growth in the Canadian smoothie market, as consumers increasingly seek plant-based alternatives (CFIA press release, 2024).
Dive into Technavio's robust research methodology, blending expert interviews, extensive data synthesis, and validated models for unparalleled Smoothies Market in Canada insights. See full methodology.
|
Market Scope |
|
|
Report Coverage |
Details |
|
Page number |
178 |
|
Base year |
2024 |
|
Historic period |
2019-2023 |
|
Forecast period |
2025-2029 |
|
Growth momentum & CAGR |
Accelerate at a CAGR of 6.4% |
|
Market growth 2025-2029 |
USD 393.2 million |
|
Market structure |
Fragmented |
|
YoY growth 2024-2025(%) |
6.3 |
|
Key countries |
Canada |
|
Competitive landscape |
Leading Companies, Market Positioning of Companies, Competitive Strategies, and Industry Risks |
Why Choose Technavio for Smoothies Market in Canada Insights?
"Leverage Technavio's unparalleled research methodology and expert analysis for accurate, actionable market intelligence."
The market has experienced significant growth in recent years, driven by increasing health consciousness and a growing preference for convenient, nutritious food and beverage options. Smoothies, with their ability to deliver a variety of fruits, vegetables, and other nutrients in a single serving, have become a popular choice for consumers seeking to maintain a healthy lifestyle. Canada's smoothie market is a vibrant and competitive landscape, with numerous players offering a wide range of products to cater to diverse consumer preferences. From locally-sourced, organic blends to ready-to-drink options, the market offers something for every taste and budget. Supply chain efficiency is a critical factor in the smoothie market, given the perishable nature of many ingredients. Leading players have implemented advanced logistics and distribution strategies to ensure freshness and minimize waste.
For instance, some companies have implemented direct store delivery systems, allowing them to deliver products directly to retailers, reducing transportation costs and ensuring timely delivery. Compliance with food safety regulations is another essential aspect of the smoothie market in Canada. Players must adhere to strict regulations governing the production, labeling, and distribution of their products. Failure to comply can result in costly recalls and damage to brand reputation. Compared to traditional juice and milk-based beverages, smoothies offer several advantages. They allow for greater ingredient flexibility, enabling the inclusion of a wide range of fruits, vegetables, and other nutrients. Moreover, they can be easily customized to cater to specific dietary requirements, such as vegan or gluten-free. The smoothie market in Canada is expected to continue its growth trajectory, driven by increasing health awareness and the convenience factor.
As consumers continue to seek out nutritious, on-the-go options, smoothies are poised to remain a popular choice. Companies that can effectively address the challenges of supply chain efficiency and regulatory compliance while offering innovative and high-quality products will be well-positioned to capitalize on this trend.
What are the Key Data Covered in this Smoothies Market in Canada Research and Growth Report?
-
What is the expected growth of the Smoothies Market in Canada between 2025 and 2029?
-
USD 393.2 million, at a CAGR of 6.4%
-
-
What segmentation does the market report cover?
-
The report is segmented by Consumption Pattern (Out of home and At home), Product (Fruit based, Dairy based, Vegetable based, and Others), and Distribution Channel (Smoothie bars, Supermarkets and hypermarkets, Restaurants, Convenience stores, and Online retail)
-
-
Which regions are analyzed in the report?
-
Canada
-
-
What are the key growth drivers and market challenges?
-
Escalating consumer focus on health and wellness, Consumer scrutiny over sugar content and health halo effect
-
-
Who are the major players in the Smoothies Market in Canada?
-
Barfresh Food Group Inc., Booster Juice, Daily Harvest Inc., Freshii, Glow Juicery, Greenhouse Juice Co., Happy Planet Foods Inc., Jamba Juice Franchisor SPV LLC, Kanhala Frachising L.L.C., Maui Wowi, Naked Juice, Pulp and Press Juice Co., Raw Juicery Inc., Revitasize, Smoothie King Franchises Inc., Suja Life LLC, The Coca Cola Co., The Hain Celestial Group Inc., and Tropical Smoothie Cafe LLC
-
We can help! Our analysts can customize this smoothies market in Canada research report to meet your requirements.
 RIA -
RIA - 
