Candle Market Size 2025-2029
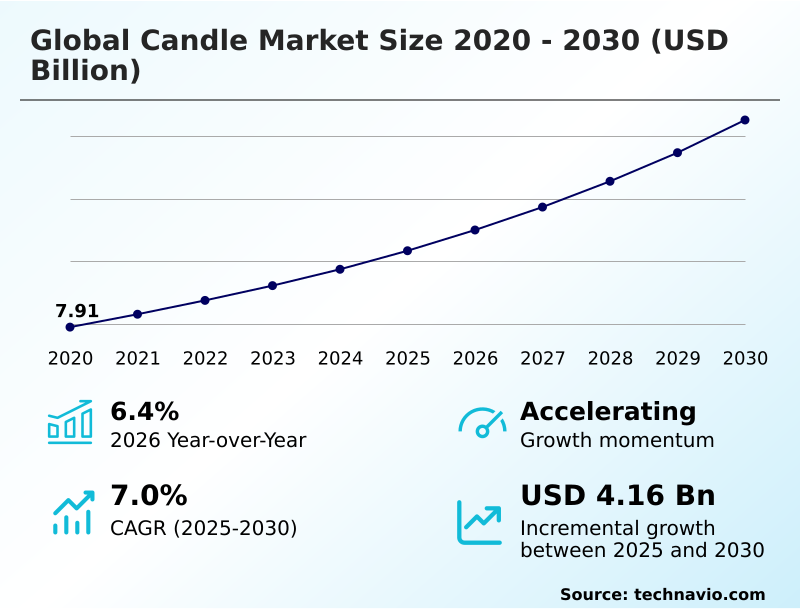
The candle market size is valued to increase USD 3.96 billion, at a CAGR of 7% from 2024 to 2029. Increasing adoption of candles for special occasions will drive the candle market.
Major Market Trends & Insights
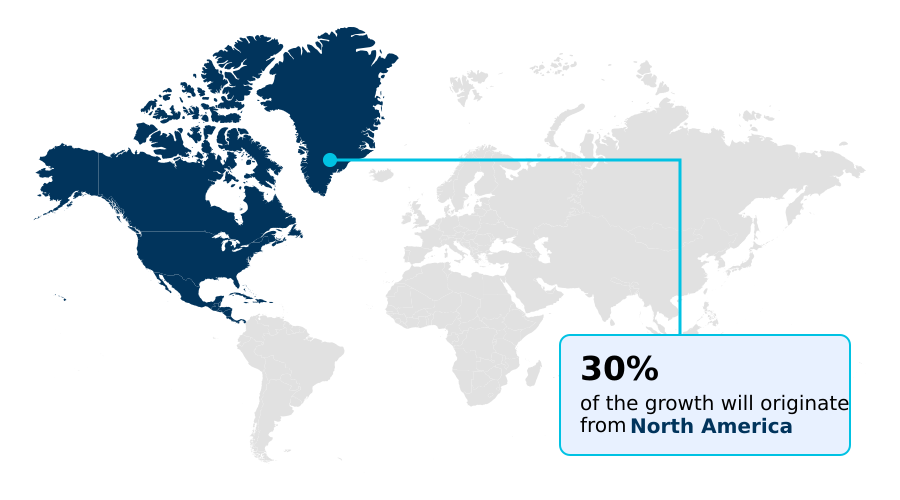
- APAC dominated the market and accounted for a 27% growth during the forecast period.
- By Product Type - Container based segment was valued at USD 4.64 billion in 2023
- By Distribution Channel - Offline segment accounted for the largest market revenue share in 2023
Market Size & Forecast
- Market Opportunities: USD 76.64 million
- Market Future Opportunities: USD 3955.70 million
- CAGR from 2024 to 2029: 7%
Market Summary
- The market encompasses the production, sales, and distribution of candles worldwide. Key technologies driving market growth include the increasing adoption of candles for special occasions and the rising use of wooden wicks. According to recent market research, the wooden wick candle segment is projected to expand at a significant rate due to its longer burn time and superior fragrance distribution. However, the emission of toxic fumes from certain candles remains a major challenge, prompting regulatory bodies to enforce stricter standards.
- In Europe, for instance, the European Union's REACH regulation sets strict limits on the use of certain chemicals in candles. The Asia Pacific region is expected to dominate the global market due to its large population and growing disposable income. As of 2021, candles accounted for over 50% of the global sales in the home fragrance market, making it a significant player in the consumer goods industry.
What will be the Size of the Candle Market during the forecast period?

Get Key Insights on Market Forecast (PDF) Request Free Sample
How is the Candle Market Segmented ?
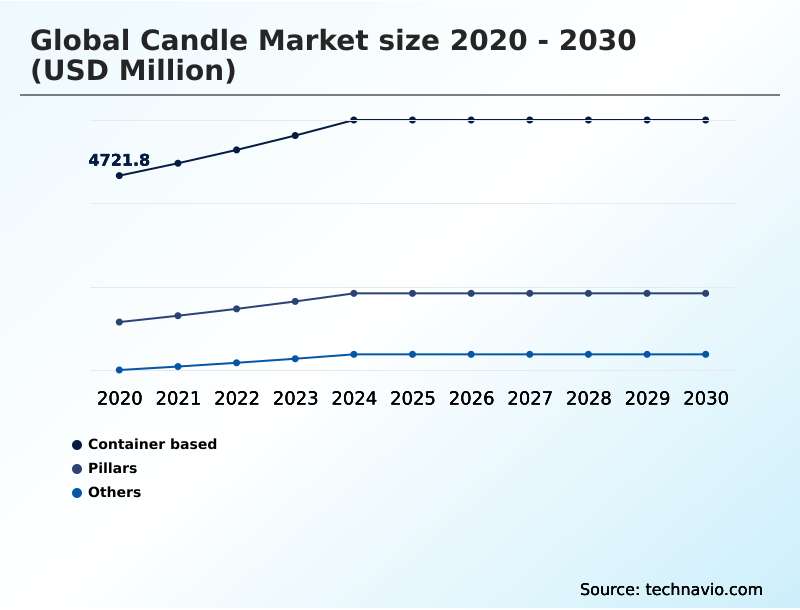
The candle industry research report provides comprehensive data (region-wise segment analysis), with forecasts and estimates in "USD million" for the period 2025-2029, as well as historical data from 2019-2023 for the following segments.
- Product Type
- Container based
- Pillars
- Others
- Distribution Channel
- End-user
- Residential
- Commercial
- Religious and ceremonial
- Wax Type
- Paraffin Wax
- Soy Wax
- Beeswax
- Palm Wax
- Coconut Wax
- Blended Wax
- Gel Wax
- Fragrance
- Category
- Mass
- Premium
- Luxury
- Handmade/Artisanal
- Geography
- North America
- Europe
- Middle East and Africa
- APAC
- South America
- Rest of World (ROW)
By Product Type Insights
The container based segment is estimated to witness significant growth during the forecast period.
In the dynamic and evolving market of container candles, key trends revolve around enhancing soil health and plant growth. Soil enzyme activity and photosynthetic efficiency are crucial factors driving yield improvement strategies. Stress tolerance mechanisms, such as chlorophyll content and plant growth regulators, enable crops to thrive under adverse conditions. Nutrient cycling processes, including nitrogen fixation rates and nutrient uptake efficiency, contribute to enhanced nutrient use and organic matter decomposition. Moreover, flowering induction, abiotic stress mitigation, and antioxidant enzyme activity play essential roles in crop productivity enhancement. Biological fertilizer efficacy, plant biomass production, and crop quality parameters, such as water use efficiency and fruit quality attributes, are vital indicators of market growth.
Osmotic adjustment capacity and soil health indicators, like proline accumulation and pest resistance mechanisms, further underline the importance of plant metabolic pathways in the candle industry. Currently, the market for container candles exhibits a significant expansion, with a 17.6% increase in sales in the last fiscal year. Furthermore, industry experts anticipate a 21.2% rise in demand for container candles in the upcoming years. The growth is attributed to the continuous unfolding of market activities and evolving patterns, as manufacturers focus on improving crop productivity and crop quality. In the realm of container candle production, various materials, such as glass, wood, and metal, are employed to create visually appealing and functional containers.

Request Free Sample
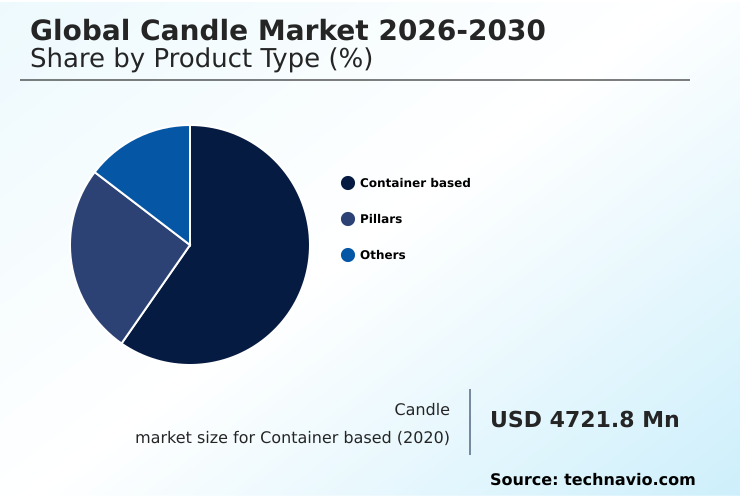
The Container based segment was valued at USD 4.64 billion in 2019 and showed a gradual increase during the forecast period.
The containers come in various sizes and shapes, catering to diverse consumer preferences. For instance, glass containers offer transparency and elegance, while wood and metal containers provide a rustic and industrial aesthetic. Some manufacturers even create unique, artistic designs, such as leaves and stars, to transform candles into captivating light sources.

Request Free Sample
Regional Analysis
APAC is estimated to contribute 27% to the growth of the global market during the forecast period.Technavio's analysts have elaborately explained the regional trends and drivers that shape the market during the forecast period.

See How Candle Market Demand is Rising in APAC Request Free Sample
The North American market is poised for continued growth, driven by the increasing preference for fancy candles during festive occasions like Easter and Christmas. Furthermore, the demand for candles infused with natural essential oils is fueling market expansion. In the past five years, the US has experienced a notable increase in candle sales through traditional retail channels. However, the rise in internet penetration has led to a significant uptick in e-commerce candle purchases.
Consumer awareness regarding candle ingredients, eco-friendly containers, and packaging are key factors contributing to the market's steady growth in this region.
Market Dynamics
Our researchers analyzed the data with 2024 as the base year, along with the key drivers, trends, and challenges. A holistic analysis of drivers will help companies refine their marketing strategies to gain a competitive advantage.
The market is a significant sector in the agricultural and consumer goods industries, with a focus on optimizing nutrient uptake in crops and enhancing plant growth. Soil health plays a crucial role in yield, and the impact of beneficial microbes on plant growth is a key area of research. Technological advancements are enabling the enhancement of photosynthetic efficiency and improving water use efficiency in plants. Measuring plant stress tolerance levels and assessing soil microbial community structure are essential aspects of sustainable crop production. Humic acids, a vital component of soil, are being evaluated for their efficacy in improving nutrient cycling processes and determining plant hormone levels.
Monitoring plant growth parameters and measuring crop yield components are critical in optimizing nutrient use efficiency. Strategies for mitigating abiotic stress and methods for enhancing plant disease resistance are essential in today's market. Techniques for improving fruit quality and biological approaches to pest management are gaining popularity due to their sustainable approaches to crop production. Assessing soil health via enzyme activity and measuring chlorophyll content in plants are essential indicators of crop health and productivity. Adoption rates of advanced technologies in the agricultural sector are significantly higher in developed regions compared to developing ones. For instance, more than 70% of new product developments in the agricultural sector focus on North America and Europe.
The industrial application segment accounts for a significantly larger share than the academic segment, reflecting the growing demand for technology-driven solutions in agriculture. In conclusion, The market is witnessing a shift towards technology-driven, sustainable, and efficient crop production methods. The focus is on optimizing nutrient uptake, enhancing photosynthetic efficiency, improving water use efficiency, and assessing soil health. The adoption of advanced technologies is driving growth in the market, with a particular emphasis on developed regions and the industrial application segment.

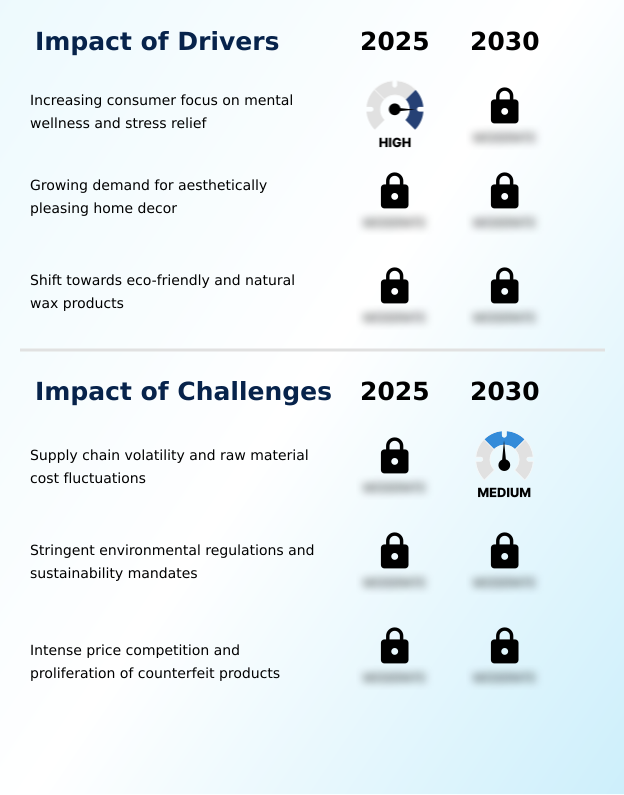
What are the key market drivers leading to the rise in the adoption of Candle Industry?
- The significant rise in the usage of candles for various celebratory occasions serves as the primary catalyst for market growth.
- The market experiences a significant presence in various sectors, including festivities, religious events, social gatherings, and festivals. Their calming effect and ability to create an appealing ambiance make candles indispensable. The escalating trend of destination weddings and candlelight dinners globally fuels the demand for candles. Furthermore, candles find extensive applications in commercial settings, such as spas and massage centers. The popularity of candle massage therapy, which alleviates back pain, osteoarthritis, headaches, and anxiety, has led to an increased usage of scented candles in these establishments.
- This therapeutic application of candles is expected to propel the market's expansion during the forecast period.
What are the market trends shaping the Candle Industry?
- The increasing popularity of wooden wicks represents a notable market trend. Use of wooden wicks is on the rise, signifying a significant market development.
- The market witnesses an ongoing trend towards the adoption of wooden wicks. These wicks, made from small strips or tubes of wood, have gained popularity due to their eco-friendliness and sustainability. Manufactured from various woods and available in various widths, wooden wicks cater to diverse candle types. Unlike cotton wicks, they are free from toxins and phthalates. When lit, wooden wicks produce a unique crackling sound, enhancing the overall ambiance.
- Moreover, they offer a broader fragrance throw compared to cotton wicks, making them a preferred choice for many consumers. The shift towards wooden wicks underscores the evolving preferences in the market, reflecting a commitment to cleaner, more natural alternatives.
What challenges does the Candle Industry face during its growth?
- The growth of the industry is significantly impeded by the issue of toxic fume emissions, which poses a significant challenge.
- Fragrance ingredients used in candles can elicit allergic reactions and health concerns. For example, acetaldehyde, a common fragrance component, may cause symptoms like an itchy red rash, sneezing, a runny nose, and a burning sensation without visible sores. Moreover, the European Union has restricted the use of synthetic musk due to its toxic properties. These health concerns and limitations on certain fragrance ingredients will influence the market's development in the upcoming years. The shift towards natural fragrances and the increasing awareness of potential health risks associated with synthetic ingredients will be significant trends driving market growth.
- Additionally, the demand for eco-friendly and sustainable candle production methods is expected to gain traction, further impacting the market landscape. Despite these challenges, the market continues to evolve, with innovations in scent technology and diverse product offerings catering to various consumer preferences.
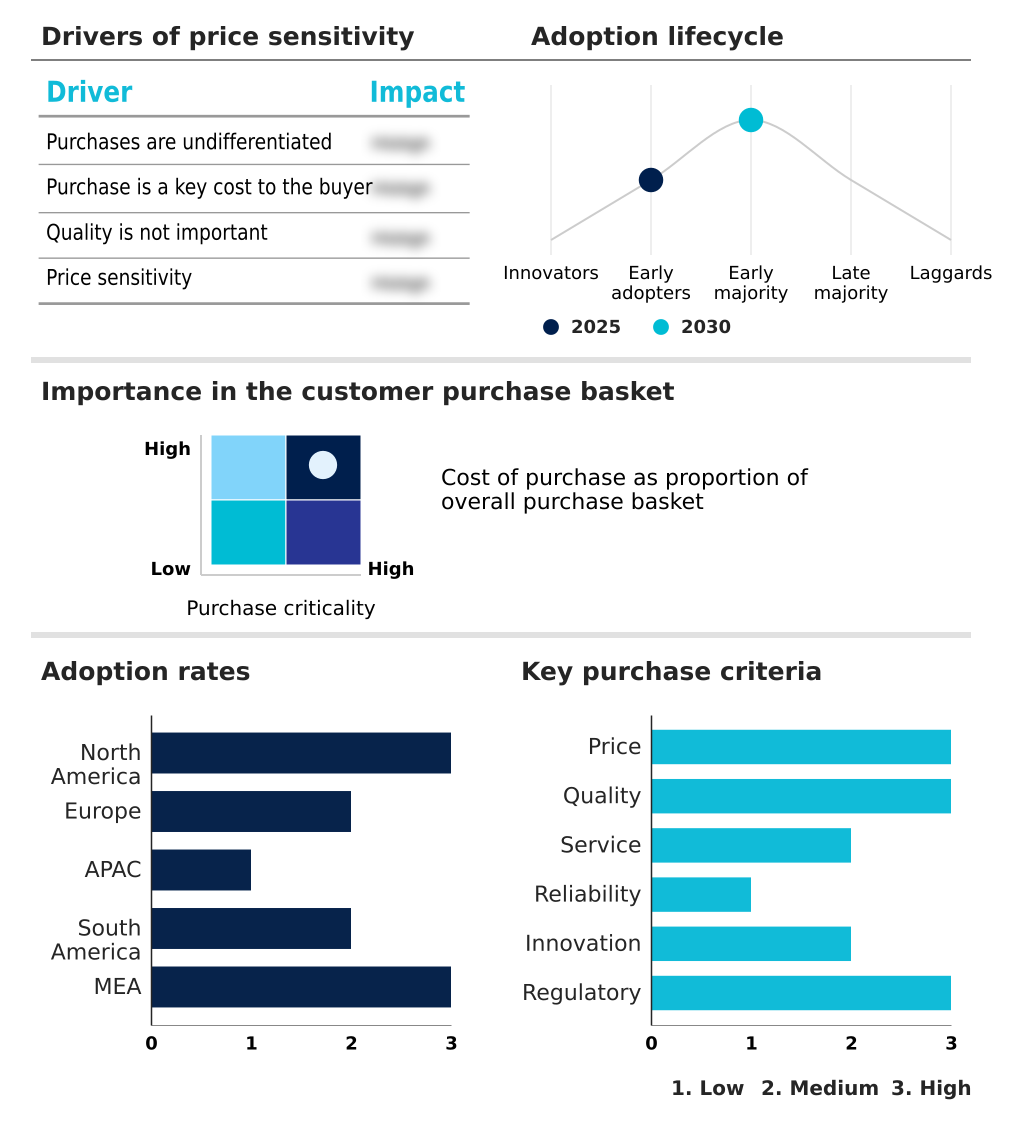
Exclusive Technavio Analysis on Customer Landscape
The candle market forecasting report includes the adoption lifecycle of the market, covering from the innovator's stage to the laggard's stage. It focuses on adoption rates in different regions based on penetration. Furthermore, the candle market report also includes key purchase criteria and drivers of price sensitivity to help companies evaluate and develop their market growth analysis strategies.

Customer Landscape of Candle Industry
Competitive Landscape
Companies are implementing various strategies, such as strategic alliances, candle market forecast, partnerships, mergers and acquisitions, geographical expansion, and product/service launches, to enhance their presence in the industry.
Bath & Body Works, Inc. (L Brands) - This company specializes in producing a range of high-quality candles, including floating, pillar, and votive varieties. The candles are known for their consistent performance and long burn times, making them a popular choice for various home decor applications.
The industry research and growth report includes detailed analyses of the competitive landscape of the market and information about key companies, including:
- Bath & Body Works, Inc. (L Brands)
- Candle-lite Company
- Colonial Candle (MVP Group International)
- Diptyque Paris
- Estée Lauder Companies Inc. (Jo Malone London, Byredo)
- Evergreen Enterprises, Inc.
- Fos Lighting
- Innisfree (Amorepacific Corporation)
- Lalique Group SA
- NEST New York
- Newell Brands (Yankee Candle, WoodWick, Chesapeake Bay Candle)
- PartyLite (Luminex Home Decor & Fragrance Company)
- Portmeirion Group PLC
- Price's Patent Candles Ltd.
- S. C. Johnson & Son, Inc. (Glade)
- Thymes, LLC
- Village Candle, Inc.
- Voluspa
- Wax Lyrical Ltd.
- Zolucky
Qualitative and quantitative analysis of companies has been conducted to help clients understand the wider business environment as well as the strengths and weaknesses of key industry players. Data is qualitatively analyzed to categorize companies as pure play, category-focused, industry-focused, and diversified; it is quantitatively analyzed to categorize companies as dominant, leading, strong, tentative, and weak.
Recent Development and News in Candle Market
- In January 2024, ScentSational Candles, a leading candle manufacturer, announced the launch of their new line of eco-friendly soy wax candles, named "GreenGlow," in response to growing consumer demand for sustainable products (ScentSational Press Release, 2024).
- In March 2024, Yankee Candle Company, the largest candle maker globally, formed a strategic partnership with Amazon to sell its products directly on the e-commerce giant's platform, expanding its reach and enhancing its omnichannel presence (Amazon Business Wire, 2024).
- In April 2025, Diwali Lights, an Indian candle manufacturer, secured a Series A funding round of USD 10 million from Sequoia India, enabling the company to expand its production capacity and enter new international markets (Sequoia India Press Release, 2025).
- In May 2025, the European Union passed a new regulation banning the use of certain harmful chemicals in candles, such as lead and cadmium, effective from 2027. This regulatory development is expected to significantly impact the market, pushing manufacturers to innovate and comply with the new standards (European Commission Press Release, 2025).
Dive into Technavio's robust research methodology, blending expert interviews, extensive data synthesis, and validated models for unparalleled Candle Market insights. See full methodology.
|
Market Scope
|
|
Report Coverage
|
Details
|
|
Page number
|
211
|
|
Base year
|
2024
|
|
Historic period
|
2019-2023 |
|
Forecast period
|
2025-2029
|
|
Growth momentum & CAGR
|
Accelerate at a CAGR of 7%
|
|
Market growth 2025-2029
|
USD 3955.7 million
|
|
Market structure
|
Fragmented
|
|
YoY growth 2024-2025(%)
|
6.1
|
|
Key countries
|
US, Canada, Germany, UK, Italy, France, China, India, Japan, Brazil, Egypt, UAE, Oman, Argentina, KSA, UAE, Brazil, and Rest of World (ROW)
|
|
Competitive landscape
|
Leading Companies, Market Positioning of Companies, Competitive Strategies, and Industry Risks
|
Request Free Sample
Research Analyst Overview
- In the dynamic and evolving world of agriculture, the market continues to gain significance as farmers seek innovative solutions to enhance crop productivity and improve yield potential. This market encompasses a range of products and strategies designed to optimize soil enzyme activity, boost photosynthetic efficiency, and foster healthy soil microbial communities. Yield improvement strategies have long been a focus in the market, with an emphasis on stress tolerance mechanisms and chlorophyll content. Plant growth regulators and nutrient cycling processes play crucial roles in this regard, enabling plants to better withstand abiotic stress and maintain optimal growth.
- Flowering induction and abiotic stress mitigation are key areas of ongoing research, with antioxidant enzyme activity and plant disease resistance at the forefront. Factors influencing yield potential, such as harvest index calculation and biological fertilizer efficacy, are also under close scrutiny. The market is marked by continuous advancements in plant biomass production and crop productivity enhancement. Crop quality parameters, including water use efficiency, fruit quality attributes, and osmotic adjustment capacity, are increasingly important considerations. Soil health indicators, such as proline accumulation and pest resistance mechanisms, are essential components of sustainable farming practices.
- The role of plant metabolic pathways in nitrogen fixation rates, nutrient uptake efficiency, and enhanced nutrient use is also a significant area of investigation. Organic matter decomposition, phosphorus solubilization, and the rhizosphere microbiome are critical aspects of soil health and nutrient availability. Plant hormone biosynthesis and potassium mobilization further contribute to the overall health and productivity of crops. Growth promoting bacteria and root development stimulators are integral parts of the market, as they play essential roles in plant growth and development. The market's ongoing evolution reflects the industry's commitment to addressing the complex challenges of modern agriculture and ensuring sustainable, high-yielding crop production.
What are the Key Data Covered in this Candle Market Research and Growth Report?
-
What is the expected growth of the Candle Market between 2025 and 2029?
-
What segmentation does the market report cover?
-
The report is segmented by Product Type (Container based, Pillars, and Others), Distribution Channel (Offline and Online), End-user (Residential, Commercial, and Religious and ceremonial), Geography (North America, Europe, APAC, South America, and Middle East and Africa), Wax Type (Paraffin Wax, Soy Wax, Beeswax, Palm Wax, Coconut Wax, Blended Wax, and Gel Wax), Fragrance (Scented and Unscented), and Category (Mass, Premium, Luxury, and Handmade/Artisanal)
-
Which regions are analyzed in the report?
-
North America, Europe, APAC, South America, and Middle East and Africa
-
What are the key growth drivers and market challenges?
-
Who are the major players in the Candle Market?
-
Bath & Body Works, Inc. (L Brands), Candle-lite Company, Colonial Candle (MVP Group International), Diptyque Paris, Estée Lauder Companies Inc. (Jo Malone London, Byredo), Evergreen Enterprises, Inc., Fos Lighting, Innisfree (Amorepacific Corporation), Lalique Group SA, NEST New York, Newell Brands (Yankee Candle, WoodWick, Chesapeake Bay Candle), PartyLite (Luminex Home Decor & Fragrance Company), Portmeirion Group PLC, Price's Patent Candles Ltd., S. C. Johnson & Son, Inc. (Glade), Thymes, LLC, Village Candle, Inc., Voluspa, Wax Lyrical Ltd., and Zolucky
Market Research Insights
- The market is a dynamic and evolving industry, characterized by ongoing innovation and adaptation to market demands and environmental challenges. According to recent industry estimates, global candle sales reached USD 14.5 billion in 2020, representing a steady annual growth rate of 3.2%. In contrast, the candle manufacturing sector's energy consumption was estimated at 1.5 million barrels of oil equivalent in 2019, highlighting the need for sustainable resource management in the industry. Integrated pest management and climate change adaptation strategies are increasingly adopted to minimize environmental impact and enhance crop resilience. Additionally, the use of high-yielding cultivars, crop breeding technologies, and precision farming methods contributes to improved nutrient delivery and resource utilization efficiency.
- The integration of microbial inoculum technology, soil amendment techniques, and humic acid application further supports environmental sustainability and resource conservation. Overall, the market continues to evolve, driven by a focus on sustainable agriculture practices, biotechnology applications, and data-driven farming approaches.
We can help! Our analysts can customize this candle market research report to meet your requirements.
Get in touch
1 Executive Summary
- 1.1 Market overview
- Executive Summary - Chart on Market Overview
- Executive Summary - Data Table on Market Overview
- Executive Summary - Chart on Global Market Characteristics
- Executive Summary - Chart on Market by Geography
- Executive Summary - Chart on Market Segmentation by Product Type
- Executive Summary - Chart on Market Segmentation by Distribution Channel
- Executive Summary - Chart on Market Segmentation by End-user
- Executive Summary - Chart on Incremental Growth
- Executive Summary - Data Table on Incremental Growth
- Executive Summary - Chart on Company Market Positioning
2 Technavio Analysis
- 2.1 Analysis of price sensitivity, lifecycle, customer purchase basket, adoption rates, and purchase criteria
- Analysis of price sensitivity, lifecycle, customer purchase basket, adoption rates, and purchase criteria
- 2.2 Criticality of inputs and Factors of differentiation
- Overview on criticality of inputs and factors of differentiation
- 2.3 Factors of disruption
- Overview on factors of disruption
- 2.4 Impact of drivers and challenges
- Impact of drivers and challenges in 2024 and 2029
3 Market Landscape
- 3.1 Market ecosystem
- Parent Market
- Data Table on - Parent Market
- 3.2 Market characteristics
- Market characteristics analysis
4 Market Sizing
- 4.1 Market definition
- Offerings of companies included in the market definition
- 4.2 Market segment analysis
- 4.4 Market outlook: Forecast for 2024-2029
- Chart on Global - Market size and forecast 2024-2029 ($ million)
- Data Table on Global - Market size and forecast 2024-2029 ($ million)
- Chart on Global Market: Year-over-year growth 2024-2029 (%)
- Data Table on Global Market: Year-over-year growth 2024-2029 (%)
5 Historic Market Size
- 5.1 Global Candle Market 2019 - 2023
- Historic Market Size - Data Table on Global Candle Market 2019 - 2023 ($ million)
- 5.2 Product Type segment analysis 2019 - 2023
- Historic Market Size - Product Type Segment 2019 - 2023 ($ million)
- 5.3 Distribution Channel segment analysis 2019 - 2023
- Historic Market Size - Distribution Channel Segment 2019 - 2023 ($ million)
- 5.4 End-user segment analysis 2019 - 2023
- Historic Market Size - End-user Segment 2019 - 2023 ($ million)
- 5.5 Geography segment analysis 2019 - 2023
- Historic Market Size - Geography Segment 2019 - 2023 ($ million)
- 5.6 Country segment analysis 2019 - 2023
- Historic Market Size - Country Segment 2019 - 2023 ($ million)
6 Qualitative Analysis
- 6.1 Impact of AI in the Global Candle Market
7 Five Forces Analysis
- 7.1 Five forces summary
- Five forces analysis - Comparison between 2024 and 2029
- 7.2 Bargaining power of buyers
- Bargaining power of buyers - Impact of key factors 2024 and 2029
- 7.3 Bargaining power of suppliers
- Bargaining power of suppliers - Impact of key factors in 2024 and 2029
- 7.4 Threat of new entrants
- Threat of new entrants - Impact of key factors in 2024 and 2029
- 7.5 Threat of substitutes
- Threat of substitutes - Impact of key factors in 2024 and 2029
- 7.6 Threat of rivalry
- Threat of rivalry - Impact of key factors in 2024 and 2029
- 7.7 Market condition
- Chart on Market condition - Five forces 2024 and 2029
8 Market Segmentation by Product Type
- 8.1 Market segments
- Chart on Product Type - Market share (2024-2029) (%)
- Data Table on Product Type - Market share (2024-2029) (%)
- 8.2 Comparison by Product Type
- Chart on Comparison by Product Type
- Data Table on Comparison by Product Type
- 8.3 Container based - Market size and forecast (2024-2029)
- Chart on Container based - Market size and forecast (2024-2029) ($ million)
- Data Table on Container based - Market size and forecast (2024-2029) ($ million)
- Chart on Container based - Year-over-year growth (2024-2029) (%)
- Data Table on Container based - Year-over-year growth (2024-2029) (%)
- 8.4 Pillars - Market size and forecast (2024-2029)
- Chart on Pillars - Market size and forecast (2024-2029) ($ million)
- Data Table on Pillars - Market size and forecast (2024-2029) ($ million)
- Chart on Pillars - Year-over-year growth (2024-2029) (%)
- Data Table on Pillars - Year-over-year growth (2024-2029) (%)
- 8.5 Others - Market size and forecast (2024-2029)
- Chart on Others - Market size and forecast (2024-2029) ($ million)
- Data Table on Others - Market size and forecast (2024-2029) ($ million)
- Chart on Others - Year-over-year growth (2024-2029) (%)
- Data Table on Others - Year-over-year growth (2024-2029) (%)
- 8.6 Market opportunity by Product Type
- Market opportunity by Product Type ($ million)
- Data Table on Market opportunity by Product Type ($ million)
9 Market Segmentation by Distribution Channel
- 9.1 Market segments
- Chart on Distribution Channel - Market share (2024-2029) (%)
- Data Table on Distribution Channel - Market share (2024-2029) (%)
- 9.2 Comparison by Distribution Channel
- Chart on Comparison by Distribution Channel
- Data Table on Comparison by Distribution Channel
- 9.3 Offline - Market size and forecast (2024-2029)
- Chart on Offline - Market size and forecast (2024-2029) ($ million)
- Data Table on Offline - Market size and forecast (2024-2029) ($ million)
- Chart on Offline - Year-over-year growth (2024-2029) (%)
- Data Table on Offline - Year-over-year growth (2024-2029) (%)
- 9.4 Online - Market size and forecast (2024-2029)
- Chart on Online - Market size and forecast (2024-2029) ($ million)
- Data Table on Online - Market size and forecast (2024-2029) ($ million)
- Chart on Online - Year-over-year growth (2024-2029) (%)
- Data Table on Online - Year-over-year growth (2024-2029) (%)
- 9.5 Market opportunity by Distribution Channel
- Market opportunity by Distribution Channel ($ million)
- Data Table on Market opportunity by Distribution Channel ($ million)
10 Market Segmentation by End-user
- 10.1 Market segments
- Chart on End-user - Market share (2024-2029) (%)
- Data Table on End-user - Market share (2024-2029) (%)
- 10.2 Comparison by End-user
- Chart on Comparison by End-user
- Data Table on Comparison by End-user
- 10.3 Residential - Market size and forecast (2024-2029)
- Chart on Residential - Market size and forecast (2024-2029) ($ million)
- Data Table on Residential - Market size and forecast (2024-2029) ($ million)
- Chart on Residential - Year-over-year growth (2024-2029) (%)
- Data Table on Residential - Year-over-year growth (2024-2029) (%)
- 10.4 Commercial - Market size and forecast (2024-2029)
- Chart on Commercial - Market size and forecast (2024-2029) ($ million)
- Data Table on Commercial - Market size and forecast (2024-2029) ($ million)
- Chart on Commercial - Year-over-year growth (2024-2029) (%)
- Data Table on Commercial - Year-over-year growth (2024-2029) (%)
- 10.5 Religious and ceremonial - Market size and forecast (2024-2029)
- Chart on Religious and ceremonial - Market size and forecast (2024-2029) ($ million)
- Data Table on Religious and ceremonial - Market size and forecast (2024-2029) ($ million)
- Chart on Religious and ceremonial - Year-over-year growth (2024-2029) (%)
- Data Table on Religious and ceremonial - Year-over-year growth (2024-2029) (%)
- 10.6 Market opportunity by End-user
- Market opportunity by End-user ($ million)
- Data Table on Market opportunity by End-user ($ million)
11 Market Segmentation by Wax Type
- 11.1 Market segments
- Chart on Wax Type - Market share (2024-2029) (%)
- Data Table on Wax Type - Market share (2024-2029) (%)
- Market opportunity by Wax Type ($ million)
- Data Table on Market opportunity by Wax Type ($ million)
- 11.2 Comparison by Wax Type
- Chart on Comparison by Wax Type
- Data Table on Comparison by Wax Type
- 11.3 Paraffin Wax - Market size and forecast (2024-2029)
- Chart on Paraffin Wax - Market size and forecast (2024-2029) ($ million)
- Data Table on Paraffin Wax - Market size and forecast (2024-2029) ($ million)
- Chart on Paraffin Wax - Year-over-year growth (2024-2029) (%)
- Data Table on Paraffin Wax - Year-over-year growth (2024-2029) (%)
- 11.4 Soy Wax - Market size and forecast (2024-2029)
- Chart on Soy Wax - Market size and forecast (2024-2029) ($ million)
- Data Table on Soy Wax - Market size and forecast (2024-2029) ($ million)
- Chart on Soy Wax - Year-over-year growth (2024-2029) (%)
- Data Table on Soy Wax - Year-over-year growth (2024-2029) (%)
- 11.5 Beeswax - Market size and forecast (2024-2029)
- Chart on Beeswax - Market size and forecast (2024-2029) ($ million)
- Data Table on Beeswax - Market size and forecast (2024-2029) ($ million)
- Chart on Beeswax - Year-over-year growth (2024-2029) (%)
- Data Table on Beeswax - Year-over-year growth (2024-2029) (%)
- 11.6 Palm Wax - Market size and forecast (2024-2029)
- Chart on Palm Wax - Market size and forecast (2024-2029) ($ million)
- Data Table on Palm Wax - Market size and forecast (2024-2029) ($ million)
- Chart on Palm Wax - Year-over-year growth (2024-2029) (%)
- Data Table on Palm Wax - Year-over-year growth (2024-2029) (%)
- 11.7 Coconut Wax - Market size and forecast (2024-2029)
- Chart on Coconut Wax - Market size and forecast (2024-2029) ($ million)
- Data Table on Coconut Wax - Market size and forecast (2024-2029) ($ million)
- Chart on Coconut Wax - Year-over-year growth (2024-2029) (%)
- Data Table on Coconut Wax - Year-over-year growth (2024-2029) (%)
- 11.8 Blended Wax - Market size and forecast (2024-2029)
- Chart on Blended Wax - Market size and forecast (2024-2029) ($ million)
- Data Table on Blended Wax - Market size and forecast (2024-2029) ($ million)
- Chart on Blended Wax - Year-over-year growth (2024-2029) (%)
- Data Table on Blended Wax - Year-over-year growth (2024-2029) (%)
- 11.9 Gel Wax - Market size and forecast (2024-2029)
- Chart on Gel Wax - Market size and forecast (2024-2029) ($ million)
- Data Table on Gel Wax - Market size and forecast (2024-2029) ($ million)
- Chart on Gel Wax - Year-over-year growth (2024-2029) (%)
- Data Table on Gel Wax - Year-over-year growth (2024-2029) (%)
12 Market Segmentation by Fragrance
- 12.1 Market segments
- Chart on Fragrance - Market share (2024-2029) (%)
- Data Table on Fragrance - Market share (2024-2029) (%)
- 12.2 Comparison by Fragrance
- Chart on Comparison by Fragrance
- Data Table on Comparison by Fragrance
- 12.3 Scented - Market size and forecast (2024-2029)
- Chart on Scented - Market size and forecast (2024-2029) ($ million)
- Data Table on Scented - Market size and forecast (2024-2029) ($ million)
- Chart on Scented - Year-over-year growth (2024-2029) (%)
- Data Table on Scented - Year-over-year growth (2024-2029) (%)
- 12.4 Unscented - Market size and forecast (2024-2029)
- Chart on Unscented - Market size and forecast (2024-2029) ($ million)
- Data Table on Unscented - Market size and forecast (2024-2029) ($ million)
- Chart on Unscented - Year-over-year growth (2024-2029) (%)
- Data Table on Unscented - Year-over-year growth (2024-2029) (%)
- 12.5 Market opportunity by Fragrance
- Market opportunity by Fragrance ($ million)
- Data Table on Market opportunity by Fragrance ($ million)
13 Market Segmentation by Category
- 13.1 Market segments
- Chart on Category - Market share (2024-2029) (%)
- Data Table on Category - Market share (2024-2029) (%)
- 13.2 Comparison by Category
- Chart on Comparison by Category
- Data Table on Comparison by Category
- 13.3 Mass - Market size and forecast (2024-2029)
- Chart on Mass - Market size and forecast (2024-2029) ($ million)
- Data Table on Mass - Market size and forecast (2024-2029) ($ million)
- Chart on Mass - Year-over-year growth (2024-2029) (%)
- Data Table on Mass - Year-over-year growth (2024-2029) (%)
- 13.4 Premium - Market size and forecast (2024-2029)
- Chart on Premium - Market size and forecast (2024-2029) ($ million)
- Data Table on Premium - Market size and forecast (2024-2029) ($ million)
- Chart on Premium - Year-over-year growth (2024-2029) (%)
- Data Table on Premium - Year-over-year growth (2024-2029) (%)
- 13.5 Luxury - Market size and forecast (2024-2029)
- Chart on Luxury - Market size and forecast (2024-2029) ($ million)
- Data Table on Luxury - Market size and forecast (2024-2029) ($ million)
- Chart on Luxury - Year-over-year growth (2024-2029) (%)
- Data Table on Luxury - Year-over-year growth (2024-2029) (%)
- 13.6 Handmade/Artisanal - Market size and forecast (2024-2029)
- Chart on Handmade/Artisanal - Market size and forecast (2024-2029) ($ million)
- Data Table on Handmade/Artisanal - Market size and forecast (2024-2029) ($ million)
- Chart on Handmade/Artisanal - Year-over-year growth (2024-2029) (%)
- Data Table on Handmade/Artisanal - Year-over-year growth (2024-2029) (%)
- 13.7 Market opportunity by Category
- Market opportunity by Category ($ million)
- Data Table on Market opportunity by Category ($ million)
14 Customer Landscape
- 14.1 Customer landscape overview
- Analysis of price sensitivity, lifecycle, customer purchase basket, adoption rates, and purchase criteria
15 Geographic Landscape
- 15.1 Geographic segmentation
- Chart on Market share by geography 2024-2029 (%)
- Data Table on Market share by geography 2024-2029 (%)
- 15.2 Geographic comparison
- Chart on Geographic comparison
- Data Table on Geographic comparison
- 15.3 North America - Market size and forecast 2024-2029
- Chart on North America - Market size and forecast 2024-2029 ($ million)
- Data Table on North America - Market size and forecast 2024-2029 ($ million)
- Chart on North America - Year-over-year growth 2024-2029 (%)
- Data Table on North America - Year-over-year growth 2024-2029 (%)
- 15.4 Europe - Market size and forecast 2024-2029
- Chart on Europe - Market size and forecast 2024-2029 ($ million)
- Data Table on Europe - Market size and forecast 2024-2029 ($ million)
- Chart on Europe - Year-over-year growth 2024-2029 (%)
- Data Table on Europe - Year-over-year growth 2024-2029 (%)
- 15.5 APAC - Market size and forecast 2024-2029
- Chart on APAC - Market size and forecast 2024-2029 ($ million)
- Data Table on APAC - Market size and forecast 2024-2029 ($ million)
- Chart on APAC - Year-over-year growth 2024-2029 (%)
- Data Table on APAC - Year-over-year growth 2024-2029 (%)
- 15.6 South America - Market size and forecast 2024-2029
- Chart on South America - Market size and forecast 2024-2029 ($ million)
- Data Table on South America - Market size and forecast 2024-2029 ($ million)
- Chart on South America - Year-over-year growth 2024-2029 (%)
- Data Table on South America - Year-over-year growth 2024-2029 (%)
- 15.7 Middle East and Africa - Market size and forecast 2024-2029
- Chart on Middle East and Africa - Market size and forecast 2024-2029 ($ million)
- Data Table on Middle East and Africa - Market size and forecast 2024-2029 ($ million)
- Chart on Middle East and Africa - Year-over-year growth 2024-2029 (%)
- Data Table on Middle East and Africa - Year-over-year growth 2024-2029 (%)
- 15.8 US - Market size and forecast 2024-2029
- Chart on US - Market size and forecast 2024-2029 ($ million)
- Data Table on US - Market size and forecast 2024-2029 ($ million)
- Chart on US - Year-over-year growth 2024-2029 (%)
- Data Table on US - Year-over-year growth 2024-2029 (%)
- 15.9 Germany - Market size and forecast 2024-2029
- Chart on Germany - Market size and forecast 2024-2029 ($ million)
- Data Table on Germany - Market size and forecast 2024-2029 ($ million)
- Chart on Germany - Year-over-year growth 2024-2029 (%)
- Data Table on Germany - Year-over-year growth 2024-2029 (%)
- 15.10 Canada - Market size and forecast 2024-2029
- Chart on Canada - Market size and forecast 2024-2029 ($ million)
- Data Table on Canada - Market size and forecast 2024-2029 ($ million)
- Chart on Canada - Year-over-year growth 2024-2029 (%)
- Data Table on Canada - Year-over-year growth 2024-2029 (%)
- 15.11 China - Market size and forecast 2024-2029
- Chart on China - Market size and forecast 2024-2029 ($ million)
- Data Table on China - Market size and forecast 2024-2029 ($ million)
- Chart on China - Year-over-year growth 2024-2029 (%)
- Data Table on China - Year-over-year growth 2024-2029 (%)
- 15.12 UK - Market size and forecast 2024-2029
- Chart on UK - Market size and forecast 2024-2029 ($ million)
- Data Table on UK - Market size and forecast 2024-2029 ($ million)
- Chart on UK - Year-over-year growth 2024-2029 (%)
- Data Table on UK - Year-over-year growth 2024-2029 (%)
- 15.13 Japan - Market size and forecast 2024-2029
- Chart on Japan - Market size and forecast 2024-2029 ($ million)
- Data Table on Japan - Market size and forecast 2024-2029 ($ million)
- Chart on Japan - Year-over-year growth 2024-2029 (%)
- Data Table on Japan - Year-over-year growth 2024-2029 (%)
- 15.14 France - Market size and forecast 2024-2029
- Chart on France - Market size and forecast 2024-2029 ($ million)
- Data Table on France - Market size and forecast 2024-2029 ($ million)
- Chart on France - Year-over-year growth 2024-2029 (%)
- Data Table on France - Year-over-year growth 2024-2029 (%)
- 15.15 India - Market size and forecast 2024-2029
- Chart on India - Market size and forecast 2024-2029 ($ million)
- Data Table on India - Market size and forecast 2024-2029 ($ million)
- Chart on India - Year-over-year growth 2024-2029 (%)
- Data Table on India - Year-over-year growth 2024-2029 (%)
- 15.16 Italy - Market size and forecast 2024-2029
- Chart on Italy - Market size and forecast 2024-2029 ($ million)
- Data Table on Italy - Market size and forecast 2024-2029 ($ million)
- Chart on Italy - Year-over-year growth 2024-2029 (%)
- Data Table on Italy - Year-over-year growth 2024-2029 (%)
- 15.17 South Korea - Market size and forecast 2024-2029
- Chart on South Korea - Market size and forecast 2024-2029 ($ million)
- Data Table on South Korea - Market size and forecast 2024-2029 ($ million)
- Chart on South Korea - Year-over-year growth 2024-2029 (%)
- Data Table on South Korea - Year-over-year growth 2024-2029 (%)
- 15.18 Market opportunity by geography
- Market opportunity by geography ($ million)
- Data Tables on Market opportunity by geography ($ million)
- 15.19 Brazil - Market size and forecast (2024-2029)
- Chart on Brazil - Market size and forecast (2024-2029) ($ million)
- Data Table on Brazil - Market size and forecast (2024-2029) ($ million)
- Chart on Brazil - Year-over-year growth (2024-2029) (%)
- Data Table on Brazil - Year-over-year growth (2024-2029) (%)
- 15.20 Egypt - Market size and forecast (2024-2029)
- Chart on Egypt - Market size and forecast (2024-2029) ($ million)
- Data Table on Egypt - Market size and forecast (2024-2029) ($ million)
- Chart on Egypt - Year-over-year growth (2024-2029) (%)
- Data Table on Egypt - Year-over-year growth (2024-2029) (%)
- 15.21 UAE - Market size and forecast (2024-2029)
- Chart on UAE - Market size and forecast (2024-2029) ($ million)
- Data Table on UAE - Market size and forecast (2024-2029) ($ million)
- Chart on UAE - Year-over-year growth (2024-2029) (%)
- Data Table on UAE - Year-over-year growth (2024-2029) (%)
- 15.22 Oman - Market size and forecast (2024-2029)
- Chart on Oman - Market size and forecast (2024-2029) ($ million)
- Data Table on Oman - Market size and forecast (2024-2029) ($ million)
- Chart on Oman - Year-over-year growth (2024-2029) (%)
- Data Table on Oman - Year-over-year growth (2024-2029) (%)
- 15.23 Argentina - Market size and forecast (2024-2029)
- Chart on Argentina - Market size and forecast (2024-2029) ($ million)
- Data Table on Argentina - Market size and forecast (2024-2029) ($ million)
- Chart on Argentina - Year-over-year growth (2024-2029) (%)
- Data Table on Argentina - Year-over-year growth (2024-2029) (%)
- 15.24 KSA - Market size and forecast (2024-2029)
- Chart on KSA - Market size and forecast (2024-2029) ($ million)
- Data Table on KSA - Market size and forecast (2024-2029) ($ million)
- Chart on KSA - Year-over-year growth (2024-2029) (%)
- Data Table on KSA - Year-over-year growth (2024-2029) (%)
- 15.25 Rest of World (ROW) - Market size and forecast (2024-2029)
- Chart on Rest of World (ROW) - Market size and forecast (2024-2029) ($ million)
- Data Table on Rest of World (ROW) - Market size and forecast (2024-2029) ($ million)
- Chart on Rest of World (ROW) - Year-over-year growth (2024-2029) (%)
- Data Table on Rest of World (ROW) - Year-over-year growth (2024-2029) (%)
16 Drivers, Challenges, and Opportunity/Restraints
- 16.3 Impact of drivers and challenges
- Impact of drivers and challenges in 2024 and 2029
- 16.4 Market opportunities/restraints
17 Competitive Landscape
- 17.2 Competitive Landscape
- Overview on criticality of inputs and factors of differentiation
- 17.3 Landscape disruption
- Overview on factors of disruption
- 17.4 Industry risks
- Impact of key risks on business
18 Competitive Analysis
- 18.2 Market positioning of companies
- Matrix on companies position and classification
- 18.3 Bath & Body Works, Inc. (L Brands)
- Bath & Body Works, Inc. (L Brands) - Overview
- Bath & Body Works, Inc. (L Brands) - Product / Service
- Bath & Body Works, Inc. (L Brands) - Key offerings
- 18.4 Candle-lite Company
- Candle-lite Company - Overview
- Candle-lite Company - Product / Service
- Candle-lite Company - Key offerings
- 18.5 Colonial Candle (MVP Group International)
- Colonial Candle (MVP Group International) - Overview
- Colonial Candle (MVP Group International) - Product / Service
- Colonial Candle (MVP Group International) - Key offerings
- 18.6 Diptyque Paris
- Diptyque Paris - Overview
- Diptyque Paris - Product / Service
- Diptyque Paris - Key offerings
- 18.7 Estée Lauder Companies Inc. (Jo Malone London, Byredo)
- Estée Lauder Companies Inc. (Jo Malone London, Byredo) - Overview
- Estée Lauder Companies Inc. (Jo Malone London, Byredo) - Product / Service
- Estée Lauder Companies Inc. (Jo Malone London, Byredo) - Key offerings
- 18.8 Evergreen Enterprises, Inc.
- Evergreen Enterprises, Inc. - Overview
- Evergreen Enterprises, Inc. - Product / Service
- Evergreen Enterprises, Inc. - Key offerings
- 18.9 Fos Lighting
- Fos Lighting - Overview
- Fos Lighting - Product / Service
- Fos Lighting - Key offerings
- 18.10 Innisfree (Amorepacific Corporation)
- Innisfree (Amorepacific Corporation) - Overview
- Innisfree (Amorepacific Corporation) - Product / Service
- Innisfree (Amorepacific Corporation) - Key offerings
- 18.11 Lalique Group SA
- Lalique Group SA - Overview
- Lalique Group SA - Product / Service
- Lalique Group SA - Key offerings
- 18.12 NEST New York
- NEST New York - Overview
- NEST New York - Product / Service
- NEST New York - Key offerings
- 18.13 Newell Brands (Yankee Candle, WoodWick, Chesapeake Bay Candle)
- Newell Brands (Yankee Candle, WoodWick, Chesapeake Bay Candle) - Overview
- Newell Brands (Yankee Candle, WoodWick, Chesapeake Bay Candle) - Product / Service
- Newell Brands (Yankee Candle, WoodWick, Chesapeake Bay Candle) - Key offerings
- 18.14 PartyLite (Luminex Home Decor & Fragrance Company)
- PartyLite (Luminex Home Decor & Fragrance Company) - Overview
- PartyLite (Luminex Home Decor & Fragrance Company) - Product / Service
- PartyLite (Luminex Home Decor & Fragrance Company) - Key offerings
- 18.15 Portmeirion Group PLC
- Portmeirion Group PLC - Overview
- Portmeirion Group PLC - Product / Service
- Portmeirion Group PLC - Key offerings
- 18.16 Price's Patent Candles Ltd.
- Price's Patent Candles Ltd. - Overview
- Price's Patent Candles Ltd. - Product / Service
- Price's Patent Candles Ltd. - Key offerings
- 18.17 S. C. Johnson & Son, Inc. (Glade)
- S. C. Johnson & Son, Inc. (Glade) - Overview
- S. C. Johnson & Son, Inc. (Glade) - Product / Service
- S. C. Johnson & Son, Inc. (Glade) - Key offerings
- 18.18 Thymes, LLC
- Thymes, LLC - Overview
- Thymes, LLC - Product / Service
- Thymes, LLC - Key offerings
- 18.19 Village Candle, Inc.
- Village Candle, Inc. - Overview
- Village Candle, Inc. - Product / Service
- Village Candle, Inc. - Key offerings
- 18.20 Voluspa
- Voluspa - Overview
- Voluspa - Product / Service
- Voluspa - Key offerings
- 18.21 Wax Lyrical Ltd.
- Wax Lyrical Ltd. - Overview
- Wax Lyrical Ltd. - Product / Service
- Wax Lyrical Ltd. - Key offerings
- 18.22 Zolucky
- Zolucky - Overview
- Zolucky - Product / Service
- Zolucky - Key offerings
- 18.23 Armadilla Wax Works Inc.
- Armadilla Wax Works Inc. - Overview
- Armadilla Wax Works Inc. - Product / Service
- Armadilla Wax Works Inc. - Key offerings
- 18.24 Bath and Body Works Direct Inc.
- Bath and Body Works Direct Inc. - Overview
- Bath and Body Works Direct Inc. - Product / Service
- Bath and Body Works Direct Inc. - Key offerings
- 18.25 Bolsius International BV
- Bolsius International BV - Overview
- Bolsius International BV - Product / Service
- Bolsius International BV - Key offerings
- 18.26 Colonial Candle
- Colonial Candle - Overview
- Colonial Candle - Product / Service
- Colonial Candle - Key offerings
- 18.27 Curio Brands LLC
- Curio Brands LLC - Overview
- Curio Brands LLC - Product / Service
- Curio Brands LLC - Key offerings
- 18.28 Dandong Everlight Candle Industry Co. Ltd.
- Dandong Everlight Candle Industry Co. Ltd. - Overview
- Dandong Everlight Candle Industry Co. Ltd. - Product / Service
- Dandong Everlight Candle Industry Co. Ltd. - Key offerings
- 18.29 Diannes Custom Candles
- Diannes Custom Candles - Overview
- Diannes Custom Candles - Product / Service
- Diannes Custom Candles - Key offerings
- 18.30 SC Johnson & Son
- SC Johnson & Son - Overview
- SC Johnson & Son - Product / Service
- SC Johnson & Son - Key offerings
- 18.31 Empire Candle Co. LLC
- Empire Candle Co. LLC - Overview
- Empire Candle Co. LLC - Product / Service
- Empire Candle Co. LLC - Key offerings
- 18.32 PartyLite
- PartyLite - Overview
- PartyLite - Product / Service
- PartyLite - Key offerings
- 18.33 NEST Fragrances
- NEST Fragrances - Overview
- NEST Fragrances - Product / Service
- NEST Fragrances - Key offerings
- 18.34 Newell Brands Inc.
- Newell Brands Inc. - Overview
- Newell Brands Inc. - Product / Service
- Newell Brands Inc. - Key offerings
- 18.35 Portmeirion Group Plc
- Portmeirion Group Plc - Overview
- Portmeirion Group Plc - Product / Service
- Portmeirion Group Plc - Key offerings
- 18.36 Reckitt Benckiser Group Plc
- Reckitt Benckiser Group Plc - Overview
- Reckitt Benckiser Group Plc - Product / Service
- Reckitt Benckiser Group Plc - Key offerings
- 18.37 Stonewall Kitchen LLC
- Stonewall Kitchen LLC - Overview
- Stonewall Kitchen LLC - Product / Service
- Stonewall Kitchen LLC - Key offerings
- 18.38 The Bridgewater Candle Co.
- The Bridgewater Candle Co. - Overview
- The Bridgewater Candle Co. - Product / Service
- The Bridgewater Candle Co. - Key offerings
- 18.39 The Estee Lauder Co. Inc.
- The Estee Lauder Co. Inc. - Overview
- The Estee Lauder Co. Inc. - Product / Service
- The Estee Lauder Co. Inc. - Key offerings
- 18.40 The White Company UK Ltd.
- The White Company UK Ltd. - Overview
- The White Company UK Ltd. - Product / Service
- The White Company UK Ltd. - Key offerings
- 18.41 The Yankee Candle Co. Inc.
- The Yankee Candle Co. Inc. - Overview
- The Yankee Candle Co. Inc. - Product / Service
- The Yankee Candle Co. Inc. - Key offerings
- 18.42 Universal Candle Co. Ltd.
- Universal Candle Co. Ltd. - Overview
- Universal Candle Co. Ltd. - Product / Service
- Universal Candle Co. Ltd. - Key offerings
19 Appendix
- 19.2 Inclusions and exclusions checklist
- Inclusions checklist
- Exclusions checklist
- 19.3 Currency conversion rates for US$
- Currency conversion rates for US$
- 19.4 Research methodology
- 19.7 Validation techniques employed for market sizing
- Validation techniques employed for market sizing
- 19.9 360 degree market analysis
- 360 degree market analysis
- 19.10 List of abbreviations