Candy Market Analysis APAC, North America, Europe, South America, Middle East and Africa - China, US, Japan, India, Germany - Size and Forecast 2024-2028

Candy Market Analysis APAC, North America, Europe, South America, Middle East and Africa - China, US, Japan, India, Germany - Size and Forecast 2024-2028

Published: Aug 2024 167 Pages SKU: IRTNTR71965

Market Overview at a Glance

$57.1 B
Market Opportunity
4.36%
CAGR
4.13
YoY growth 2023-2024(%)

Candy Market Size 2024-2028

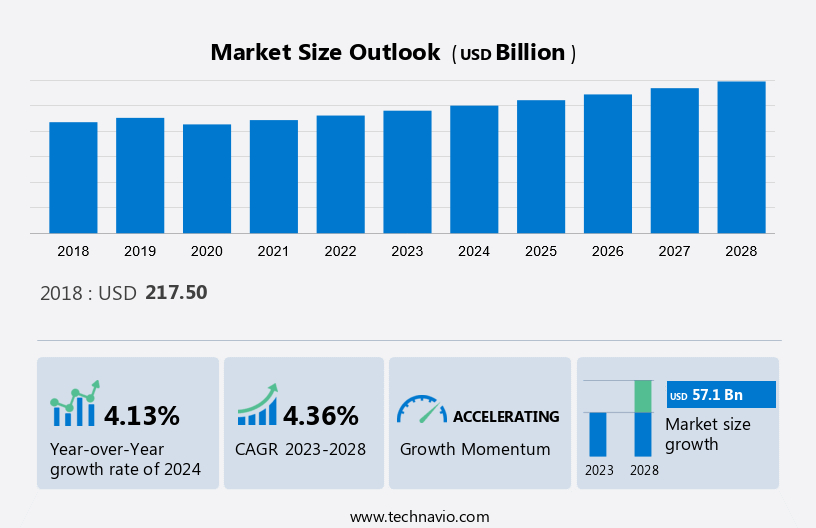
The candy market is estimated to increase by USD 57.1 billion and is forecast to grow at a CAGR of 4.36% between 2023 and 2028. The market is experiencing significant growth, driven by increasing marketing activities and packaging innovations in confectionery. These strategies are effectively engaging consumers and driving sales. However, trends in the market are not without challenges. Growing health concerns related to diabetes and obesity are leading to a shift towards healthier candy options. Manufacturers are responding by introducing sugar-free, low-calorie, and organic candy products. Additionally, there is a rising demand for functional candies with added vitamins and minerals. These trends are shaping the market, offering opportunities for innovation and growth while addressing consumer health concerns. The candy market is evolving with a growing demand for healthier candies, including organic, premium, and vegan options. Sugar substitutes are becoming popular, catering to consumers seeking candy for special diets. Seasonal candy offerings are expanding, and e-commerce candy sales are surging, with candy subscription boxes gaining traction. Consumers are increasingly drawn to sustainably sourced candy, reflecting a broader shift towards more responsible and health-conscious candy choices.

What will be the size of the Market During the Forecast Period?

Candy Market Size

To learn more about this report, Download Report Sample

What is the Fastest-Growing Segment in the Market?

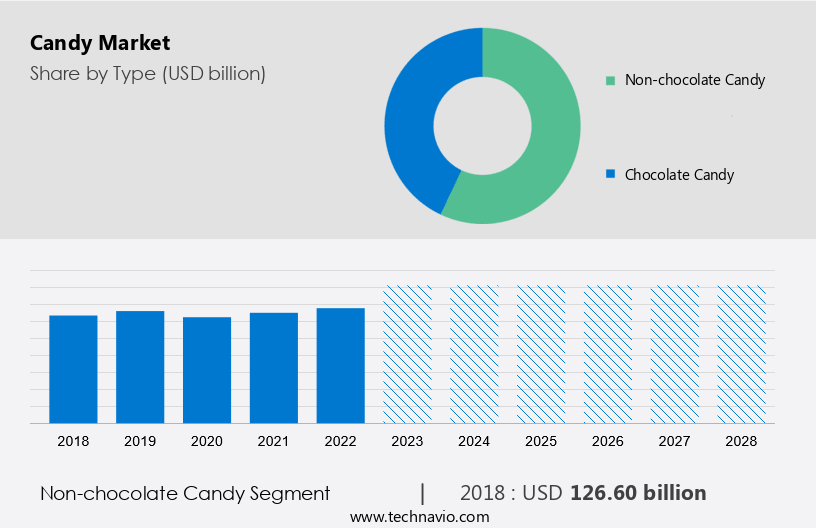
The market share of the non-chocolate segment will be significant during the forecast period. Due to rising health consciousness and the demand for non/low-sugar chocolates/confectionery items, non-chocolate variant has gained commercial traction in recent years. The main reason for the rise in demand for non-chocolate confectionery among the general public is an increase in the number of people experiencing a rush of sugar after eating chocolates with high sugar content.

Candy Market Size

Get a glance at the market contribution of various segments Request a PDF Sample

The non-chocolate segment was valued at USD 126.60 billion in 2018 and continued to grow until 2022.  People of all ages, genders, and socioeconomic levels enjoy non-chocolate candy. This adaptability opens up a wide range of opportunities for non-chocolate product makers to reach a larger audience. The rising population of emerging countries has resulted in a higher demand for non-chocolate candies, which is fueled by increased customer purchasing behavior. This, in turn, will lead to the growth of the non-chocolate segment of the market during the forecast period.

Which are the Key Regions for the Market?

Candy Market Share by Geography

For more insights on the market share of various regions Request PDF Sample now!

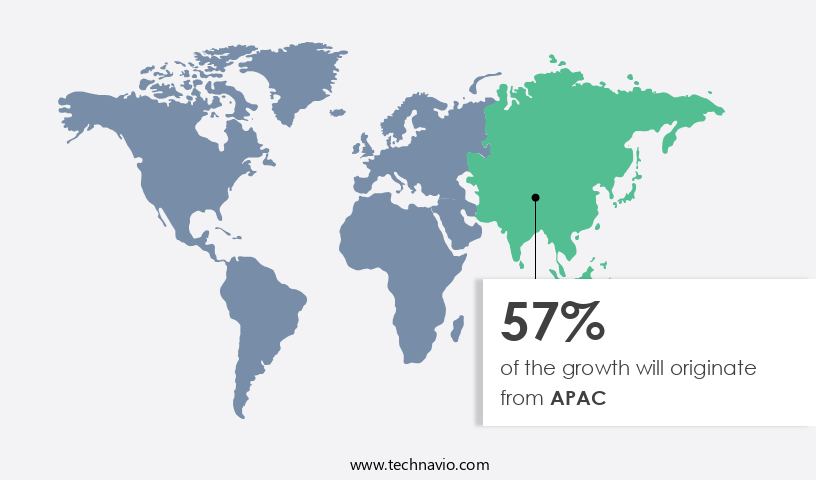
APAC is estimated to contribute 57% to the global market during the forecast period. Technavio's analysts have elaborately explained the regional trends and drivers that shape the market during the forecast period. The global market is expected to have a steady growth rate during the forecast period. The increase in population and rising urbanization across APAC have led to an increase in demand for various food products, such as confectioneries and candy. The market in countries such as India, China, Japan, and Thailand is expected to witness significant growth owing to the increase in demand from customers. Among APAC countries, an increase in health concerns among people in Japan has led to an increase in the consumption of chocolate-based candies that are made from cocoa, which has a balance of nutrients such as magnesium, calcium, and iron that help prevent cancer, obesity, and other health problems. During the forecast period, such factors are likely to fuel the growth of the market.

Market Dynamics

The market is a vibrant and exciting industry that encompasses a wide range of confectionery products, with a significant focus on candies. This market includes various categories such as Chocolate candy, Nonchocolate candy, Sugarfree candies, Dark chocolate, Organic food products, Vegan products, GMOfree products, and Kosher food colors. Sweeteners like Sugar and alternative options are also essential components of the market. The market caters to diverse consumer preferences, with Cleanlabeled products gaining popularity among children and youth. Chocolate candies, including Chocolate candy bars, are a major segment, while Nonchocolate candies, such as Hardboiled candies, Pastilles, Gums, Jellies and chews, Toffees, Caramels and nougat, also hold a substantial share. The market is expected to grow, driven by increasing demand for innovative and healthier candy options. Sugar, Sugar confectionery, Chewing gum, and Sugar candy are key ingredients in the production of these delightful treats. 

Our researchers analyzed the data with 2023 as the base year, along with the key drivers, trends, and challenges. A holistic analysis of drivers will help companies refine their marketing strategies to gain a competitive advantage.

Key Market Driver

The surge in consumer purchasing power is a key driver propelling the growth of the market. This growth is further fueled by the continued expansion of the market and the increasing disposable income of consumers, creating ample opportunities for industry players. Candies, widely enjoyed by both children and young adults, are influenced by consumer preferences, population growth, and evolving inclinations. Notably, major market players stand to capitalize on revenue opportunities by offering candies with reduced sugar additives and enriched with valuable ingredients, nutrients, and minerals. Additionally, the burgeoning of emerging markets presents favorable prospects for market expansion and growth rates in the foreseeable future.

Significant Market Trend

Increasing online sales is the key trend in the market. Online shopping offers ease, convenience, and accessibility to a wider variety of products. As more companies use online platforms to reach consumers, this has created a growing market for online sales. The practice of explicitly revealing a product's ingredients, known as "clean labeling," is another development that is having an impact on the worldwide confectionery market. The demand for products created with natural components is rising, as opposed to those with artificial preservatives, colors, and tastes. They desire a more natural and healthy diet.

Candy producers and brands are investing in R&D to produce fresh, cutting-edge clean-labeled products or utilizing e-commerce platforms to reach a wider audience of consumers. This is expected to be a trend that will drive the growth of the market in focus during the forecast period.

Major Market Challenge

An increase in the number of product recalls is the major challenge impeding market growth. Candy producers are quite concerned about product recalls as they can harm their reputation, diminish consumer trust, and cause them to lose money. One of the key reasons for the increase in product recalls is the rising concern over food safety. As consumers grow more health conscious and aware of the contents in their food, they are expecting greater transparency and safety in the items they purchase. As a result, regulations are more stringent nowadays, and producers are required to meet greater requirements for the reliability and security of their goods.

The globalization of the industry, which has increased the use of intricate supply chains and the use of raw materials from a variety of sources, is another factor contributing to the rise in product recalls. Because of this, it is now harder for manufacturers to keep an eye on and regulate the quality of their goods, which increases the risk of product contamination and recall. This is expected to hinder the growth of the market in focus during the forecast period.

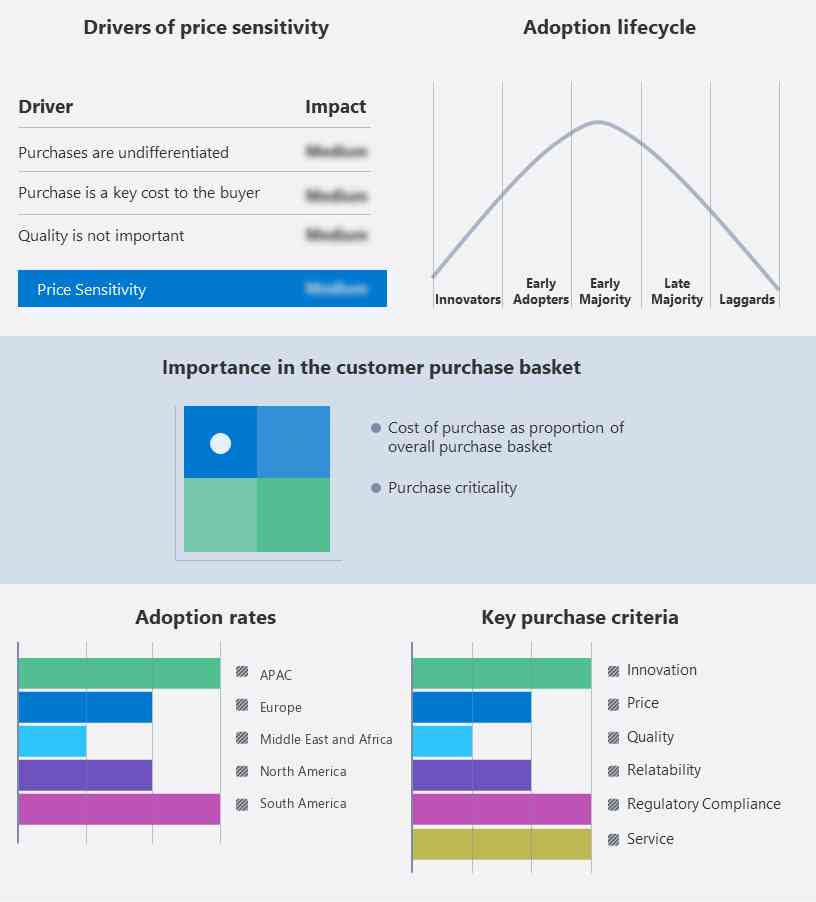
Key Market Customer Landscape

The report includes the adoption lifecycle of the market, covering from the innovator's stage to the laggard's stage. It focuses on adoption rates in different regions based on penetration. Furthermore, the report also includes key purchase criteria and drivers of price sensitivity to help companies evaluate and develop their growth strategies.

Candy Market Share by Geography

Market Customer Landscape

Who are the Major Market companies?

companies are implementing various strategies, such as strategic alliances, partnerships, mergers and acquisitions, geographical expansion, and product/service launches, to enhance their presence in the market.

Sweet Candy Co. Inc. - The company is involved in the production of salt water taffy, candy bears, fruit sours, chocolate sticks and various other gift items. The company offers gourmet dark chocolate candies, milk chocolates and white chocolates, and luxury candy gifts.

The report also includes detailed analyses of the competitive landscape of the market and information about 15 market companies, including:

  • General Mills Inc.
  • HARIBO GmbH and Co. KG
  • Jelly Belly Candy Co.
  • Kellogg Co
  • Mars Inc.
  • Meiji Holdings Co. Ltd.
  • Nestle SA
  • Palmer Candy Co.
  • Perfetti Van Melle Group BV
  • pladis Foods Ltd.
  • Quality Candy Co.
  • SUGARFINA USA LLC
  • The Bang Candy Co.
  • The Hershey Co.
  • Mondelez International Inc.

Qualitative and quantitative analysis of companies has been conducted to help clients understand the wider business environment as well as the strengths and weaknesses of key market players. Data is qualitatively analyzed to categorize companies as pure play, category-focused, industry-focused, and diversified; it is quantitatively analyzed to categorize companies as dominant, leading, strong, tentative, and weak.

Segment Overview

The market research report provides comprehensive data (region wise segment analysis), with forecasts and estimates in "USD Billion" for the period 2024 to 2028, as well as historical data from 2018 to 2022 for the following segments

  • Type Outlook
    • Non-chocolate candy
    • Chocolate candy
  • Distribution Channel Outlook 
    • Offline
    • Online
  • Region Outlook 
    • APAC
      • China
      • India
    • North America
      • The U.S.
      • Canada
    • Europe
      • The U.K.
      • Germany
      • France
      • Rest of Europe
    • South America
      • Brazil
      • Argentina
    • Middle East & Africa
      • Saudi Arabia
      • South Africa
      • Rest of the Middle East & Africa

Market Analyst Overview

The confectionery industry, a delightful world of Candy, Chocolate candy, Nonchocolate candy, Sugarfree candies, and more, is a thriving business. From Dark chocolate and Organic food products to Vegan products, the market caters to various consumer preferences. Key segments include Chocolate candy bars, Hardboiled candies, Pastilles, Gums, Jellies and chews, Toffees, Caramels and nougat, Mints, meats and more. Flavors like Raw mango, Tamarind, Strawberry, and Chocolate are popular choices. The Market is driven by Impulsive purchase behavior and the wide availability of these treats in Supermarkets and Hypermarkets, Convenience Stores, Specialist Retailers, and Online Retail.

However, health concerns such as Diabetes, Obesity, Chronic depression, Bronchitis, and Blood circulation issues pose challenges. Sweeteners play a crucial role in candy production. Cleanlabeled products, using natural sweeteners, are gaining popularity. Kosher food colors are also preferred by consumers. The candy market is seeing a shift towards healthier candies, with a focus on organic, premium, and vegan candy options. Sugar substitutes are being incorporated to cater to special diet needs. Seasonal candy is also growing in popularity, alongside a rise in e-commerce candy sales. Candy subscription boxes are becoming a preferred choice for many, while sustainably sourced candy aligns with the growing demand for environmentally conscious and health-focused products.

Market Scope

Report Coverage

Details

Page number

167

Base year

2023

Historic period

2018 - 2022

Forecast period

2024-2028

Growth momentum & CAGR

Accelerate at a CAGR of 4.36%

Market growth 2024-2028

USD 57.1 billion

Market structure

Fragmented

YoY growth 2023-2024(%)

4.13

Regional analysis

APAC, North America, Europe, South America, and Middle East and Africa

Performing market contribution

APAC at 57%

Key countries

China, US, Japan, India, and Germany

Competitive landscape

Leading Companies, Market Positioning of Companies, Competitive Strategies, and Industry Risks

Key companies profiled

Arcor Group, AUGUST STORCK KG, Cloetta AB, Ferrero International S.A., General Mills Inc., HARIBO GmbH and Co. KG, Jelly Belly Candy Co., Kellogg Co., Mars Inc., Meiji Holdings Co. Ltd., Mondelez International Inc., Nestle SA, Palmer Candy Co., Perfetti Van Melle Group BV, pladis Foods Ltd., Quality Candy Co., SUGARFINA USA LLC, Sweet Candy Co. Inc., The Bang Candy Co., and The Hershey Co.

Market dynamics

Parent market analysis, market research report, market forecasting, market forecast, Market growth inducers and obstacles, Fast-growing and slow-growing segment analysis, Market growth and Forecasting, COVID 19 impact and recovery analysis and future consumer dynamics, Market condition analysis for forecast period

Customization purview

If our report has not included the data that you are looking for, you can reach out to our analysts and get segments customized.

Request PDF sample

What are the Key Data Covered in this Market Report?

  • CAGR of the market during the forecast period
  • Detailed information on factors that will drive the market growth and forecasting of the market between 2023 and 2028.
  • Precise estimation of the size of the market size and its contribution to the parent market
  • Accurate predictions about upcoming market trends and analysis and changes in consumer behavior
  • Growth of the market industry across Europe, North America, APAC, South America, and Middle East and Africa
  • Thorough market growth analysis of the market's competitive landscape and detailed information about companies
  • Comprehensive market analysis and report on the factors that will challenge the market research and growth of market companies

We can help! Our analysts can customize this report to meet your requirements. Get in touch

1 Executive Summary

  • 1.1 Market overview
    • Executive Summary - Chart on Market Overview
    • Executive Summary - Data Table on Market Overview
    • Executive Summary - Chart on Global Market Characteristics
    • Executive Summary - Chart on Market by Geography
    • Executive Summary - Chart on Market Segmentation by Type
    • Executive Summary - Chart on Market Segmentation by Distribution Channel
    • Executive Summary - Chart on Incremental Growth
    • Executive Summary - Data Table on Incremental Growth
    • Executive Summary - Chart on Company Market Positioning

2 Market Landscape

  • 2.1 Market ecosystem
    • Parent Market
    • Data Table on - Parent Market
  • 2.2 Market characteristics
    • Market characteristics analysis
  • 2.3 Value chain analysis
    • Value Chain Analysis

3 Market Sizing

  • 3.1 Market definition
    • Offerings of companies included in the market definition
  • 3.2 Market segment analysis
    • Market segments
  • 3.3 Market size 2023
    • 3.4 Market outlook: Forecast for 2023-2028
      • Chart on Global - Market size and forecast 2023-2028 ($ billion)
      • Data Table on Global - Market size and forecast 2023-2028 ($ billion)
      • Chart on Global Market: Year-over-year growth 2023-2028 (%)
      • Data Table on Global Market: Year-over-year growth 2023-2028 (%)

    4 Historic Market Size

    • 4.1 Global Candy Market 2018 - 2022
      • Historic Market Size - Data Table on Global Candy Market 2018 - 2022 ($ billion)
    • 4.2 Type segment analysis 2018 - 2022
      • Historic Market Size - Type Segment 2018 - 2022 ($ billion)
    • 4.3 Distribution Channel segment analysis 2018 - 2022
      • Historic Market Size - Distribution Channel Segment 2018 - 2022 ($ billion)
    • 4.4 Geography segment analysis 2018 - 2022
      • Historic Market Size - Geography Segment 2018 - 2022 ($ billion)
    • 4.5 Country segment analysis 2018 - 2022
      • Historic Market Size - Country Segment 2018 - 2022 ($ billion)

    5 Five Forces Analysis

    • 5.1 Five forces summary
      • Five forces analysis - Comparison between 2023 and 2028
    • 5.2 Bargaining power of buyers
      • Bargaining power of buyers - Impact of key factors 2023 and 2028
    • 5.3 Bargaining power of suppliers
      • Bargaining power of suppliers - Impact of key factors in 2023 and 2028
    • 5.4 Threat of new entrants
      • Threat of new entrants - Impact of key factors in 2023 and 2028
    • 5.5 Threat of substitutes
      • Threat of substitutes - Impact of key factors in 2023 and 2028
    • 5.6 Threat of rivalry
      • Threat of rivalry - Impact of key factors in 2023 and 2028
    • 5.7 Market condition
      • Chart on Market condition - Five forces 2023 and 2028

    6 Market Segmentation by Type

    • 6.1 Market segments
      • Chart on Type - Market share 2023-2028 (%)
      • Data Table on Type - Market share 2023-2028 (%)
    • 6.2 Comparison by Type
      • Chart on Comparison by Type
      • Data Table on Comparison by Type
    • 6.3 Non-chocolate candy - Market size and forecast 2023-2028
      • Chart on Non-chocolate candy - Market size and forecast 2023-2028 ($ billion)
      • Data Table on Non-chocolate candy - Market size and forecast 2023-2028 ($ billion)
      • Chart on Non-chocolate candy - Year-over-year growth 2023-2028 (%)
      • Data Table on Non-chocolate candy - Year-over-year growth 2023-2028 (%)
    • 6.4 Chocolate candy - Market size and forecast 2023-2028
      • Chart on Chocolate candy - Market size and forecast 2023-2028 ($ billion)
      • Data Table on Chocolate candy - Market size and forecast 2023-2028 ($ billion)
      • Chart on Chocolate candy - Year-over-year growth 2023-2028 (%)
      • Data Table on Chocolate candy - Year-over-year growth 2023-2028 (%)
    • 6.5 Market opportunity by Type
      • Market opportunity by Type ($ billion)
      • Data Table on Market opportunity by Type ($ billion)

    7 Market Segmentation by Distribution Channel

    • 7.1 Market segments
      • Chart on Distribution Channel - Market share 2023-2028 (%)
      • Data Table on Distribution Channel - Market share 2023-2028 (%)
    • 7.2 Comparison by Distribution Channel
      • Chart on Comparison by Distribution Channel
      • Data Table on Comparison by Distribution Channel
    • 7.3 Offline - Market size and forecast 2023-2028
      • Chart on Offline - Market size and forecast 2023-2028 ($ billion)
      • Data Table on Offline - Market size and forecast 2023-2028 ($ billion)
      • Chart on Offline - Year-over-year growth 2023-2028 (%)
      • Data Table on Offline - Year-over-year growth 2023-2028 (%)
    • 7.4 Online - Market size and forecast 2023-2028
      • Chart on Online - Market size and forecast 2023-2028 ($ billion)
      • Data Table on Online - Market size and forecast 2023-2028 ($ billion)
      • Chart on Online - Year-over-year growth 2023-2028 (%)
      • Data Table on Online - Year-over-year growth 2023-2028 (%)
    • 7.5 Market opportunity by Distribution Channel
      • Market opportunity by Distribution Channel ($ billion)
      • Data Table on Market opportunity by Distribution Channel ($ billion)

    8 Customer Landscape

    • 8.1 Customer landscape overview
      • Analysis of price sensitivity, lifecycle, customer purchase basket, adoption rates, and purchase criteria

    9 Geographic Landscape

    • 9.1 Geographic segmentation
      • Chart on Market share by geography 2023-2028 (%)
      • Data Table on Market share by geography 2023-2028 (%)
    • 9.2 Geographic comparison
      • Chart on Geographic comparison
      • Data Table on Geographic comparison
    • 9.3 APAC - Market size and forecast 2023-2028
      • Chart on APAC - Market size and forecast 2023-2028 ($ billion)
      • Data Table on APAC - Market size and forecast 2023-2028 ($ billion)
      • Chart on APAC - Year-over-year growth 2023-2028 (%)
      • Data Table on APAC - Year-over-year growth 2023-2028 (%)
    • 9.4 North America - Market size and forecast 2023-2028
      • Chart on North America - Market size and forecast 2023-2028 ($ billion)
      • Data Table on North America - Market size and forecast 2023-2028 ($ billion)
      • Chart on North America - Year-over-year growth 2023-2028 (%)
      • Data Table on North America - Year-over-year growth 2023-2028 (%)
    • 9.5 Europe - Market size and forecast 2023-2028
      • Chart on Europe - Market size and forecast 2023-2028 ($ billion)
      • Data Table on Europe - Market size and forecast 2023-2028 ($ billion)
      • Chart on Europe - Year-over-year growth 2023-2028 (%)
      • Data Table on Europe - Year-over-year growth 2023-2028 (%)
    • 9.6 South America - Market size and forecast 2023-2028
      • Chart on South America - Market size and forecast 2023-2028 ($ billion)
      • Data Table on South America - Market size and forecast 2023-2028 ($ billion)
      • Chart on South America - Year-over-year growth 2023-2028 (%)
      • Data Table on South America - Year-over-year growth 2023-2028 (%)
    • 9.7 Middle East and Africa - Market size and forecast 2023-2028
      • Chart on Middle East and Africa - Market size and forecast 2023-2028 ($ billion)
      • Data Table on Middle East and Africa - Market size and forecast 2023-2028 ($ billion)
      • Chart on Middle East and Africa - Year-over-year growth 2023-2028 (%)
      • Data Table on Middle East and Africa - Year-over-year growth 2023-2028 (%)
    • 9.8 China - Market size and forecast 2023-2028
      • Chart on China - Market size and forecast 2023-2028 ($ billion)
      • Data Table on China - Market size and forecast 2023-2028 ($ billion)
      • Chart on China - Year-over-year growth 2023-2028 (%)
      • Data Table on China - Year-over-year growth 2023-2028 (%)
    • 9.9 US - Market size and forecast 2023-2028
      • Chart on US - Market size and forecast 2023-2028 ($ billion)
      • Data Table on US - Market size and forecast 2023-2028 ($ billion)
      • Chart on US - Year-over-year growth 2023-2028 (%)
      • Data Table on US - Year-over-year growth 2023-2028 (%)
    • 9.10 Japan - Market size and forecast 2023-2028
      • Chart on Japan - Market size and forecast 2023-2028 ($ billion)
      • Data Table on Japan - Market size and forecast 2023-2028 ($ billion)
      • Chart on Japan - Year-over-year growth 2023-2028 (%)
      • Data Table on Japan - Year-over-year growth 2023-2028 (%)
    • 9.11 India - Market size and forecast 2023-2028
      • Chart on India - Market size and forecast 2023-2028 ($ billion)
      • Data Table on India - Market size and forecast 2023-2028 ($ billion)
      • Chart on India - Year-over-year growth 2023-2028 (%)
      • Data Table on India - Year-over-year growth 2023-2028 (%)
    • 9.12 Germany - Market size and forecast 2023-2028
      • Chart on Germany - Market size and forecast 2023-2028 ($ billion)
      • Data Table on Germany - Market size and forecast 2023-2028 ($ billion)
      • Chart on Germany - Year-over-year growth 2023-2028 (%)
      • Data Table on Germany - Year-over-year growth 2023-2028 (%)
    • 9.13 Market opportunity by geography
      • Market opportunity by geography ($ billion)
      • Data Tables on Market opportunity by geography ($ billion)

    10 Drivers, Challenges, and Opportunity/Restraints

    • 10.1 Market drivers
      • 10.2 Market challenges
        • 10.3 Impact of drivers and challenges
          • Impact of drivers and challenges in 2023 and 2028
        • 10.4 Market opportunities/restraints

          11 Competitive Landscape

          • 11.1 Overview
            • 11.2 Competitive Landscape
              • Overview on criticality of inputs and factors of differentiation
            • 11.3 Landscape disruption
              • Overview on factors of disruption
            • 11.4 Industry risks
              • Impact of key risks on business

            12 Competitive Analysis

            • 12.1 Companies profiled
              • Companies covered
            • 12.2 Market positioning of companies
              • Matrix on companies position and classification
            • 12.3 Arcor Group
              • Arcor Group - Overview
              • Arcor Group - Business segments
              • Arcor Group - Key offerings
              • Arcor Group - Segment focus
            • 12.4 Cloetta AB
              • Cloetta AB - Overview
              • Cloetta AB - Business segments
              • Cloetta AB - Key offerings
              • Cloetta AB - Segment focus
            • 12.5 Ferrero International S.A.
              • Ferrero International S.A. - Overview
              • Ferrero International S.A. - Product / Service
              • Ferrero International S.A. - Key news
              • Ferrero International S.A. - Key offerings
            • 12.6 HARIBO GmbH and Co. KG
              • HARIBO GmbH and Co. KG - Overview
              • HARIBO GmbH and Co. KG - Product / Service
              • HARIBO GmbH and Co. KG - Key offerings
            • 12.7 Mars Inc.
              • Mars Inc. - Overview
              • Mars Inc. - Product / Service
              • Mars Inc. - Key news
              • Mars Inc. - Key offerings
            • 12.8 Meiji Holdings Co. Ltd.
              • Meiji Holdings Co. Ltd. - Overview
              • Meiji Holdings Co. Ltd. - Business segments
              • Meiji Holdings Co. Ltd. - Key news
              • Meiji Holdings Co. Ltd. - Key offerings
              • Meiji Holdings Co. Ltd. - Segment focus
            • 12.9 Mondelez International Inc.
              • Mondelez International Inc. - Overview
              • Mondelez International Inc. - Business segments
              • Mondelez International Inc. - Key news
              • Mondelez International Inc. - Key offerings
              • Mondelez International Inc. - Segment focus
            • 12.10 Nestle SA
              • Nestle SA - Overview
              • Nestle SA - Business segments
              • Nestle SA - Key news
              • Nestle SA - Key offerings
              • Nestle SA - Segment focus
            • 12.11 Palmer Candy Co.
              • Palmer Candy Co. - Overview
              • Palmer Candy Co. - Product / Service
              • Palmer Candy Co. - Key offerings
            • 12.12 Perfetti Van Melle Group BV
              • Perfetti Van Melle Group BV - Overview
              • Perfetti Van Melle Group BV - Product / Service
              • Perfetti Van Melle Group BV - Key offerings
            • 12.13 Quality Candy Co.
              • Quality Candy Co. - Overview
              • Quality Candy Co. - Product / Service
              • Quality Candy Co. - Key offerings
            • 12.14 SUGARFINA USA LLC
              • SUGARFINA USA LLC - Overview
              • SUGARFINA USA LLC - Product / Service
              • SUGARFINA USA LLC - Key offerings
            • 12.15 Sweet Candy Co. Inc.
              • Sweet Candy Co. Inc. - Overview
              • Sweet Candy Co. Inc. - Product / Service
              • Sweet Candy Co. Inc. - Key offerings
            • 12.16 The Bang Candy Co.
              • The Bang Candy Co. - Overview
              • The Bang Candy Co. - Product / Service
              • The Bang Candy Co. - Key offerings
            • 12.17 The Hershey Co.
              • The Hershey Co. - Overview
              • The Hershey Co. - Business segments
              • The Hershey Co. - Key news
              • The Hershey Co. - Key offerings
              • The Hershey Co. - Segment focus

            13 Appendix

            • 13.1 Scope of the report
              • 13.2 Inclusions and exclusions checklist
                • Inclusions checklist
                • Exclusions checklist
              • 13.3 Currency conversion rates for US$
                • Currency conversion rates for US$
              • 13.4 Research methodology
                • Research methodology
              • 13.5 Data procurement
                • Information sources
              • 13.6 Data validation
                • Data validation
              • 13.7 Validation techniques employed for market sizing
                • Validation techniques employed for market sizing
              • 13.8 Data synthesis
                • Data synthesis
              • 13.9 360 degree market analysis
                • 360 degree market analysis
              • 13.10 List of abbreviations
                • List of abbreviations

              Research Methodology

              Technavio presents a detailed picture of the market by way of study, synthesis, and summation of data from multiple sources. The analysts have presented the various facets of the market with a particular focus on identifying the key industry influencers. The data thus presented is comprehensive, reliable, and the result of extensive research, both primary and secondary.

              INFORMATION SOURCES

              Primary sources

              • Manufacturers and suppliers
              • Channel partners
              • Industry experts
              • Strategic decision makers

              Secondary sources

              • Industry journals and periodicals
              • Government data
              • Financial reports of key industry players
              • Historical data
              • Press releases

              DATA ANALYSIS

              Data Synthesis

              • Collation of data
              • Estimation of key figures
              • Analysis of derived insights

              Data Validation

              • Triangulation with data models
              • Reference against proprietary databases
              • Corroboration with industry experts

              REPORT WRITING

              Qualitative

              • Market drivers
              • Market challenges
              • Market trends
              • Five forces analysis

              Quantitative

              • Market size and forecast
              • Market segmentation
              • Geographical insights
              • Competitive landscape

              Interested in this report?

              Get your sample now to see our research methodology and insights!

              Download Now

              Frequently Asked Questions

              Candy market growth will increase by $ 57.1 bn during 2024-2028 .

              The Candy market is expected to grow at a CAGR of 4.36% during 2024-2028 .

              Candy market is segmented by Type( Non-chocolate candy, Chocolate candy) Distribution Channel( Offline, Online, Europe, South America, MEA)

              Arcor Group, AUGUST STORCK KG, Cloetta AB, Ferrero International S.A., General Mills Inc., HARIBO GmbH and Co. KG, Jelly Belly Candy Co., Kellogg Co., Mars Inc., Meiji Holdings Co. Ltd., Mondelez International Inc., Nestle SA, Palmer Candy Co., Perfetti Van Melle Group BV, pladis Foods Ltd., Quality Candy Co., SUGARFINA USA LLC, Sweet Candy Co. Inc., The Bang Candy Co., The Hershey Co. are a few of the key vendors in the Candy market.

              APAC will register the highest growth rate of 57% among the other regions. Therefore, the Candy market in APAC is expected to garner significant business opportunities for the vendors during the forecast period.

              China, US, Japan, India, Germany

              • Increasing marketing activitiesThe global candy market is expected to grow significantly in the coming years is the driving factor this market.
              • driven by various factors such as increasing consumer indulgence is the driving factor this market.
              • changing lifestyles is the driving factor this market.
              • and growing demand for confectionery products. One key driver of this growth is the increasing marketing activities by major players in the industry. Manufacturers are focusing on innovative packaging is the driving factor this market.
              • effective marketing strategies is the driving factor this market.
              • and expanding their product portfolios to cater to evolving consumer preferences. The rising popularity of premium and gourmet candies is the driving factor this market.
              • as well as the growing demand for organic and natural ingredients is the driving factor this market.
              • are also contributing to the markets expansion. Additionally is the driving factor this market.
              • the increasing availability of candies through various distribution channels is the driving factor this market.
              • including supermarkets is the driving factor this market.
              • convenience stores is the driving factor this market.
              • and e-commerce platforms is the driving factor this market.
              • is making it easier for consumers to access these products. Consequently is the driving factor this market.
              • the global candy market size is expected to experience substantial growth during the forecast period. is the driving factor this market.

              The Candy market vendors should focus on grabbing business opportunities from the Non-chocolate candy segment as it accounted for the largest market share in the base year.