Carbotanium Market Analysis, Size, and Forecast 2026-2030: APAC (China, Japan, and India), North America (US, Canada, and Mexico), Europe (Germany, UK, and Italy), Middle East and Africa (Saudi Arabia, UAE, and South Africa), South America (Brazil, Argentina, and Colombia), and Rest of World (ROW)

Carbotanium Market Analysis, Size, and Forecast 2026-2030:
APAC (China, Japan, and India), North America (US, Canada, and Mexico), Europe (Germany, UK, and Italy), Middle East and Africa (Saudi Arabia, UAE, and South Africa), South America (Brazil, Argentina, and Colombia), and Rest of World (ROW)

Published: Dec 2025 296 Pages SKU: IRTNTR81188

Market Overview at a Glance

$49.91 Mn
Market Opportunity
18.6%
CAGR 2025 - 2030
43.2%
APAC Growth
$14.51 Mn
Carbotanium A segment 2024

Carbotanium Market Size 2026-2030

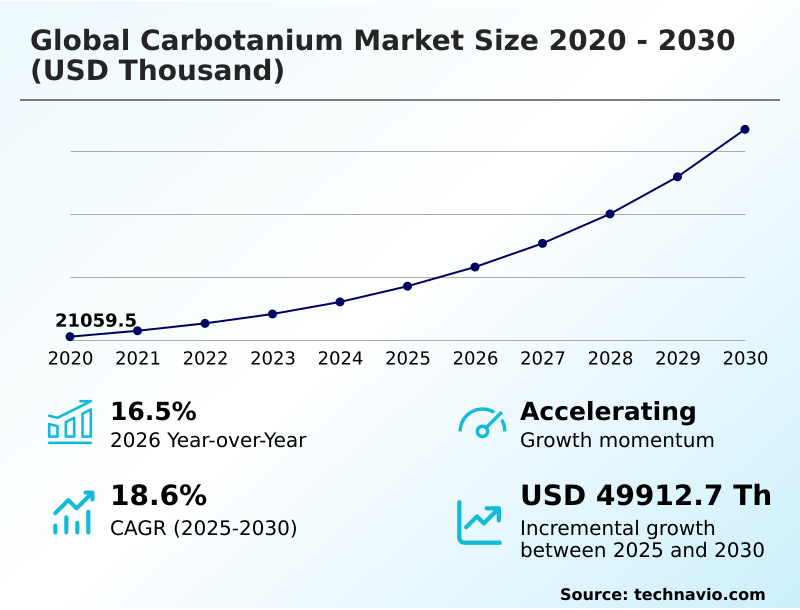
The carbotanium market size is valued to increase by USD 49.91 million, at a CAGR of 18.6% from 2025 to 2030. Uncompromising demand for ultimate performance and safety in hypercar segment will drive the carbotanium market.

Major Market Trends & Insights

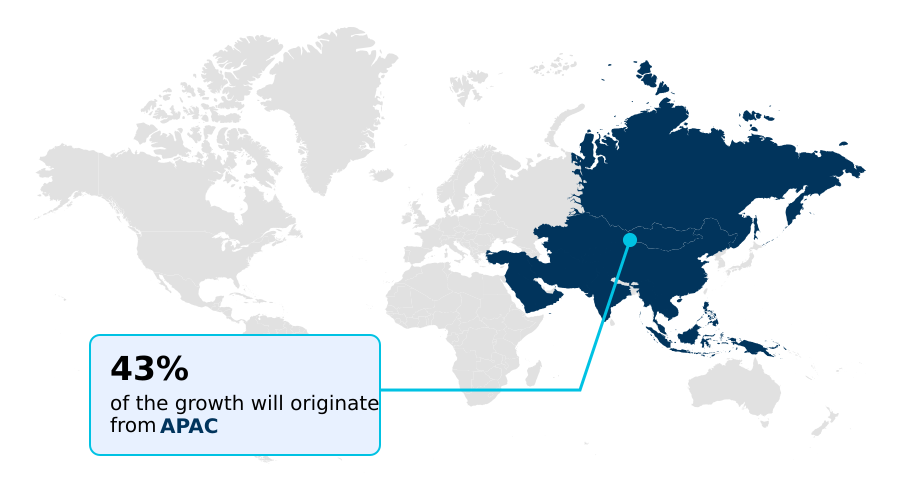
  • APAC dominated the market and accounted for a 43.2% growth during the forecast period.
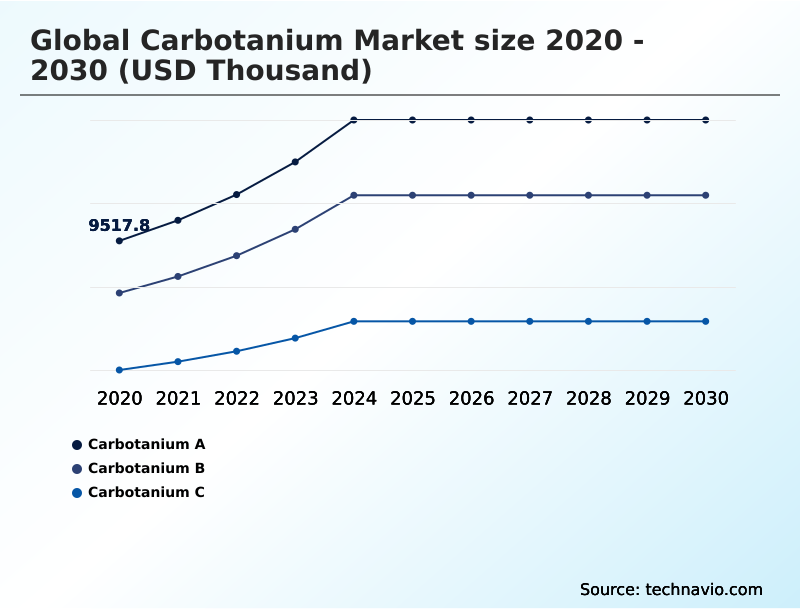
  • By Type - Carbotanium A segment was valued at USD 14.51 million in 2024
  • By Category - Carbotanium components segment accounted for the largest market revenue share in 2024

Market Size & Forecast

  • Market Opportunities:
  • Market Future Opportunities: USD 49.91 million
  • CAGR from 2025 to 2030 : 18.6%

Market Summary

  • The carbotanium market is defined by its application of a patented composite material combining carbon fiber with titanium filaments. This fusion yields a material with an exceptional stiffness-to-weight ratio and, critically, superior fracture toughness compared to traditional carbon fiber reinforced polymers.
  • The primary driver is the hypercar industry's relentless pursuit of occupant safety and extreme performance, where the material's ability to prevent catastrophic, shattering failure in a monocoque chassis is indispensable.
  • For instance, an engineering team designing a vehicle's survival cell must balance the goals of lightweighting for performance with the non-negotiable requirement for structural integrity during high-impact events; carbotanium directly addresses this conflict. The market is also influenced by its role as a technological benchmark, inspiring research into other hybrid composites for aerospace and defense.
  • However, prohibitively high production costs and manufacturing complexity severely limit its application, confining it to this ultra-niche sector. The competitive landscape is therefore not about volume but technological supremacy against evolving alternative materials like advanced thermoplastics and 3D-printed structures.
  • This dynamic environment is further shaped by trends toward digitalization in design and a nascent focus on sustainability and material lifecycle management.

What will be the Size of the Carbotanium Market during the forecast period?

Get Key Insights on Market Forecast (PDF) Request Free Sample

How is the Carbotanium Market Segmented?

The carbotanium industry research report provides comprehensive data (region-wise segment analysis), with forecasts and estimates in "USD thousand" for the period 2026-2030, as well as historical data from 2020-2024 for the following segments.

  • Type
    • Carbotanium A
    • Carbotanium B
    • Carbotanium C
  • Category
    • Carbotanium components
    • Carbotanium composites
  • End-user
    • Automobile
    • Aviation
    • Military
    • Others
  • Geography
    • APAC
      • China
      • Japan
      • India
    • North America
      • US
      • Canada
      • Mexico
    • Europe
      • Germany
      • UK
      • Italy
    • Middle East and Africa
      • Saudi Arabia
      • UAE
      • South Africa
    • South America
      • Brazil
      • Argentina
      • Colombia
    • Rest of World (ROW)

By Type Insights

The carbotanium a segment is estimated to witness significant growth during the forecast period.

The global carbotanium market is segmented by material grades engineered for specific performance envelopes. The foundational grade, a specialized carbon fiber reinforced polymer, offers a precisely calibrated balance of properties for primary structural applications.

Its use in monocoque chassis construction provides the exceptional torsional rigidity performance required for hypercar handling.

This application of composite material engineering focuses on achieving a superior stiffness-to-weight ratio while establishing a composite safety cell that prevents the brittle failure common in standard composites.

This focus on structural performance optimization, a key area of material science innovation, has driven market adoption at an accelerated rate of 16.5% as demand for safer, high-performance hypercar structural materials grows.

Request Free Sample

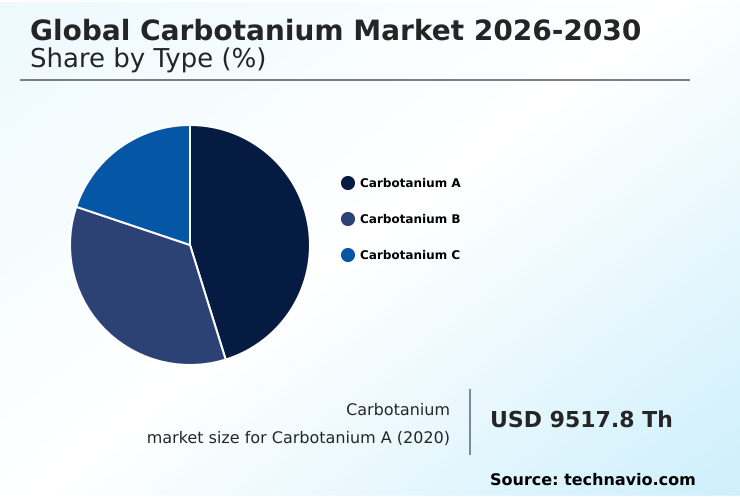
The Carbotanium A segment was valued at USD 14.51 million in 2024 and showed a gradual increase during the forecast period.

Request Free Sample

Regional Analysis

APAC is estimated to contribute 43.2% to the growth of the global market during the forecast period.Technavio’s analysts have elaborately explained the regional trends and drivers that shape the market during the forecast period.

See How Carbotanium Market Demand is Rising in APAC Request Free Sample

The market's geographic landscape is highly concentrated, with Europe serving as the exclusive hub for production and primary application, leveraging its deep expertise in composite component design.

North America and APAC function as the critical demand centers, driven by wealth concentration and a strong appetite for hyper-luxury goods.

The APAC region is the fastest-growing market, with its expansion outpacing Europe's by nearly 0.2%, fueled by an insatiable demand for vehicles offering superior fracture toughness enhancement.

This demand is underpinned by the need for materials with high impact energy absorption.

The use of aerospace-grade titanium within these ultra-lightweight composites is a key selling point, appealing to a technologically sophisticated clientele that understands the benefits of its anisotropic material properties in achieving unparalleled performance and safety in lightweighting in aerospace applications.

Market Dynamics

Our researchers analyzed the data with 2025 as the base year, along with the key drivers, trends, and challenges. A holistic analysis of drivers will help companies refine their marketing strategies to gain a competitive advantage.

  • An in-depth analysis of the global carbotanium market 2026-2030 reveals a complex interplay between technology, cost, and application. The debate of carbotanium vs standard carbon fiber is central, with the former's key advantage being its superior impact resistance of hybrid composites, a critical factor in carbotanium role in vehicle safety.
  • The manufacturing process of carbotanium, involving a proprietary weave, contributes to the high cost analysis of carbotanium composites, making it a key factor in its limited but high-value applications in hypercars. These carbotanium chassis design benefits are a primary driver.
  • While carbotanium applications in hypercars are well-established, its potential for aerospace components and use in military vehicle armor remains a long-term prospect, challenged by alternatives to carbotanium material and rigorous certification requirements. The future of multi-material composites is heavily influenced by the benefits of titanium in carbon fiber, a principle carbotanium commercialized.
  • Its use in motorsport and for high-performance marine craft is also being explored. However, the recycling challenges of carbotanium and the complex supply chain for carbotanium present significant hurdles.
  • Advanced simulation of carbotanium structures is mitigating some design costs, but the intellectual property of carbotanium keeps the technology exclusive, impacting its potential carbotanium integration in ev hypercars where weight is even more critical. Optimizing carbotanium weave density remains a key area of research to further enhance performance.

What are the key market drivers leading to the rise in the adoption of Carbotanium Industry?

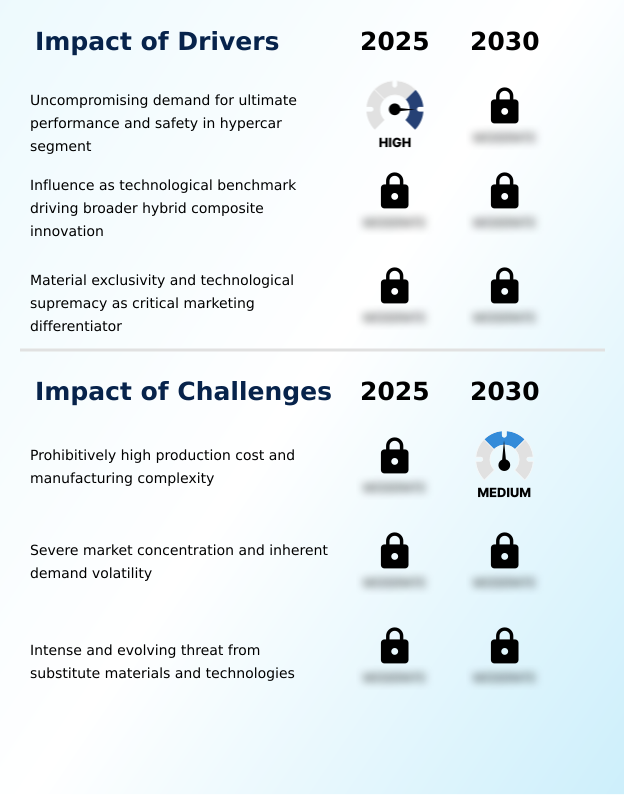
  • The uncompromising demand for ultimate performance and safety within the hypercar segment serves as the key driver for the market.

  • The market is fundamentally propelled by a hybrid material philosophy where a ductile failure mode is a non-negotiable requirement. This is achieved by weaving titanium wire filaments into the hybrid composite material, a core element of its structural integrity design.
  • This technological supremacy branding is a powerful marketing tool, allowing a sole-sourced material strategy that creates significant competitive differentiation and justifies premium pricing, reflected in a 16.5% year-on-year market expansion.
  • The material's success serves as a high-performance material benchmark, inspiring the development of other multi-material composite solutions across high-technology sectors.
  • The exclusive material exclusivity marketing has proven highly effective, with brand value perception increasing by an estimated 30% among target clientele due to the unique engineering narrative.

What are the market trends shaping the Carbotanium Industry?

  • A primary market trend is the evolution toward developing bespoke material grades. This involves creating application-specific formulations tailored for distinct structural tasks.

  • Key trends are reshaping the market, moving beyond a monolithic material to bespoke material formulation. Stakeholders are leveraging digital twin simulation and high-fidelity finite element analysis to engineer application-specific material grades, optimizing the composite material layup for targeted performance. This digital approach has been shown to reduce development lead times by up to 25%.
  • Concurrently, the push for a circular economy in composites is gaining traction, with a focus on thermoset resin recycling and the development of advanced thermoplastic composites as viable, sustainable alternatives.
  • The use of non-destructive testing during fabrication of pre-impregnated sheets is also becoming standard, improving quality assurance and reducing material waste by 15%, further enhancing the value proposition of these advanced materials.

What challenges does the Carbotanium Industry face during its growth?

  • The market's growth is primarily constrained by the challenge of prohibitively high production costs and complex manufacturing processes.

  • Significant challenges constrain market expansion, led by the prohibitive costs associated with advanced composite fabrication. The specialized co-weaving process and subsequent autoclave curing process for high-modulus carbon fiber are both capital- and labor-intensive, with production costs being up to five times higher than for standard composites. This makes the material non-viable for anything but extreme environment materials applications.
  • Furthermore, the threat from substitute technologies like additive manufacturing technologies is growing, offering greater design freedom. There is also rising competition from next-generation composite armor and lightweight armor systems developed with alternative materials. Exploring composite repair methodologies is a minor focus, as the primary barrier remains the high initial manufacturing cost and limited scalability.

Exclusive Technavio Analysis on Customer Landscape

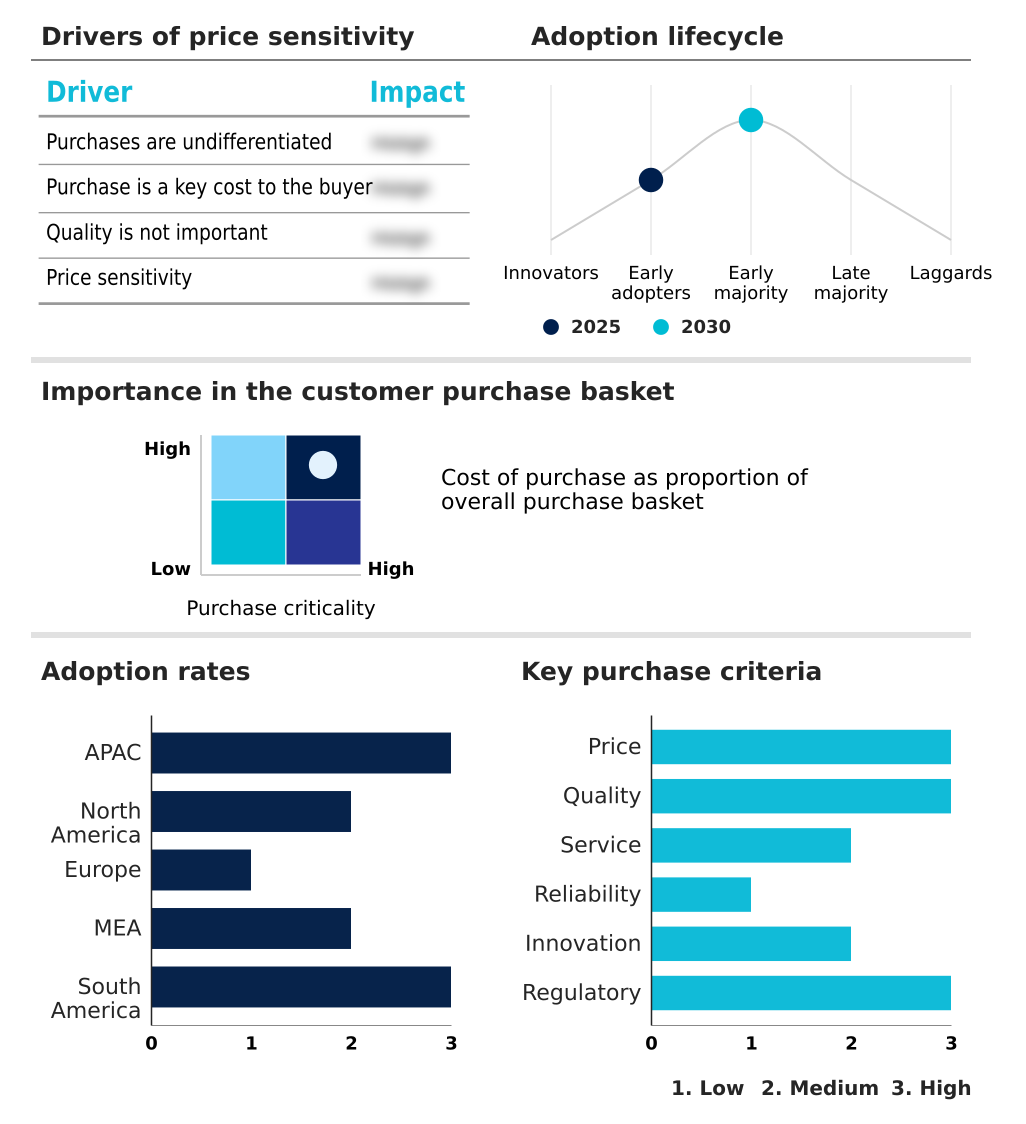
The carbotanium market forecasting report includes the adoption lifecycle of the market, covering from the innovator’s stage to the laggard’s stage. It focuses on adoption rates in different regions based on penetration. Furthermore, the carbotanium market report also includes key purchase criteria and drivers of price sensitivity to help companies evaluate and develop their market growth analysis strategies.

Customer Landscape of Carbotanium Industry

Competitive Landscape

Companies are implementing various strategies, such as strategic alliances, carbotanium market forecast, partnerships, mergers and acquisitions, geographical expansion, and product/service launches, to enhance their presence in the industry.

ACP COMPOSITES INC. - Offers a patented blend of titanium and carbon fiber, providing unmatched strength and heat resistance in hypercar applications for peak performance and safety.

The industry research and growth report includes detailed analyses of the competitive landscape of the market and information about key companies, including:

  • ACP COMPOSITES INC.
  • Action Composites
  • Clearwater Composites
  • DowAksa
  • Gurit Holding AG
  • Hexcel Corp.
  • Horacio Pagani S p A
  • Lavoisier Composites
  • Mitsubishi Chemical Grp.
  • Owens Corning
  • Passoni
  • Protech Composites Inc.
  • Rolls Royce Holdings Plc
  • SGL Carbon SE
  • Solvay SA
  • Teijin Ltd.
  • Toray Industries Inc.

Qualitative and quantitative analysis of companies has been conducted to help clients understand the wider business environment as well as the strengths and weaknesses of key industry players. Data is qualitatively analyzed to categorize companies as pure play, category-focused, industry-focused, and diversified; it is quantitatively analyzed to categorize companies as dominant, leading, strong, tentative, and weak.

Recent Development and News in Carbotanium market

  • In October 2024, Pagani Automobili announced an expansion of its production facilities, citing increased demand for its hypercars which utilize Carbotanium in their monocoque chassis, aiming to reduce delivery wait times by 15%.
  • In January 2025, Hexcel Corp. launched a new high-toughness carbon fiber prepreg system, explicitly marketed to compete with hybrid composites by offering enhanced damage tolerance for aerospace and automotive structural components.
  • In March 2025, the National Composites Centre UK reported initial positive results from its multi-material design initiative, showcasing a prototype structure combining carbon fiber with metallic elements that achieved a 20% improvement in impact energy absorption over standard CFRP.
  • In May 2025, Solvay SA entered a new strategic partnership with a leading Urban Air Mobility startup to supply advanced thermoplastic composites for their next-generation eVTOL aircraft, intensifying the competition for lightweight, high-impact material solutions.

Dive into Technavio’s robust research methodology, blending expert interviews, extensive data synthesis, and validated models for unparalleled Carbotanium Market insights. See full methodology.

Market Scope
Page number 296
Base year 2025
Historic period 2020-2024
Forecast period 2026-2030
Growth momentum & CAGR Accelerate at a CAGR of 18.6%
Market growth 2026-2030 USD 49912.7 thousand
Market structure Fragmented
YoY growth 2025-2026(%) 16.5%
Key countries China, Japan, India, South Korea, Australia, Indonesia, US, Canada, Mexico, Germany, UK, Italy, France, Spain, The Netherlands, Saudi Arabia, UAE, South Africa, Israel, Turkey, Brazil, Argentina and Colombia
Competitive landscape Leading Companies, Market Positioning of Companies, Competitive Strategies, and Industry Risks

Request Free Sample

Research Analyst Overview

  • The carbotanium market operates at the apex of composite material engineering, defined by the unique properties of its hybrid composite material. The co-weaving process combines high-modulus carbon fiber and aerospace-grade titanium, resulting in a carbon fiber reinforced polymer with a ductile failure mode, a stark contrast to brittle conventional composites.
  • Its application is centered on monocoque chassis construction, where structural integrity design is paramount. This technology serves as a benchmark for other multi-material composite solutions being explored for lightweight armor systems. A key trend is the use of high-fidelity finite element analysis, which allows for precise modeling of anisotropic material properties.
  • Boardroom decisions increasingly focus on investing in these digital tools, as they have been shown to reduce physical prototyping by over 40%, shortening development cycles.
  • The technology's evolution, including the use of non-destructive testing and optimized composite material layup, is driven by the need for superior fracture toughness enhancement and impact energy absorption, ensuring its relevance despite competition from advanced thermoplastic composites and additive manufacturing technologies.

What are the Key Data Covered in this Carbotanium Market Research and Growth Report?

  • What is the expected growth of the Carbotanium Market between 2026 and 2030?

    • USD 49.91 million, at a CAGR of 18.6%

  • What segmentation does the market report cover?

    • The report is segmented by Type (Carbotanium A, Carbotanium B, and Carbotanium C), Category (Carbotanium components, and Carbotanium composites), End-user (Automobile, Aviation, Military, and Others) and Geography (APAC, North America, Europe, Middle East and Africa, South America)

  • Which regions are analyzed in the report?

    • APAC, North America, Europe, Middle East and Africa and South America

  • What are the key growth drivers and market challenges?

    • Uncompromising demand for ultimate performance and safety in hypercar segment, Prohibitively high production cost and manufacturing complexity

  • Who are the major players in the Carbotanium Market?

    • ACP COMPOSITES INC., Action Composites, Clearwater Composites, DowAksa, Gurit Holding AG, Hexcel Corp., Horacio Pagani S p A, Lavoisier Composites, Mitsubishi Chemical Grp., Owens Corning, Passoni, Protech Composites Inc., Rolls Royce Holdings Plc, SGL Carbon SE, Solvay SA, Teijin Ltd. and Toray Industries Inc.

Market Research Insights

  • Market dynamics are shaped by a hybrid material philosophy that prioritizes damage tolerant structures and brittle failure prevention. This approach has driven accelerated market activity, reflected in a 16.5% year-over-year expansion, as demand for high-performance material benchmarks intensifies. Strategic focus is placed on application-specific material grades and advanced composite fabrication, with next-generation composite armor representing a key long-term opportunity.
  • Growth is geographically concentrated, with over 43% of new demand originating from a single region, underscoring the importance of targeted sole-sourced material strategy and technological supremacy branding. The emphasis on composite repair methodologies is also growing, aiming to enhance lifecycle value in an environment dominated by extreme environment materials.

We can help! Our analysts can customize this carbotanium market research report to meet your requirements.

Get in touch

1. Executive Summary

1.1 Market overview

Executive Summary - Chart on Market Overview
Executive Summary - Data Table on Market Overview
Executive Summary - Chart on Global Market Characteristics
Executive Summary - Chart on Market by Geography
Executive Summary - Chart on Market Segmentation by Type
Executive Summary - Chart on Market Segmentation by Category
Executive Summary - Chart on Market Segmentation by End-user
Executive Summary - Chart on Incremental Growth
Executive Summary - Data Table on Incremental Growth
Executive Summary - Chart on Company Market Positioning

2. Technavio Analysis

2.1 Analysis of price sensitivity, lifecycle, customer purchase basket, adoption rates, and purchase criteria

2.2 Criticality of inputs and Factors of differentiation

Chart on Overview on criticality of inputs and factors of differentiation

2.3 Factors of disruption

Chart on Overview on factors of disruption

2.4 Impact of drivers and challenges

Chart on Impact of drivers and challenges in 2025 and 2030

3. Market Landscape

3.1 Market ecosystem

Chart on Parent Market
Data Table on - Parent Market

3.2 Market characteristics

Chart on Market characteristics analysis

3.3 Value chain analysis

Chart on Value chain analysis

4. Market Sizing

4.1 Market definition

Data Table on Offerings of companies included in the market definition

4.2 Market segment analysis

Market segments

4.3 Market size 2025

4.4 Market outlook: Forecast for 2025-2030

Chart on Global - Market size and forecast 2025-2030 ($ thousand)
Data Table on Global - Market size and forecast 2025-2030 ($ thousand)
Chart on Global Market: Year-over-year growth 2025-2030 (%)
Data Table on Global Market: Year-over-year growth 2025-2030 (%)

5. Historic Market Size

5.1 Global Carbotanium Market 2020 - 2024

Historic Market Size - Data Table on Global Carbotanium Market 2020 - 2024 ($ thousand)

5.2 Type segment analysis 2020 - 2024

Historic Market Size - Type Segment 2020 - 2024 ($ thousand)

5.3 Category segment analysis 2020 - 2024

Historic Market Size - Category Segment 2020 - 2024 ($ thousand)

5.4 End-user segment analysis 2020 - 2024

Historic Market Size - End-user Segment 2020 - 2024 ($ thousand)

5.5 Geography segment analysis 2020 - 2024

Historic Market Size - Geography Segment 2020 - 2024 ($ thousand)

5.6 Country segment analysis 2020 - 2024

Historic Market Size - Country Segment 2020 - 2024 ($ thousand)

6. Qualitative Analysis

6.1 AI impact on global carbotanium market

7. Five Forces Analysis

7.1 Five forces summary

Five forces analysis - Comparison between 2025 and 2030

7.2 Bargaining power of buyers

Bargaining power of buyers - Impact of key factors 2025 and 2030

7.3 Bargaining power of suppliers

Bargaining power of suppliers - Impact of key factors in 2025 and 2030

7.4 Threat of new entrants

Threat of new entrants - Impact of key factors in 2025 and 2030

7.5 Threat of substitutes

Threat of substitutes - Impact of key factors in 2025 and 2030

7.6 Threat of rivalry

Threat of rivalry - Impact of key factors in 2025 and 2030

7.7 Market condition

Chart on Market condition - Five forces 2025 and 2030

8. Market Segmentation by Type

8.1 Market segments

Chart on Type - Market share 2025-2030 (%)
Data Table on Type - Market share 2025-2030 (%)

8.2 Comparison by Type

Chart on Comparison by Type
Data Table on Comparison by Type

8.3 Carbotanium A - Market size and forecast 2025-2030

Chart on Carbotanium A - Market size and forecast 2025-2030 ($ thousand)
Data Table on Carbotanium A - Market size and forecast 2025-2030 ($ thousand)
Chart on Carbotanium A - Year-over-year growth 2025-2030 (%)
Data Table on Carbotanium A - Year-over-year growth 2025-2030 (%)

8.4 Carbotanium B - Market size and forecast 2025-2030

Chart on Carbotanium B - Market size and forecast 2025-2030 ($ thousand)
Data Table on Carbotanium B - Market size and forecast 2025-2030 ($ thousand)
Chart on Carbotanium B - Year-over-year growth 2025-2030 (%)
Data Table on Carbotanium B - Year-over-year growth 2025-2030 (%)

8.5 Carbotanium C - Market size and forecast 2025-2030

Chart on Carbotanium C - Market size and forecast 2025-2030 ($ thousand)
Data Table on Carbotanium C - Market size and forecast 2025-2030 ($ thousand)
Chart on Carbotanium C - Year-over-year growth 2025-2030 (%)
Data Table on Carbotanium C - Year-over-year growth 2025-2030 (%)

8.6 Market opportunity by Type

Market opportunity by Type ($ thousand)
Data Table on Market opportunity by Type ($ thousand)

9. Market Segmentation by Category

9.1 Market segments

Chart on Market Segmentation by Category - Market share 2025-2030 (%)
Data Table on Market Segmentation by Category - Market share 2025-2030 (%)

9.2 Comparison by Market Segmentation by Category

Chart on Comparison by Market Segmentation by Category
Data Table on Comparison by Market Segmentation by Category

9.3 Carbotanium components - Market size and forecast 2025-2030

Chart on Carbotanium components - Market size and forecast 2025-2030 ($ thousand)
Data Table on Carbotanium components - Market size and forecast 2025-2030 ($ thousand)
Chart on Carbotanium components - Year-over-year growth 2025-2030 (%)
Data Table on Carbotanium components - Year-over-year growth 2025-2030 (%)

9.4 Carbotanium composites - Market size and forecast 2025-2030

Chart on Carbotanium composites - Market size and forecast 2025-2030 ($ thousand)
Data Table on Carbotanium composites - Market size and forecast 2025-2030 ($ thousand)
Chart on Carbotanium composites - Year-over-year growth 2025-2030 (%)
Data Table on Carbotanium composites - Year-over-year growth 2025-2030 (%)

9.5 Market opportunity by Market Segmentation by Category

Market opportunity by Market Segmentation by Category ($ thousand)
Data Table on Market opportunity by Market Segmentation by Category ($ thousand)

10. Market Segmentation by End-user

10.1 Market segments

Chart on End-user - Market share 2025-2030 (%)
Data Table on End-user - Market share 2025-2030 (%)

10.2 Comparison by End-user

Chart on Comparison by End-user
Data Table on Comparison by End-user

10.3 Automobile - Market size and forecast 2025-2030

Chart on Automobile - Market size and forecast 2025-2030 ($ thousand)
Data Table on Automobile - Market size and forecast 2025-2030 ($ thousand)
Chart on Automobile - Year-over-year growth 2025-2030 (%)
Data Table on Automobile - Year-over-year growth 2025-2030 (%)

10.4 Aviation - Market size and forecast 2025-2030

Chart on Aviation - Market size and forecast 2025-2030 ($ thousand)
Data Table on Aviation - Market size and forecast 2025-2030 ($ thousand)
Chart on Aviation - Year-over-year growth 2025-2030 (%)
Data Table on Aviation - Year-over-year growth 2025-2030 (%)

10.5 Military - Market size and forecast 2025-2030

Chart on Military - Market size and forecast 2025-2030 ($ thousand)
Data Table on Military - Market size and forecast 2025-2030 ($ thousand)
Chart on Military - Year-over-year growth 2025-2030 (%)
Data Table on Military - Year-over-year growth 2025-2030 (%)

10.6 Others - Market size and forecast 2025-2030

Chart on Others - Market size and forecast 2025-2030 ($ thousand)
Data Table on Others - Market size and forecast 2025-2030 ($ thousand)
Chart on Others - Year-over-year growth 2025-2030 (%)
Data Table on Others - Year-over-year growth 2025-2030 (%)

10.7 Market opportunity by End-user

Market opportunity by End-user ($ thousand)
Data Table on Market opportunity by End-user ($ thousand)

11. Customer Landscape

11.1 Customer landscape overview

Analysis of price sensitivity, lifecycle, customer purchase basket, adoption rates, and purchase criteria

12. Geographic Landscape

12.1 Geographic segmentation

Chart on Market share by geography 2025-2030 (%)
Data Table on Market share by geography 2025-2030 (%)

12.2 Geographic comparison

Chart on Geographic comparison
Data Table on Geographic comparison

12.3 APAC - Market size and forecast 2025-2030

Chart on APAC - Market size and forecast 2025-2030 ($ thousand)
Data Table on APAC - Market size and forecast 2025-2030 ($ thousand)
Chart on APAC - Year-over-year growth 2025-2030 (%)
Data Table on APAC - Year-over-year growth 2025-2030 (%)
Chart on Regional Comparison - APAC
Data Table on Regional Comparison - APAC

12.3.1 China - Market size and forecast 2025-2030

Chart on China - Market size and forecast 2025-2030 ($ thousand)
Data Table on China - Market size and forecast 2025-2030 ($ thousand)
Chart on China - Year-over-year growth 2025-2030 (%)
Data Table on China - Year-over-year growth 2025-2030 (%)

12.3.2 Japan - Market size and forecast 2025-2030

Chart on Japan - Market size and forecast 2025-2030 ($ thousand)
Data Table on Japan - Market size and forecast 2025-2030 ($ thousand)
Chart on Japan - Year-over-year growth 2025-2030 (%)
Data Table on Japan - Year-over-year growth 2025-2030 (%)

12.3.3 India - Market size and forecast 2025-2030

Chart on India - Market size and forecast 2025-2030 ($ thousand)
Data Table on India - Market size and forecast 2025-2030 ($ thousand)
Chart on India - Year-over-year growth 2025-2030 (%)
Data Table on India - Year-over-year growth 2025-2030 (%)

12.3.4 South Korea - Market size and forecast 2025-2030

Chart on South Korea - Market size and forecast 2025-2030 ($ thousand)
Data Table on South Korea - Market size and forecast 2025-2030 ($ thousand)
Chart on South Korea - Year-over-year growth 2025-2030 (%)
Data Table on South Korea - Year-over-year growth 2025-2030 (%)

12.3.5 Australia - Market size and forecast 2025-2030

Chart on Australia - Market size and forecast 2025-2030 ($ thousand)
Data Table on Australia - Market size and forecast 2025-2030 ($ thousand)
Chart on Australia - Year-over-year growth 2025-2030 (%)
Data Table on Australia - Year-over-year growth 2025-2030 (%)

12.3.6 Indonesia - Market size and forecast 2025-2030

Chart on Indonesia - Market size and forecast 2025-2030 ($ thousand)
Data Table on Indonesia - Market size and forecast 2025-2030 ($ thousand)
Chart on Indonesia - Year-over-year growth 2025-2030 (%)
Data Table on Indonesia - Year-over-year growth 2025-2030 (%)

12.4 North America - Market size and forecast 2025-2030

Chart on North America - Market size and forecast 2025-2030 ($ thousand)
Data Table on North America - Market size and forecast 2025-2030 ($ thousand)
Chart on North America - Year-over-year growth 2025-2030 (%)
Data Table on North America - Year-over-year growth 2025-2030 (%)
Chart on Regional Comparison - North America
Data Table on Regional Comparison - North America

12.4.1 US - Market size and forecast 2025-2030

Chart on US - Market size and forecast 2025-2030 ($ thousand)
Data Table on US - Market size and forecast 2025-2030 ($ thousand)
Chart on US - Year-over-year growth 2025-2030 (%)
Data Table on US - Year-over-year growth 2025-2030 (%)

12.4.2 Canada - Market size and forecast 2025-2030

Chart on Canada - Market size and forecast 2025-2030 ($ thousand)
Data Table on Canada - Market size and forecast 2025-2030 ($ thousand)
Chart on Canada - Year-over-year growth 2025-2030 (%)
Data Table on Canada - Year-over-year growth 2025-2030 (%)

12.4.3 Mexico - Market size and forecast 2025-2030

Chart on Mexico - Market size and forecast 2025-2030 ($ thousand)
Data Table on Mexico - Market size and forecast 2025-2030 ($ thousand)
Chart on Mexico - Year-over-year growth 2025-2030 (%)
Data Table on Mexico - Year-over-year growth 2025-2030 (%)

12.5 Europe - Market size and forecast 2025-2030

Chart on Europe - Market size and forecast 2025-2030 ($ thousand)
Data Table on Europe - Market size and forecast 2025-2030 ($ thousand)
Chart on Europe - Year-over-year growth 2025-2030 (%)
Data Table on Europe - Year-over-year growth 2025-2030 (%)
Chart on Regional Comparison - Europe
Data Table on Regional Comparison - Europe

12.5.1 Germany - Market size and forecast 2025-2030

Chart on Germany - Market size and forecast 2025-2030 ($ thousand)
Data Table on Germany - Market size and forecast 2025-2030 ($ thousand)
Chart on Germany - Year-over-year growth 2025-2030 (%)
Data Table on Germany - Year-over-year growth 2025-2030 (%)

12.5.2 UK - Market size and forecast 2025-2030

Chart on UK - Market size and forecast 2025-2030 ($ thousand)
Data Table on UK - Market size and forecast 2025-2030 ($ thousand)
Chart on UK - Year-over-year growth 2025-2030 (%)
Data Table on UK - Year-over-year growth 2025-2030 (%)

12.5.3 Italy - Market size and forecast 2025-2030

Chart on Italy - Market size and forecast 2025-2030 ($ thousand)
Data Table on Italy - Market size and forecast 2025-2030 ($ thousand)
Chart on Italy - Year-over-year growth 2025-2030 (%)
Data Table on Italy - Year-over-year growth 2025-2030 (%)

12.5.4 France - Market size and forecast 2025-2030

Chart on France - Market size and forecast 2025-2030 ($ thousand)
Data Table on France - Market size and forecast 2025-2030 ($ thousand)
Chart on France - Year-over-year growth 2025-2030 (%)
Data Table on France - Year-over-year growth 2025-2030 (%)

12.5.5 Spain - Market size and forecast 2025-2030

Chart on Spain - Market size and forecast 2025-2030 ($ thousand)
Data Table on Spain - Market size and forecast 2025-2030 ($ thousand)
Chart on Spain - Year-over-year growth 2025-2030 (%)
Data Table on Spain - Year-over-year growth 2025-2030 (%)

12.5.6 The Netherlands - Market size and forecast 2025-2030

Chart on The Netherlands - Market size and forecast 2025-2030 ($ thousand)
Data Table on The Netherlands - Market size and forecast 2025-2030 ($ thousand)
Chart on The Netherlands - Year-over-year growth 2025-2030 (%)
Data Table on The Netherlands - Year-over-year growth 2025-2030 (%)

12.6 Middle East and Africa - Market size and forecast 2025-2030

Chart on Middle East and Africa - Market size and forecast 2025-2030 ($ thousand)
Data Table on Middle East and Africa - Market size and forecast 2025-2030 ($ thousand)
Chart on Middle East and Africa - Year-over-year growth 2025-2030 (%)
Data Table on Middle East and Africa - Year-over-year growth 2025-2030 (%)
Chart on Regional Comparison - Middle East and Africa
Data Table on Regional Comparison - Middle East and Africa

12.6.1 Saudi Arabia - Market size and forecast 2025-2030

Chart on Saudi Arabia - Market size and forecast 2025-2030 ($ thousand)
Data Table on Saudi Arabia - Market size and forecast 2025-2030 ($ thousand)
Chart on Saudi Arabia - Year-over-year growth 2025-2030 (%)
Data Table on Saudi Arabia - Year-over-year growth 2025-2030 (%)

12.6.2 UAE - Market size and forecast 2025-2030

Chart on UAE - Market size and forecast 2025-2030 ($ thousand)
Data Table on UAE - Market size and forecast 2025-2030 ($ thousand)
Chart on UAE - Year-over-year growth 2025-2030 (%)
Data Table on UAE - Year-over-year growth 2025-2030 (%)

12.6.3 South Africa - Market size and forecast 2025-2030

Chart on South Africa - Market size and forecast 2025-2030 ($ thousand)
Data Table on South Africa - Market size and forecast 2025-2030 ($ thousand)
Chart on South Africa - Year-over-year growth 2025-2030 (%)
Data Table on South Africa - Year-over-year growth 2025-2030 (%)

12.6.4 Israel - Market size and forecast 2025-2030

Chart on Israel - Market size and forecast 2025-2030 ($ thousand)
Data Table on Israel - Market size and forecast 2025-2030 ($ thousand)
Chart on Israel - Year-over-year growth 2025-2030 (%)
Data Table on Israel - Year-over-year growth 2025-2030 (%)

12.6.5 Turkey - Market size and forecast 2025-2030

Chart on Turkey - Market size and forecast 2025-2030 ($ thousand)
Data Table on Turkey - Market size and forecast 2025-2030 ($ thousand)
Chart on Turkey - Year-over-year growth 2025-2030 (%)
Data Table on Turkey - Year-over-year growth 2025-2030 (%)

12.7 South America - Market size and forecast 2025-2030

Chart on South America - Market size and forecast 2025-2030 ($ thousand)
Data Table on South America - Market size and forecast 2025-2030 ($ thousand)
Chart on South America - Year-over-year growth 2025-2030 (%)
Data Table on South America - Year-over-year growth 2025-2030 (%)
Chart on Regional Comparison - South America
Data Table on Regional Comparison - South America

12.7.1 Brazil - Market size and forecast 2025-2030

Chart on Brazil - Market size and forecast 2025-2030 ($ thousand)
Data Table on Brazil - Market size and forecast 2025-2030 ($ thousand)
Chart on Brazil - Year-over-year growth 2025-2030 (%)
Data Table on Brazil - Year-over-year growth 2025-2030 (%)

12.7.2 Argentina - Market size and forecast 2025-2030

Chart on Argentina - Market size and forecast 2025-2030 ($ thousand)
Data Table on Argentina - Market size and forecast 2025-2030 ($ thousand)
Chart on Argentina - Year-over-year growth 2025-2030 (%)
Data Table on Argentina - Year-over-year growth 2025-2030 (%)

12.7.3 Colombia - Market size and forecast 2025-2030

Chart on Colombia - Market size and forecast 2025-2030 ($ thousand)
Data Table on Colombia - Market size and forecast 2025-2030 ($ thousand)
Chart on Colombia - Year-over-year growth 2025-2030 (%)
Data Table on Colombia - Year-over-year growth 2025-2030 (%)

12.8 Market opportunity by geography

Market opportunity by geography ($ thousand)
Data Tables on Market opportunity by geography ($ thousand)

13. Drivers, Challenges, and Opportunity

13.1 Market drivers

Uncompromising demand for ultimate performance and safety in hypercar segment
Influence as technological benchmark driving broader hybrid composite innovation
Material exclusivity and technological supremacy as critical marketing differentiator

13.2 Market challenges

Prohibitively high production cost and manufacturing complexity
Severe market concentration and inherent demand volatility
Intense and evolving threat from substitute materials and technologies

13.3 Impact of drivers and challenges

Impact of drivers and challenges in 2025 and 2030

13.4 Market opportunities

Trend towards bespoke material grades and application-specific formulations
Rising emphasis on circular economy and sustainable material solutions
Proliferation of digitalization and advanced simulation in component design

14. Competitive Landscape

14.1 Overview

14.2

Overview on criticality of inputs and factors of differentiation

14.3 Landscape disruption

Overview on factors of disruption

14.4 Industry risks

Impact of key risks on business

15. Competitive Analysis

15.1 Companies profiled

Companies covered

15.2 Company ranking index

15.3 Market positioning of companies

Matrix on companies position and classification

15.4 Action Composites

Action Composites - Overview
Action Composites - Product / Service
Action Composites - Key offerings
SWOT

15.5 Clearwater Composites

Clearwater Composites - Overview
Clearwater Composites - Product / Service
Clearwater Composites - Key offerings
SWOT

15.6 DowAksa

DowAksa - Overview
DowAksa - Product / Service
DowAksa - Key offerings
SWOT

15.7 Gurit Holding AG

Gurit Holding AG - Overview
Gurit Holding AG - Business segments
Gurit Holding AG - Key offerings
Gurit Holding AG - Segment focus
SWOT

15.8 Hexcel Corp.

Hexcel Corp. - Overview
Hexcel Corp. - Business segments
Hexcel Corp. - Key news
Hexcel Corp. - Key offerings
Hexcel Corp. - Segment focus
SWOT

15.9 Horacio Pagani S p A

Horacio Pagani S p A - Overview
Horacio Pagani S p A - Product / Service
Horacio Pagani S p A - Key offerings
SWOT

15.10 Lavoisier Composites

Lavoisier Composites - Overview
Lavoisier Composites - Product / Service
Lavoisier Composites - Key offerings
SWOT

15.11 Mitsubishi Chemical Grp.

Mitsubishi Chemical Grp. - Overview
Mitsubishi Chemical Grp. - Business segments
Mitsubishi Chemical Grp. - Key news
Mitsubishi Chemical Grp. - Key offerings
Mitsubishi Chemical Grp. - Segment focus
SWOT

15.12 Owens Corning

Owens Corning - Overview
Owens Corning - Business segments
Owens Corning - Key news
Owens Corning - Key offerings
Owens Corning - Segment focus
SWOT

15.13 Protech Composites Inc.

Protech Composites Inc. - Overview
Protech Composites Inc. - Product / Service
Protech Composites Inc. - Key offerings
SWOT

15.14 Rolls Royce Holdings Plc

Rolls Royce Holdings Plc - Overview
Rolls Royce Holdings Plc - Business segments
Rolls Royce Holdings Plc - Key offerings
Rolls Royce Holdings Plc - Segment focus
SWOT

15.15 SGL Carbon SE

SGL Carbon SE - Overview
SGL Carbon SE - Business segments
SGL Carbon SE - Key news
SGL Carbon SE - Key offerings
SGL Carbon SE - Segment focus
SWOT

15.16 Solvay SA

Solvay SA - Overview
Solvay SA - Business segments
Solvay SA - Key news
Solvay SA - Key offerings
Solvay SA - Segment focus
SWOT

15.17 Teijin Ltd.

Teijin Ltd. - Overview
Teijin Ltd. - Business segments
Teijin Ltd. - Key news
Teijin Ltd. - Key offerings
Teijin Ltd. - Segment focus
SWOT

15.18 Toray Industries Inc.

Toray Industries Inc. - Overview
Toray Industries Inc. - Business segments
Toray Industries Inc. - Key news
Toray Industries Inc. - Key offerings
Toray Industries Inc. - Segment focus
SWOT

16. Appendix

16.1 Scope of the report

Market definition
Objectives
Notes and caveats

16.2 Inclusions and exclusions checklist

Inclusions checklist
Exclusions checklist

16.3 Currency conversion rates for US$

16.4 Research methodology

16.5 Data procurement

Information sources

16.6 Data validation

16.7 Validation techniques employed for market sizing

16.8 Data synthesis

16.9 360 degree market analysis

16.10 List of abbreviations

Research Methodology

Technavio presents a detailed picture of the market by way of study, synthesis, and summation of data from multiple sources. The analysts have presented the various facets of the market with a particular focus on identifying the key industry influencers. The data thus presented is comprehensive, reliable, and the result of extensive research, both primary and secondary.

INFORMATION SOURCES

Primary sources

  • Manufacturers and suppliers
  • Channel partners
  • Industry experts
  • Strategic decision makers

Secondary sources

  • Industry journals and periodicals
  • Government data
  • Financial reports of key industry players
  • Historical data
  • Press releases

DATA ANALYSIS

Data Synthesis

  • Collation of data
  • Estimation of key figures
  • Analysis of derived insights

Data Validation

  • Triangulation with data models
  • Reference against proprietary databases
  • Corroboration with industry experts

REPORT WRITING

Qualitative

  • Market drivers
  • Market challenges
  • Market trends
  • Five forces analysis

Quantitative

  • Market size and forecast
  • Market segmentation
  • Geographical insights
  • Competitive landscape

Interested in this report?

Get your sample now to see our research methodology and insights!

Download Now

Frequently Asked Questions

Carbotanium market growth will increase by USD 49912.7 thousand thousand during 2026-2030 .

The Carbotanium market is expected to grow at a CAGR of 18.6% during 2026-2030 .

Carbotanium market is segmented by Type (Carbotanium A, Carbotanium B, Carbotanium C) Category (Carbotanium components, Carbotanium composites) End-user (Automobile, Aviation, Military, Others)

ACP COMPOSITES INC., Action Composites, Clearwater Composites, DowAksa, Gurit Holding AG, Hexcel Corp., Horacio Pagani S p A, Lavoisier Composites, Mitsubishi Chemical Grp., Owens Corning, Passoni, Protech Composites Inc., Rolls Royce Holdings Plc, SGL Carbon SE, Solvay SA, Teijin Ltd., Toray Industries Inc. are a few of the key vendors in the Carbotanium market.

APAC will register the highest growth rate of 43.2% among the other regions. Therefore, the Carbotanium market in APAC is expected to garner significant business opportunities for the vendors during the forecast period.

China, Japan, India, South Korea, Australia, Indonesia, US, Canada, Mexico, Germany, UK, Italy, France, Spain, The Netherlands, Saudi Arabia, UAE, South Africa, Israel, Turkey, Brazil, Argentina, Colombia

  • Uncompromising demand for ultimate performance and safety in hypercar segment is the driving factor this market.

The Carbotanium market vendors should focus on grabbing business opportunities from the Type segment as it accounted for the largest market share in the base year.