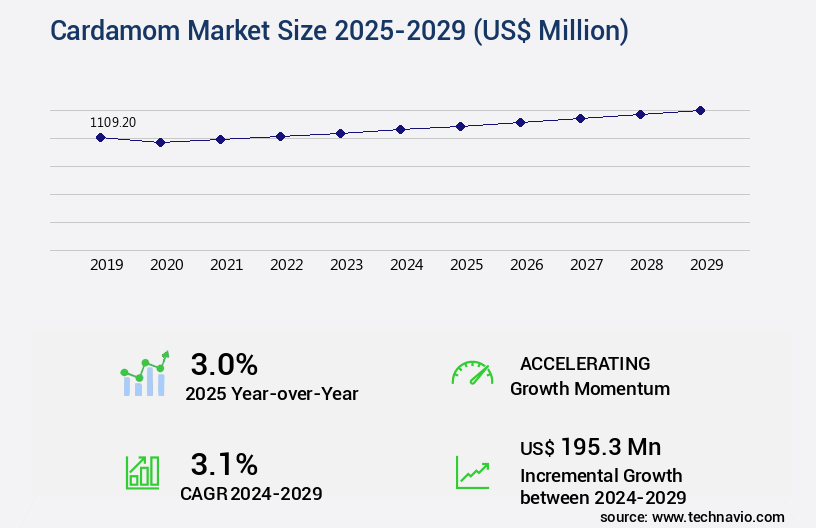
Cardamom Market Size 2025-2029
The cardamom market size is valued to increase USD 195.3 million, at a CAGR of 3.1% from 2024 to 2029. Growing awareness about health benefits of cardamom will drive the cardamom market.
Major Market Trends & Insights
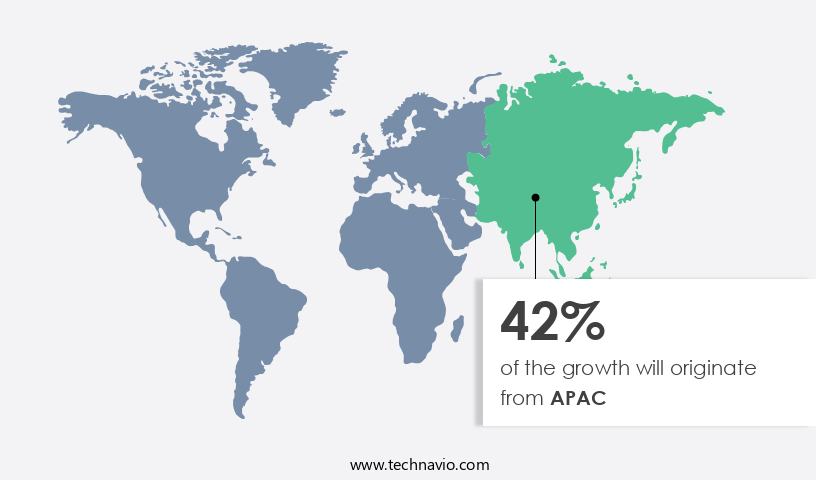
- APAC dominated the market and accounted for a 42% growth during the forecast period.
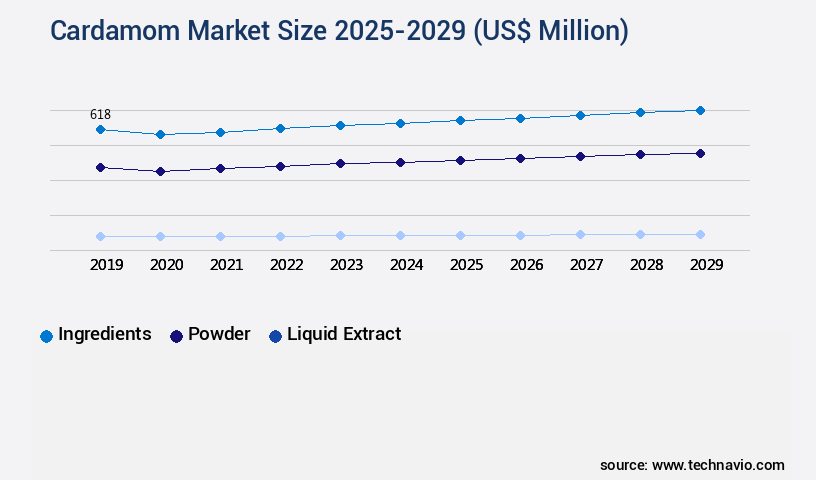
- By Product - Ingredients segment was valued at USD 618.00 million in 2023
- By Application - Food and beverages segment accounted for the largest market revenue share in 2023
Market Size & Forecast
- Market Opportunities: USD 24.38 million
- Market Future Opportunities: USD 195.30 million
- CAGR from 2024 to 2029 : 3.1%
Market Summary
- Amidst the dynamic global spice market, cardamom maintains a significant presence, with annual production reaching approximately 350,000 metric tons. This figure underscores the market's substantial influence, driven by escalating health consciousness and expanding online sales channels. Cardamom's rich, aromatic flavor and numerous health benefits, including antioxidant properties and digestive aid, have fueled its demand. Online shopping platforms have emerged as a key distribution avenue, offering convenience and accessibility to consumers worldwide. However, price volatility remains a persistent challenge, influenced by weather conditions, production costs, and supply chain complexities.
- Despite these hurdles, the market continues to evolve, with players exploring innovative strategies to mitigate risks and capitalize on opportunities. As consumer preferences shift towards healthier food options and convenient purchasing methods, the market's growth trajectory remains promising.
What will be the Size of the Cardamom Market during the forecast period?
Get Key Insights on Market Forecast (PDF) Request Free Sample
How is the Cardamom Market Segmented ?
The cardamom industry research report provides comprehensive data (region-wise segment analysis), with forecasts and estimates in "USD million" for the period 2025-2029, as well as historical data from 2019-2023 for the following segments.
- Product
- Ingredients
- Powder
- Liquid extract
- Application
- Food and beverages
- Medical usage
- Others
- Type
- Green cardamom
- Black cardamom
- White cardamom
- Distribution Channel
- Offline
- Online
- Geography
- North America
- US
- Europe
- Germany
- Italy
- UK
- APAC
- China
- India
- Japan
- South Korea
- Rest of World (ROW)
- North America
By Product Insights
The ingredients segment is estimated to witness significant growth during the forecast period.
The dynamic market continues to evolve, with a substantial 30% market share attributed to it in the global ingredients sector in 2024. This versatile spice is a staple in various culinary traditions, particularly in hot beverages like tea and coffee in countries such as Saudi Arabia, India, Pakistan, Nepal, UAE, Kuwait, Qatar, and Sri Lanka. In the food industry, cardamom is employed as an essential ingredient in bakery products, including bread, buns, cakes, and confectionery items, and in both savory and sweet dishes, predominantly in the MEA and APAC regions. In India, cardamom plays a pivotal role in various cuisines, enhancing the flavors of both sweet and spicy dishes.
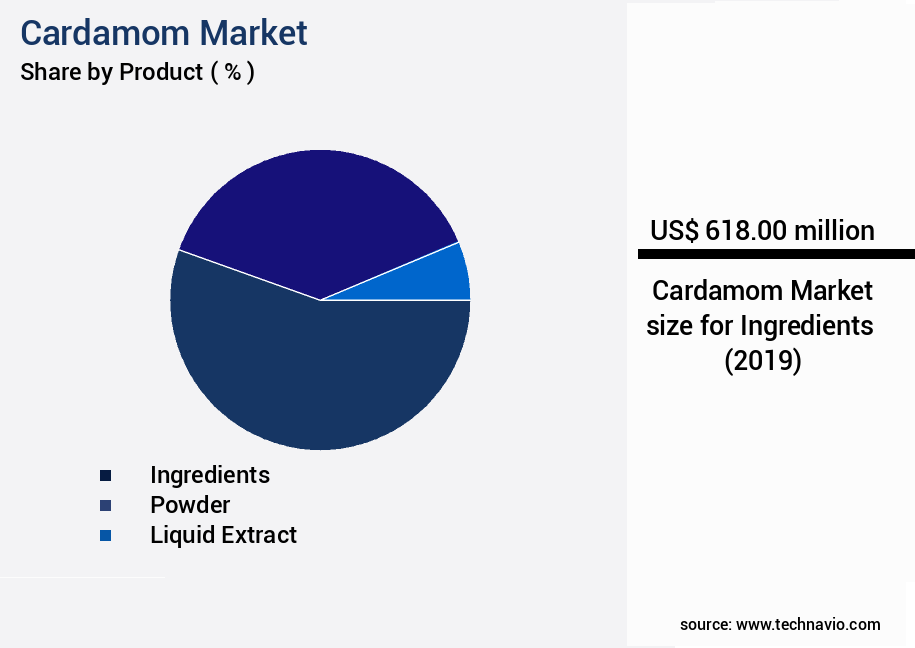
The Ingredients segment was valued at USD 618.00 million in 2019 and showed a gradual increase during the forecast period.
Local and regional companies in APAC's food and beverage sector offer a diverse range of sauces and dressings to preserve traditional flavors. Cardamom's application extends to precision agriculture tools, where it aids in nutrient deficiency diagnosis, crop yield optimization, and economic viability assessment. Additionally, ongoing research focuses on improving plant growth regulators, disease resistance breeding, and sustainable agriculture practices, ensuring the market's continuous growth.
Regional Analysis
APAC is estimated to contribute 42% to the growth of the global market during the forecast period. Technavio's analysts have elaborately explained the regional trends and drivers that shape the market during the forecast period.
See How Cardamom Market Demand is Rising in APAC Request Free Sample
The Asia Pacific (APAC) region holds a substantial share in the market due to its large production volume and diverse culinary practices. India, a significant contributor, produces approximately 75 of the 109 cardamom varieties recognized by the International Organization for Standardization (ISO). Other major producers in APAC include Sri Lanka, Nepal, and Indonesia. The presence of various cultures in the region results in an extensive range of cuisines, many of which incorporate cardamom.
Market Dynamics
Our researchers analyzed the data with 2024 as the base year, along with the key drivers, trends, and challenges. A holistic analysis of drivers will help companies refine their marketing strategies to gain a competitive advantage.
The market is a significant player in the spice industry, with various factors influencing its production, quality, and economic viability. One crucial aspect of cardamom cultivation is the impact of irrigation on yield. Studies have shown that adequate water supply can enhance cardamom productivity by up to 30%, making irrigation an essential investment for farmers in arid regions. Another critical determinant of cardamom quality is the type of fertilizer used. Organic fertilizers have been found to improve soil health and, consequently, enhance the aroma and flavor of cardamom. Soil health plays a pivotal role in cardamom production, with healthier soils yielding higher-quality capsules.
Volatile compounds in cardamom essential oil are a subject of intense research, as they contribute significantly to the spice's unique aroma and flavor. Optimizing cardamom drying methods is essential for retaining these compounds, ensuring the highest possible quality. Post-harvest handling practices also significantly impact cardamom shelf life, with proper storage conditions essential for maintaining the spice's aroma and flavor. Comparing different cardamom processing techniques reveals that traditional methods, such as sun-drying, often yield superior flavor profiles compared to mechanical drying. However, the latter is more efficient and cost-effective, making it a popular choice for large-scale commercial production.
Sustainable agricultural practices are increasingly important in the cardamom industry, with farmers adopting strategies to mitigate the effects of climate change on production. Modeling cardamom yield response to environmental factors and determining the optimal planting density for cardamom are essential components of sustainable farming systems. Investigations into disease resistance mechanisms in cardamom and mapping pest distribution in plantations are ongoing, with the development of integrated pest management strategies a priority for farmers and researchers alike. Identification of key aroma compounds responsible for cardamom flavor and sensory evaluation of quality based on aroma and flavor are crucial aspects of the market analysis.
Consumer preferences for different cardamom types vary significantly, with some favoring the stronger, pungent flavor of Malabar cardamom and others preferring the milder, sweet taste of Guatemalan cardamom. Assessing the economic viability of various cardamom farming systems and optimizing supply chain logistics for efficiency are essential for ensuring the competitiveness of the market. In conclusion, the market is a dynamic and complex industry, with various factors influencing its production, quality, and economic viability. From the impact of irrigation on yield to the optimization of cardamom drying methods, understanding these factors is essential for stakeholders seeking to capitalize on the market's growth potential.
What are the key market drivers leading to the rise in the adoption of Cardamom Industry?
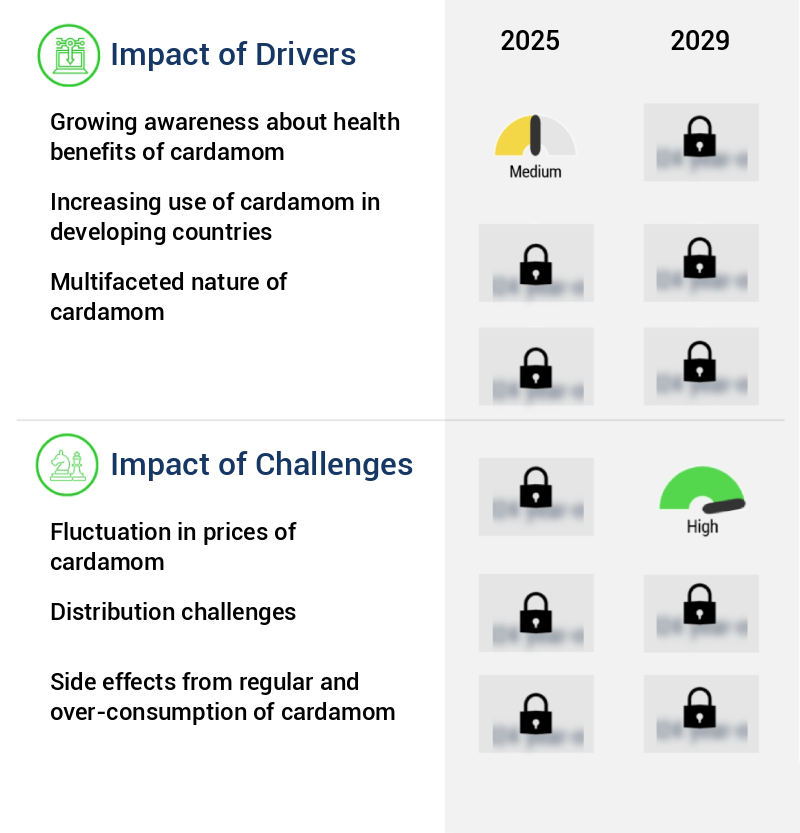
- The increasing recognition of cardamom's health advantages serves as the primary catalyst for market growth.
- Cardamom, recognized for its distinctive aroma and taste in culinary applications, has witnessed a surge in popularity due to its health benefits. The market is experiencing significant growth, driven by increasing consumer awareness and demand for this versatile spice. Cardamom's health advantages include its ability to enhance digestion, alleviating symptoms such as bloating, flatulence, and abdominal discomfort. It is also known to aid in the treatment of digestive issues like constipation, dysentery, acidity, stomach infections, and indigestion.
- These health benefits have contributed to the expanding usage of cardamom across various sectors, including food and beverage, pharmaceuticals, and cosmetics. Its therapeutic properties make it a valuable ingredient in traditional medicine and dietary supplements, further fueling market growth.
What are the market trends shaping the Cardamom Industry?
- The growing trend in the market is the increasing prominence of online shopping. This phenomenon is becoming increasingly significant.
- The online distribution of spices, including cardamom, has experienced significant growth in recent years. E-commerce platforms provide a vast selection of cardamom and related products from numerous brands. The expanding reach of the internet and smartphones globally has led to an increase in the number of e-commerce companies. As per International Telecommunication Union (ITU) statistics, approximately 67% of the world population, equating to around 5.4 billion individuals, were utilizing the internet in 2023.
- Consumers increasingly prefer purchasing cardamom online due to the personalized shopping assistance and tailored product recommendations based on cardamom's diverse applications. The convenience and accessibility of e-commerce platforms have significantly impacted the sales of cardamom across various sectors.
What challenges does the Cardamom Industry face during its growth?
- The volatile pricing of cardamom poses a significant challenge and hinders the growth of the industry.
- The market experiences significant price volatility due to unpredictable production patterns in major producers, such as Guatemala and India. Approximately 45% of the world's cardamom is produced in Guatemala. Overproduction in this region can lead to price depreciation, while underproduction contributes to price increases. For example, the Haveri cardamom garland, a renowned Indian tradition, faces challenges due to decreasing cardamom production in Kerala, Tamil Nadu, and specific areas of Karnataka.
- This inconsistent production pattern underlines the dynamic nature of the market, making it a crucial consideration for businesses in various sectors, including food and beverage, pharmaceuticals, and cosmetics.
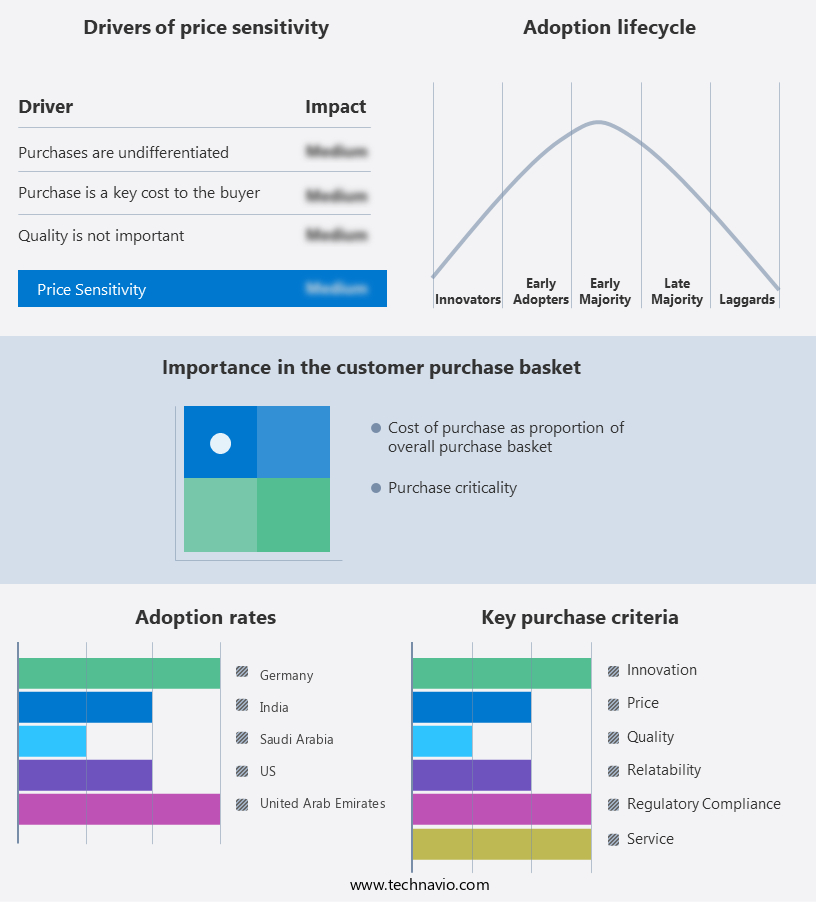
Exclusive Technavio Analysis on Customer Landscape
The cardamom market forecasting report includes the adoption lifecycle of the market, covering from the innovator's stage to the laggard's stage. It focuses on adoption rates in different regions based on penetration. Furthermore, the cardamom market report also includes key purchase criteria and drivers of price sensitivity to help companies evaluate and develop their market growth analysis strategies.
Customer Landscape of Cardamom Industry
Competitive Landscape
Companies are implementing various strategies, such as strategic alliances, cardamom market forecast, partnerships, mergers and acquisitions, geographical expansion, and product/service launches, to enhance their presence in the industry.
Als Spices - This company specializes in supplying high-quality cardamom in two forms: with outer covers and without.
The industry research and growth report includes detailed analyses of the competitive landscape of the market and information about key companies, including:
- Als Spices
- AR RAHMAN SPICES
- Biofoods Pvt. Ltd.
- Cardex SA
- Del Tropico SA
- E Silk Route Ventures Pvt. Ltd.
- EVEREST Food Products Pvt. Ltd.
- Greenfield Bio Plantations Pvt. Ltd.
- Imexa Inc.
- Kautilya Commodities
- KLG Spice
- MAS Enterprises Ltd.
- McCormick and Co. Inc.
- Organic Spices Inc.
- Pristine Organics Pvt. Ltd.
- ROYAL SPICES
- South Indian Green Cardamom Co. Ltd.
- Sujep wachstum Enterprises
- Synthite Industries Pvt. Ltd.
- Woodland Foods Ltd.
Qualitative and quantitative analysis of companies has been conducted to help clients understand the wider business environment as well as the strengths and weaknesses of key industry players. Data is qualitatively analyzed to categorize companies as pure play, category-focused, industry-focused, and diversified; it is quantitatively analyzed to categorize companies as dominant, leading, strong, tentative, and weak.
Recent Development and News in Cardamom Market
- In January 2024, Elite Spices, a leading global supplier of spices and herbs, announced the launch of its new premium line of organic cardamom, "Pure Origin," in collaboration with small-scale farmers in Guatemala (Elite Spices Press Release, 2024). This strategic partnership aimed to promote sustainable farming practices and ensure traceability from farm to table.
- In March 2024, the Indian Spices Board approved the implementation of a new quality certification program for cardamom, "Green Cardamom Plus," which sets higher standards for purity, aroma, and flavor (Indian Spices Board Press Release, 2024). This initiative is expected to boost the market's reputation and demand for high-quality cardamom.
- In May 2024, the Indian government announced a significant investment of INR 500 crore (USD 66 million) in the Cardamom Development Mission to improve production, processing, and marketing infrastructure (Ministry of Agriculture and Farmers Welfare, 2024). This initiative is expected to increase India's cardamom production and global market share.
- In April 2025, Armajaro, a leading commodity trader, acquired a 40% stake in Malabar Spices, a major cardamom processor and exporter based in India (Armajaro Press Release, 2025). This strategic acquisition will enable Armajaro to strengthen its position in the market and secure a steady supply of high-quality cardamom.
Dive into Technavio's robust research methodology, blending expert interviews, extensive data synthesis, and validated models for unparalleled Cardamom Market insights. See full methodology.
|
Market Scope |
|
|
Report Coverage |
Details |
|
Page number |
233 |
|
Base year |
2024 |
|
Historic period |
2019-2023 |
|
Forecast period |
2025-2029 |
|
Growth momentum & CAGR |
Accelerate at a CAGR of 3.1% |
|
Market growth 2025-2029 |
USD 195.3 million |
|
Market structure |
Fragmented |
|
YoY growth 2024-2025(%) |
3.0 |
|
Key countries |
China, India, US, Saudi Arabia, Germany, Japan, UK, United Arab Emirates, Italy, and South Korea |
|
Competitive landscape |
Leading Companies, Market Positioning of Companies, Competitive Strategies, and Industry Risks |
Research Analyst Overview
- Amidst the dynamic landscape of the global spice market, cardamom maintains a significant presence, with its unique flavor and aroma captivating palates worldwide. The cardamom value chain, encompassing cultivation, processing, and distribution, continues to evolve, shaped by various factors. Market access strategies have become increasingly crucial, with precision agriculture tools playing a pivotal role. Farmers employ these technologies to optimize their supply chain logistics, ensuring high-quality produce reaches consumers efficiently. In the realm of cardamom production, plant stress physiology and flavor profiling techniques are essential for maintaining optimal growing conditions and enhancing product value. Processing technologies, such as nutrient deficiency diagnosis and essential oil extraction, contribute significantly to the market's economic viability assessment.
- Value-added products, like organic farming methods and sustainable agriculture practices, cater to the growing consumer demand for healthier, eco-friendly options. Storage and preservation techniques are a critical aspect of the market, with microbial community analysis ensuring product quality and safety. Organic farming methods, which account for approximately 25% of global cardamom production, have gained popularity due to their positive environmental impact. The market faces challenges, including crop yield optimization, climate-smart agriculture practices, and integrated pest management strategies. By addressing these challenges through innovative farming practices and technological advancements, the industry continues to thrive and adapt. In the realm of research and development, genetic improvement programs and yield prediction models are key areas of focus, with remote sensing applications offering valuable insights into crop health and growth patterns.
- Quality control methods, such as aroma compound analysis and sensory evaluation, ensure consistent product quality and customer satisfaction. As the market continues to evolve, it remains an intriguing and dynamic sector, driven by a diverse range of factors and trends.
What are the Key Data Covered in this Cardamom Market Research and Growth Report?
-
What is the expected growth of the Cardamom Market between 2025 and 2029?
-
USD 195.3 million, at a CAGR of 3.1%
-
-
What segmentation does the market report cover?
-
The report is segmented by Product (Ingredients, Powder, and Liquid extract), Application (Food and beverages, Medical usage, and Others), Type (Green cardamom, Black cardamom, and White cardamom), Distribution Channel (Offline and Online), and Geography (APAC, Europe, Middle East and Africa, North America, and South America)
-
-
Which regions are analyzed in the report?
-
APAC, Europe, Middle East and Africa, North America, and South America
-
-
What are the key growth drivers and market challenges?
-
Growing awareness about health benefits of cardamom, Fluctuation in prices of cardamom
-
-
Who are the major players in the Cardamom Market?
-
Als Spices, AR RAHMAN SPICES, Biofoods Pvt. Ltd., Cardex SA, Del Tropico SA, E Silk Route Ventures Pvt. Ltd., EVEREST Food Products Pvt. Ltd., Greenfield Bio Plantations Pvt. Ltd., Imexa Inc., Kautilya Commodities, KLG Spice, MAS Enterprises Ltd., McCormick and Co. Inc., Organic Spices Inc., Pristine Organics Pvt. Ltd., ROYAL SPICES, South Indian Green Cardamom Co. Ltd., Sujep wachstum Enterprises, Synthite Industries Pvt. Ltd., and Woodland Foods Ltd.
-
Market Research Insights
- The market exhibits dynamic trends, driven by various factors influencing its production and demand. According to recent estimates, global cardamom production reached approximately 350,000 metric tons in 2021, with India and Guatemala accounting for over 60% of the total output. The average price for cardamom pods hovered around USD 5.5 per kilogram in 2021, showcasing a slight increase from the previous year. The cardamom industry faces numerous challenges, including climate change adaptation, microbial contamination risks, and the need for sustainable land management.
- To mitigate these issues, farmers employ various strategies such as crop rotation techniques, weed management, and drying methods comparison. Additionally, aroma preservation methods, terpenoid biosynthesis, and integrated nutrient management are crucial for maintaining optimal quality and profitability. As consumer preferences continue to evolve, market price fluctuations and input cost optimization remain essential for market success.
We can help! Our analysts can customize this cardamom market research report to meet your requirements.
 RIA -
RIA - 
