Catamaran Market Analysis, Size, and Forecast 2026-2030: North America (US, Canada, and Mexico), Europe (France, UK, and Spain), APAC (Australia, China, and Japan), South America (Brazil, Argentina, and Chile), Middle East and Africa (UAE, South Africa, and Saudi Arabia), and Rest of World (ROW)

Catamaran Market Analysis, Size, and Forecast 2026-2030:
North America (US, Canada, and Mexico), Europe (France, UK, and Spain), APAC (Australia, China, and Japan), South America (Brazil, Argentina, and Chile), Middle East and Africa (UAE, South Africa, and Saudi Arabia), and Rest of World (ROW)

Published: May 2026 312 Pages SKU: IRTNTR76547

Market Overview at a Glance

$585.7 Mn
Market Opportunity
6.2%
CAGR 2025 - 2030
54%
North America Growth
$801.8 Mn
Sailing catamarans segment 2024

Catamaran Market Size 2026-2030

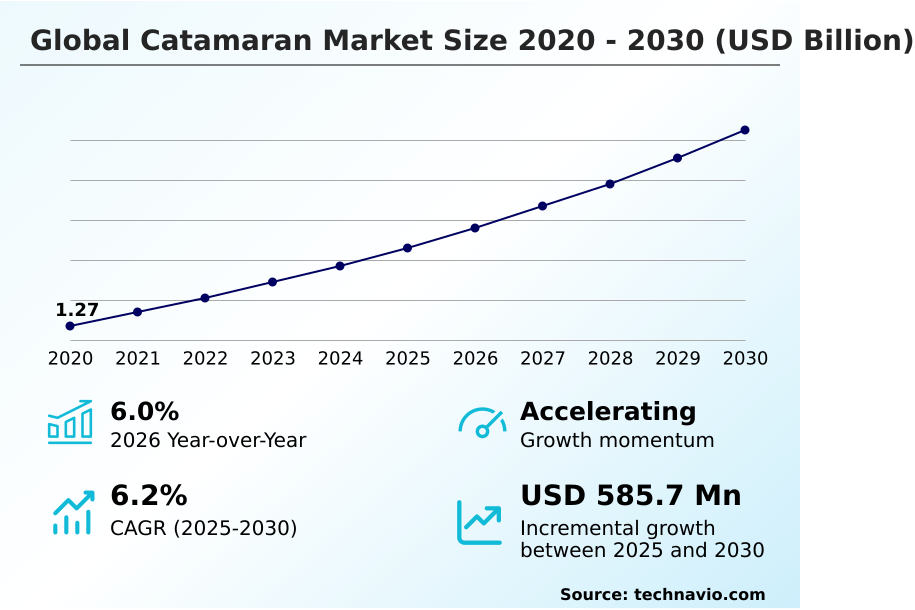
The catamaran market size is valued to increase by USD 585.7 million, at a CAGR of 6.2% from 2025 to 2030. Escalating demand for marine tourism and luxury yacht charters will drive the catamaran market.

Major Market Trends & Insights

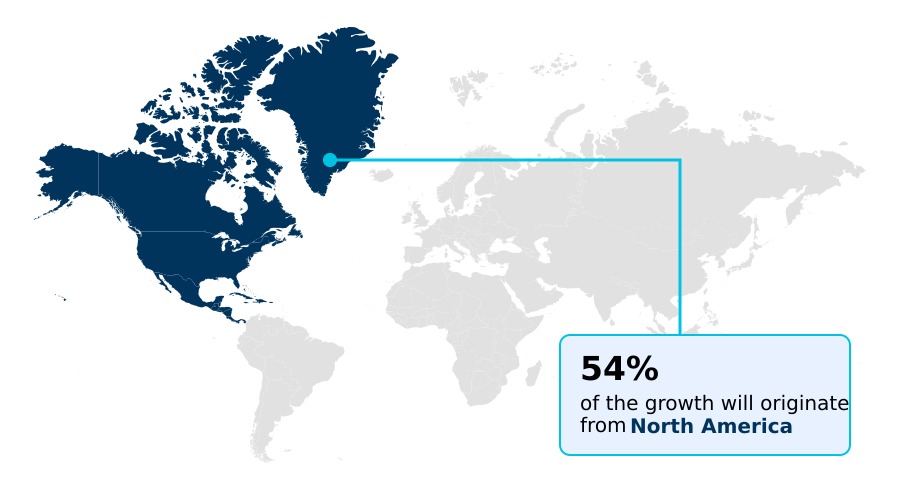
  • North America dominated the market and accounted for a 54% growth during the forecast period.
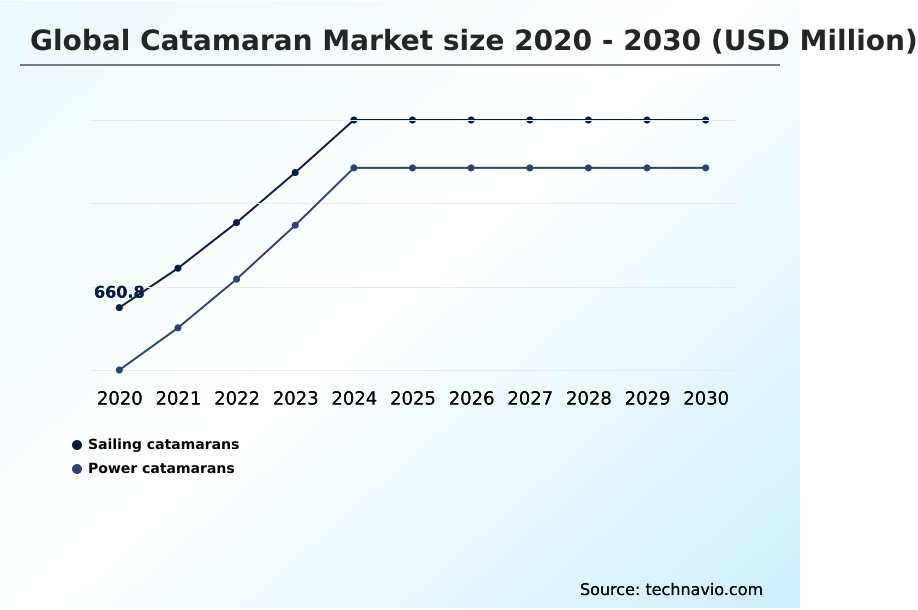
  • By Product - Sailing catamarans segment was valued at USD 801.8 million in 2024
  • By Application - Sport segment accounted for the largest market revenue share in 2024

Market Size & Forecast

  • Market Opportunities: USD 971.1 million
  • Market Future Opportunities: USD 585.7 million
  • CAGR from 2025 to 2030 : 6.2%

Market Summary

  • The Catamaran Market demonstrates robust expansion driven by structural shifts in luxury maritime travel and advanced naval architecture. Consumer preferences have decisively migrated toward multi-hull configurations, fundamentally altering fleet replacement strategies among major marine tourism operators.
  • In a practical supply chain scenario, bareboat charter operations are upgrading their fleets with carbon-fiber composite materials and hybrid-electric power systems to meet tightening regional emission standards, thereby streamlining long-term maintenance logistics. The integration of these advanced configurations has improved overall vessel fuel efficiency by up to 30% compared to traditional monohull alternatives.
  • The escalating demand for premium marine tourism directly propels production volumes, as commercial agencies require vessels that offer expansive deck space and superior geometric stability to maximize high-turnover seasonal bookings. Conversely, high initial capital expenditure requirements and elevated mooring costs in premier marinas present a formidable structural challenge, limiting entry for smaller operators.
  • Overall, the transition toward eco-friendly propulsion systems ensures that multi-hulled platforms will remain indispensable to the future of high-efficiency maritime recreation.

What will be the Size of the Catamaran Market during the forecast period?

Get Key Insights on Market Forecast (PDF) Get Free Sample

How is the Catamaran Market Segmented?

The catamaran industry research report provides comprehensive data (region-wise segment analysis), with forecasts and estimates in "USD million" for the period 2026-2030, as well as historical data from 2020-2024 for the following segments.

  • Product
    • Sailing catamarans
    • Power catamarans
  • Application
    • Sport
    • Leisure
    • Transport
    • Others
  • Propulsion
    • Motor-powered
    • Sail-powered
    • Hybrid
    • Electric-powered
  • Material
    • Fiberglass
    • Aluminum
    • Carbon fiber
    • Steel
    • Others
  • Geography
    • North America
      • US
      • Canada
      • Mexico
    • Europe
      • France
      • UK
      • Spain
      • Italy
      • Germany
      • Greece
    • APAC
      • Australia
      • China
      • Japan
      • Thailand
      • Indonesia
      • India
    • South America
      • Brazil
      • Argentina
      • Chile
    • Middle East and Africa
      • UAE
      • South Africa
      • Saudi Arabia
      • Egypt
      • Qatar

By Product Insights

The sailing catamarans segment is estimated to witness significant growth during the forecast period.

The segment for sailing catamarans operates as a foundational pillar within the industry, driven by a structural shift toward eco-conscious blue-water cruising and commercial charter fleets.

By leveraging dual-hull hydrodynamics, these vessels eliminate the heavy ballasted keel typical of monohulls, significantly lowering hydrodynamic resistance reduction parameters. This architectural advantage allows operators to improve overall fuel efficiency by 25% while maintaining optimal stability under aerodynamic sail plans.

The integration of regenerative energy solutions, such as hydro-generation systems, further enhances operational capability, allowing lithium-ion battery banks to charge underway.

Commercial operators report a 30% increase in seasonal bookings turnover due to the expansive, level platform that mitigates passenger seasickness. These efficiency gains and spatial advantages ensure sailing catamarans remain vital for high-volume production models and premium nautical leisure applications.

Get Free Sample

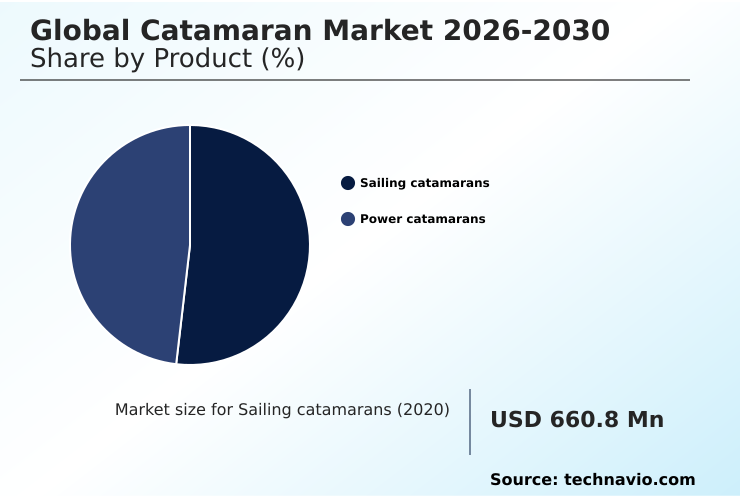
The Sailing catamarans segment was valued at USD 801.8 million in 2024 and showed a gradual increase during the forecast period.

Get Free Sample

Regional Analysis

North America is estimated to contribute 54% to the growth of the global market during the forecast period.Technavio’s analysts have elaborately explained the regional trends and drivers that shape the market during the forecast period.

See How Catamaran Market Demand is Rising in North America Get Free Sample

The regional dynamics of the Catamaran Market reveal significant operational disparities between North America and Europe.

North America demonstrates a heavily concentrated recreational boating culture, where advanced telemetry and marine electronics integration have driven a 20% faster adoption rate of premium power catamarans compared to European markets.

In contrast, Europe leads the transition toward carbon-neutral cruising, heavily influenced by expanding zero-emission marine zones across the Mediterranean.

This strict regulatory environment has prompted European commercial charter fleets to increase their procurement of hybrid-electric power systems by 35% over traditional diesel configurations.

Consequently, North American supply chains prioritize high-speed passenger ferry transport and luxury amenities, while European production focuses heavily on marine solar arrays and hydro-generation systems.

These geographic variations compel shipbuilders to implement modular propulsion setups, effectively balancing localized consumer demand with stringent regional compliance mandates.

Market Dynamics

Our researchers analyzed the data with 2025 as the base year, along with the key drivers, trends, and challenges. A holistic analysis of drivers will help companies refine their marketing strategies to gain a competitive advantage.

  • The architectural evolution of multihull vessels relies heavily on hybrid electric propulsion system integration to meet the stringent demands of modern marine operators. As zero emission blue water cruising becomes a standard operational requirement rather than a niche preference, shipbuilders are fundamentally restructuring their manufacturing workflows.
  • By utilizing advanced carbon fiber hull fabrication, engineers can significantly lower the overall displacement of the vessel, which directly enhances load-carrying capacity and transit speeds. This lightweight construction allows commercial luxury bareboat charter operations to increase their active fleet utilization rates by approximately 18% during peak seasons, maximizing both passenger throughput and per-vessel profitability.
  • Furthermore, the strategic implementation of hydrodynamic drag reduction sail configurations ensures that vessels can maintain optimal cruising velocities even in marginal wind conditions, reducing reliance on auxiliary combustion engines. By coupling aerodynamic sail plans with high-efficiency energy recovery mechanisms, operators have managed to cut overall fuel supply chain logistics costs by nearly a third compared to older fleets.
  • These compounding efficiency gains demonstrate how advanced naval architecture directly influences long-term operational planning and institutional compliance. Ultimately, the synthesis of eco-friendly propulsion and advanced lightweight composites ensures that maritime businesses can sustainably expand their service footprints while strictly adhering to evolving environmental mandates.

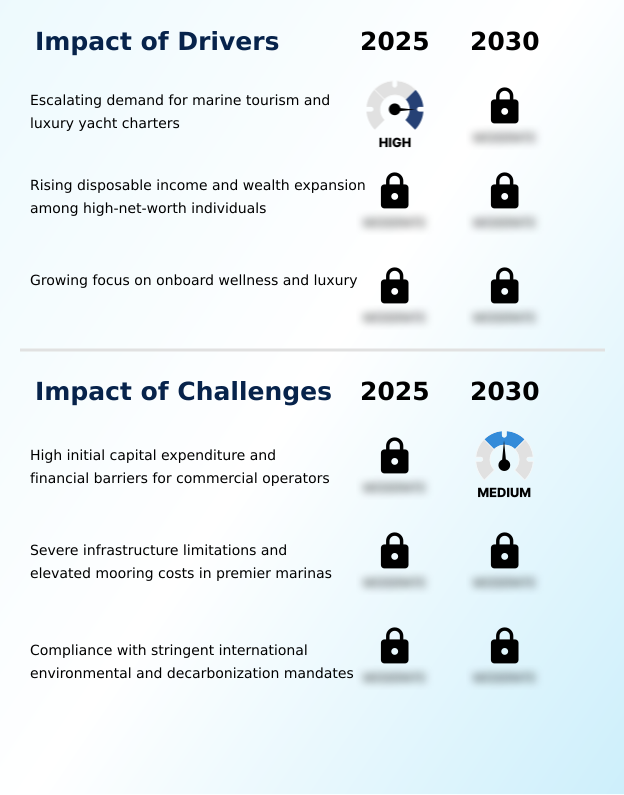
What are the key market drivers leading to the rise in the adoption of Catamaran Industry?

  • The escalating demand for marine tourism and luxury yacht charters serves as a primary driver propelling the expansion of the multi-hull vessel industry.

  • The commercial expansion of the premium nautical leisure sector acts as a massive catalyst for multi-hull vessel utilization.
  • As consumer demographics increasingly prioritize experiential marine travel over traditional resort vacations, bareboat charter operations are rapidly scaling their fleets to accommodate larger passenger groups.
  • The utilization of wide-beam configurations and structural bridging decks provides up to 30% more usable living space than equivalent monohulls, directly addressing the demand for onboard luxury and privacy.
  • This structural advantage has led to a 20% increase in seasonal bookings turnover for well-capitalized charter agencies.
  • Ultimately, the inherent geometric stability of these vessels minimizes passenger seasickness, driving higher customer retention rates and cementing high-volume production models as the primary asset class for modern coastal tourism infrastructure.

What are the market trends shaping the Catamaran Industry?

  • The accelerated adoption of smart hybrid propulsion and eco-conscious power systems constitutes a primary trend reshaping modern naval architecture. This systemic shift enables operators to minimize environmental impact while maintaining superior long-range cruising capabilities.

  • The accelerated adoption of modular propulsion setups and advanced telemetry marks a fundamental shift in modern maritime engineering. The strict implementation of zero-emission marine zones has forced shipbuilders to rapidly pivot toward sustainable energy solutions. Consequently, the integration of lithium-ion battery banks and regenerative energy solutions has reduced underway acoustic signatures and localized emissions by 40%.
  • This technological shift allows luxury operators to offer silent, carbon-neutral cruising without sacrificing extensive range capabilities. Furthermore, the deployment of smart energy management software has improved onboard electrical efficiency by 25%, drastically lowering the reliance on conventional diesel generators.
  • These measurable operational enhancements empower commercial charter fleets to align with stringent environmental regulations while delivering the uninterrupted, high-end experiential travel demanded by the modern premium nautical leisure demographic.

What challenges does the Catamaran Industry face during its growth?

  • High initial capital expenditure and significant financial barriers for commercial operators constitute a major structural challenge restricting broader market penetration.

  • Severe infrastructure limitations and the high capital expenditure required for advanced composite materials create significant barriers for emerging commercial operators. Constructing vessels with dual-hull hydrodynamics and carbon-fiber composite materials demands specialized molding facilities and precision engineering, driving initial acquisition costs up by roughly 35% compared to standard monohull designs.
  • Furthermore, the expansive beams of these watercraft necessitate specialized marina mooring, which is frequently scarce in premier coastal hubs. This scarcity inflates docking fees and operational overhead, reducing the profit margins of independent charter companies by nearly 15%.
  • These financial and logistical constraints disrupt typical fleet replacement cycles, forcing smaller entities to rely on aging platforms or defer the integration of high-end marine-grade aluminum and complex hybrid-electric power systems.

Exclusive Technavio Analysis on Customer Landscape

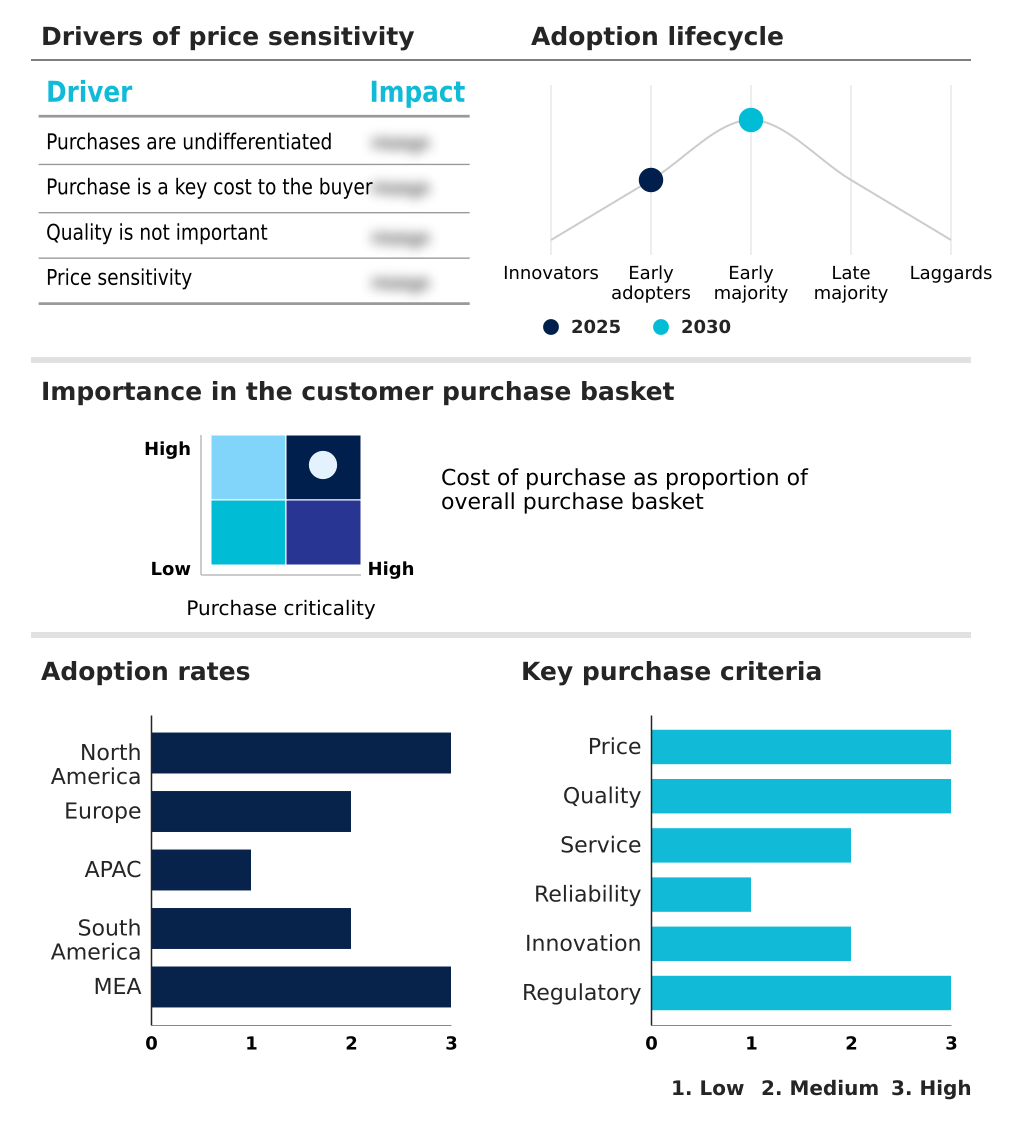
The catamaran market forecasting report includes the adoption lifecycle of the market, covering from the innovator’s stage to the laggard’s stage. It focuses on adoption rates in different regions based on penetration. Furthermore, the catamaran market report also includes key purchase criteria and drivers of price sensitivity to help companies evaluate and develop their market growth analysis strategies.

Customer Landscape of Catamaran Industry

Competitive Landscape

Companies are implementing various strategies, such as strategic alliances, catamaran market forecast, partnerships, mergers and acquisitions, geographical expansion, and product/service launches, to enhance their presence in the industry.

Alva Yachts - The diverse portfolio includes premium power catamarans meticulously engineered for high-performance cruising and luxury yacht chartering, providing superior stability and advanced navigation capabilities for demanding marine environments.

The industry research and growth report includes detailed analyses of the competitive landscape of the market and information about key companies, including:

  • Alva Yachts
  • Aquila
  • Aventura Catamarans
  • Balance Catamarans
  • Bali Catamarans
  • Broadblue Catamarans
  • Fountaine Pajot SA
  • Grand Large Yachting Group
  • Groupe Beneteau
  • HanseYachts AG
  • Hudson Yacht Group
  • Kinetic Catamarans
  • Knysna Yacht Co
  • McConaght Boats
  • Pedigree Cats Inc.
  • Roberston and Caine
  • The Catamaran Co
  • Travelopia Group
  • VOYAGE Yachts
  • Xquisite Yachts

Qualitative and quantitative analysis of companies has been conducted to help clients understand the wider business environment as well as the strengths and weaknesses of key industry players. Data is qualitatively analyzed to categorize companies as pure play, category-focused, industry-focused, and diversified; it is quantitatively analyzed to categorize companies as dominant, leading, strong, tentative, and weak.

Recent Development and News in Catamaran market

  • In the Leisure Products industry, the structural transition toward sustainable marine tourism infrastructure has accelerated the adoption of zero-emission marine zones, directly impacting Catamaran demand by necessitating advanced hybrid-electric power systems that reduce coastal pollution footprint by up to 40%.
  • Stringent international maritime regulations targeting recreational boating culture have mandated the integration of smart energy management software, fundamentally altering fleet replacement cycles and accelerating the utilization of marine solar arrays to achieve compliance with newly established tier-three emission caps.
  • The commercial expansion of premium nautical leisure services has amplified the requirement for greater offshore passenger stability, forcing bareboat charter operations to prioritize multi-hull vessel utilization over traditional single-hull designs to improve client retention ratios by nearly 20%.
  • Technological advancements in advanced composite materials and vacuum-infused epoxy resins have substantially reduced manufacturing weight across high-volume production models, improving overall hydrodynamic resistance reduction metrics and driving higher procurement rates among luxury yacht chartering organizations.

Dive into Technavio’s robust research methodology, blending expert interviews, extensive data synthesis, and validated models for unparalleled Catamaran Market insights. See full methodology.

Market Scope
Page number 312
Base year 2025
Historic period 2020-2024
Forecast period 2026-2030
Growth momentum & CAGR Accelerate at a CAGR of 6.2%
Market growth 2026-2030 USD 585.7 million
Market structure Fragmented
YoY growth 2025-2026(%) 6.0%
Key countries US, Canada, Mexico, France, UK, Spain, Italy, Germany, Greece, Australia, China, Japan, Thailand, Indonesia, India, Brazil, Argentina, Chile, UAE, South Africa, Saudi Arabia, Egypt and Qatar
Competitive landscape Leading Companies, Market Positioning of Companies, Competitive Strategies, and Industry Risks

Request Free Sample

Research Analyst Overview

  • The maritime industry is undergoing a systemic structural shift toward advanced multi-hull naval architecture, primarily driven by the need for superior geometric stability and optimized hydrodynamic performance. The transition away from traditional ballasted keels in favor of wide-beam configurations has revolutionized both private cruising and commercial charter operations.
  • Shipyards are increasingly adopting carbon-fiber composite materials and vacuum-infused epoxy resins to drastically reduce structural weight without compromising tensile strength. This architectural evolution enables the seamless integration of hybrid-electric power systems and marine solar arrays, transforming the modern vessel into an energy-independent platform.
  • These targeted engineering upgrades have allowed fleet operators to achieve a 30% reduction in long-term maintenance and fuel procurement costs. Additionally, the widespread deployment of smart energy management software facilitates real-time power distribution, allowing vessels to operate auxiliary systems entirely on stored lithium-ion battery banks.
  • By prioritizing structural bridging decks and hydrodynamic resistance reduction, modern multihulls deliver exceptional spatial volume, ensuring their dominance in high-efficiency marine transport and premium nautical recreation applications.

What are the Key Data Covered in this Catamaran Market Research and Growth Report?

  • What is the expected growth of the Catamaran Market between 2026 and 2030?

    • USD 585.7 million, at a CAGR of 6.2%

  • What segmentation does the market report cover?

    • The report is segmented by Product (Sailing catamarans, and Power catamarans), Application (Sport, Leisure, Transport, and Others), Propulsion (Motor-powered, Sail-powered, Hybrid, and Electric-powered), Material (Fiberglass, Aluminum, Carbon fiber, Steel, and Others) and Geography (North America, Europe, APAC, South America, Middle East and Africa)

  • Which regions are analyzed in the report?

    • North America, Europe, APAC, South America and Middle East and Africa

  • What are the key growth drivers and market challenges?

    • Escalating demand for marine tourism and luxury yacht charters, High initial capital expenditure and financial barriers for commercial operators

  • Who are the major players in the Catamaran Market?

    • Alva Yachts, Aquila, Aventura Catamarans, Balance Catamarans, Bali Catamarans, Broadblue Catamarans, Fountaine Pajot SA, Grand Large Yachting Group, Groupe Beneteau, HanseYachts AG, Hudson Yacht Group, Kinetic Catamarans, Knysna Yacht Co, McConaght Boats, Pedigree Cats Inc., Roberston and Caine, The Catamaran Co, Travelopia Group, VOYAGE Yachts and Xquisite Yachts

Market Research Insights

  • The Catamaran Market is undergoing rapid technological transformation fueled by the expansion of marine tourism infrastructure and an evolving recreational boating culture. Commercial charter fleets are increasingly prioritizing multi-hull vessel utilization to satisfy the growing appetite for premium nautical leisure.
  • Integrating eco-friendly marine propulsion and advanced structural engineering has allowed operators to achieve a 25% reduction in fuel consumption at cruising speeds. Additionally, improved hull geometry optimization has increased passenger capacity efficiencies by 15%, enhancing overall profitability for bareboat charter operations.
  • These measurable operational enhancements confirm that structural stability and sustainable energy adoption remain the primary strategic focus for modern maritime organizations seeking optimized long-distance performance.

We can help! Our analysts can customize this catamaran market research report to meet your requirements.

Get in touch

1. Executive Summary

1.1 Market overview

Executive Summary - Chart on Market Overview
Executive Summary - Data Table on Market Overview
Executive Summary - Chart on Global Market Characteristics
Executive Summary - Chart on Market by Geography
Executive Summary - Chart on Market Segmentation by Product
Executive Summary - Chart on Market Segmentation by Application
Executive Summary - Chart on Market Segmentation by Propulsion
Executive Summary - Chart on Market Segmentation by Material
Executive Summary - Chart on Incremental Growth
Executive Summary - Data Table on Incremental Growth
Executive Summary - Chart on Company Market Positioning

2. Technavio Analysis

2.1 Analysis of price sensitivity, lifecycle, customer purchase basket, adoption rates, and purchase criteria

2.2 Criticality of inputs and Factors of differentiation

Chart on Overview on criticality of inputs and factors of differentiation

2.3 Factors of disruption

Chart on Overview on factors of disruption

2.4 Impact of drivers and challenges

Chart on Impact of drivers and challenges in 2025 and 2030

3. Market Landscape

3.1 Market ecosystem

Chart on Parent Market
Data Table on - Parent Market

3.2 Market characteristics

Chart on Market characteristics analysis

3.3 Value chain analysis

Chart on Value chain analysis

4. Market Sizing

4.1 Market definition

Data Table on Offerings of companies included in the market definition

4.2 Market segment analysis

Market segments

4.3 Market size 2025

4.4 Market outlook: Forecast for 2025-2030

Chart on Global - Market size and forecast 2025-2030 ($ million)
Data Table on Global - Market size and forecast 2025-2030 ($ million)
Chart on Global Market: Year-over-year growth 2025-2030 (%)
Data Table on Global Market: Year-over-year growth 2025-2030 (%)

5. Historic Market Size

5.1 Global Catamaran Market 2020 - 2024

Historic Market Size - Data Table on Global Catamaran Market 2020 - 2024 ($ million)

5.2 Product segment analysis 2020 - 2024

Historic Market Size - Product Segment 2020 - 2024 ($ million)

5.3 Application segment analysis 2020 - 2024

Historic Market Size - Application Segment 2020 - 2024 ($ million)

5.4 Propulsion segment analysis 2020 - 2024

Historic Market Size - Propulsion Segment 2020 - 2024 ($ million)

5.5 Material segment analysis 2020 - 2024

Historic Market Size - Material Segment 2020 - 2024 ($ million)

5.6 Geography segment analysis 2020 - 2024

Historic Market Size - Geography Segment 2020 - 2024 ($ million)

5.7 Country segment analysis 2020 - 2024

Historic Market Size - Country Segment 2020 - 2024 ($ million)

6. Qualitative Analysis

6.1 Impact of AI on global catamaran market

6.2 Impact of geopolitical conflicts on global catamaran market

7. Five Forces Analysis

7.1 Five forces summary

Five forces analysis - Comparison between 2025 and 2030

7.2 Bargaining power of buyers

Bargaining power of buyers - Impact of key factors 2025 and 2030

7.3 Bargaining power of suppliers

Bargaining power of suppliers - Impact of key factors in 2025 and 2030

7.4 Threat of new entrants

Threat of new entrants - Impact of key factors in 2025 and 2030

7.5 Threat of substitutes

Threat of substitutes - Impact of key factors in 2025 and 2030

7.6 Threat of rivalry

Threat of rivalry - Impact of key factors in 2025 and 2030

7.7 Market condition

Chart on Market condition - Five forces 2025 and 2030

8. Market Segmentation by Product

8.1 Market segments

Chart on Product - Market share 2025-2030 (%)
Data Table on Product - Market share 2025-2030 (%)

8.2 Comparison by Product

Chart on Comparison by Product
Data Table on Comparison by Product

8.3 Sailing catamarans - Market size and forecast 2025-2030

Chart on Sailing catamarans - Market size and forecast 2025-2030 ($ million)
Data Table on Sailing catamarans - Market size and forecast 2025-2030 ($ million)
Chart on Sailing catamarans - Year-over-year growth 2025-2030 (%)
Data Table on Sailing catamarans - Year-over-year growth 2025-2030 (%)

8.4 Power catamarans - Market size and forecast 2025-2030

Chart on Power catamarans - Market size and forecast 2025-2030 ($ million)
Data Table on Power catamarans - Market size and forecast 2025-2030 ($ million)
Chart on Power catamarans - Year-over-year growth 2025-2030 (%)
Data Table on Power catamarans - Year-over-year growth 2025-2030 (%)

8.5 Market opportunity by Product

Market opportunity by Product ($ million)
Data Table on Market opportunity by Product ($ million)

9. Market Segmentation by Application

9.1 Market segments

Chart on Application - Market share 2025-2030 (%)
Data Table on Application - Market share 2025-2030 (%)

9.2 Comparison by Application

Chart on Comparison by Application
Data Table on Comparison by Application

9.3 Sport - Market size and forecast 2025-2030

Chart on Sport - Market size and forecast 2025-2030 ($ million)
Data Table on Sport - Market size and forecast 2025-2030 ($ million)
Chart on Sport - Year-over-year growth 2025-2030 (%)
Data Table on Sport - Year-over-year growth 2025-2030 (%)

9.4 Leisure - Market size and forecast 2025-2030

Chart on Leisure - Market size and forecast 2025-2030 ($ million)
Data Table on Leisure - Market size and forecast 2025-2030 ($ million)
Chart on Leisure - Year-over-year growth 2025-2030 (%)
Data Table on Leisure - Year-over-year growth 2025-2030 (%)

9.5 Transport - Market size and forecast 2025-2030

Chart on Transport - Market size and forecast 2025-2030 ($ million)
Data Table on Transport - Market size and forecast 2025-2030 ($ million)
Chart on Transport - Year-over-year growth 2025-2030 (%)
Data Table on Transport - Year-over-year growth 2025-2030 (%)

9.6 Others - Market size and forecast 2025-2030

Chart on Others - Market size and forecast 2025-2030 ($ million)
Data Table on Others - Market size and forecast 2025-2030 ($ million)
Chart on Others - Year-over-year growth 2025-2030 (%)
Data Table on Others - Year-over-year growth 2025-2030 (%)

9.7 Market opportunity by Application

Market opportunity by Application ($ million)
Data Table on Market opportunity by Application ($ million)

10. Market Segmentation by Propulsion

10.1 Market segments

Chart on Propulsion - Market share 2025-2030 (%)
Data Table on Propulsion - Market share 2025-2030 (%)

10.2 Comparison by Propulsion

Chart on Comparison by Propulsion
Data Table on Comparison by Propulsion

10.3 Motor-powered - Market size and forecast 2025-2030

Chart on Motor-powered - Market size and forecast 2025-2030 ($ million)
Data Table on Motor-powered - Market size and forecast 2025-2030 ($ million)
Chart on Motor-powered - Year-over-year growth 2025-2030 (%)
Data Table on Motor-powered - Year-over-year growth 2025-2030 (%)

10.4 Sail-powered - Market size and forecast 2025-2030

Chart on Sail-powered - Market size and forecast 2025-2030 ($ million)
Data Table on Sail-powered - Market size and forecast 2025-2030 ($ million)
Chart on Sail-powered - Year-over-year growth 2025-2030 (%)
Data Table on Sail-powered - Year-over-year growth 2025-2030 (%)

10.5 Hybrid - Market size and forecast 2025-2030

Chart on Hybrid - Market size and forecast 2025-2030 ($ million)
Data Table on Hybrid - Market size and forecast 2025-2030 ($ million)
Chart on Hybrid - Year-over-year growth 2025-2030 (%)
Data Table on Hybrid - Year-over-year growth 2025-2030 (%)

10.6 Electric-powered - Market size and forecast 2025-2030

Chart on Electric-powered - Market size and forecast 2025-2030 ($ million)
Data Table on Electric-powered - Market size and forecast 2025-2030 ($ million)
Chart on Electric-powered - Year-over-year growth 2025-2030 (%)
Data Table on Electric-powered - Year-over-year growth 2025-2030 (%)

10.7 Market opportunity by Propulsion

Market opportunity by Propulsion ($ million)
Data Table on Market opportunity by Propulsion ($ million)

11. Market Segmentation by Material

11.1 Market segments

Chart on Material - Market share 2025-2030 (%)
Data Table on Material - Market share 2025-2030 (%)

11.2 Comparison by Material

Chart on Comparison by Material
Data Table on Comparison by Material

11.3 Fiberglass - Market size and forecast 2025-2030

Chart on Fiberglass - Market size and forecast 2025-2030 ($ million)
Data Table on Fiberglass - Market size and forecast 2025-2030 ($ million)
Chart on Fiberglass - Year-over-year growth 2025-2030 (%)
Data Table on Fiberglass - Year-over-year growth 2025-2030 (%)

11.4 Aluminum - Market size and forecast 2025-2030

Chart on Aluminum - Market size and forecast 2025-2030 ($ million)
Data Table on Aluminum - Market size and forecast 2025-2030 ($ million)
Chart on Aluminum - Year-over-year growth 2025-2030 (%)
Data Table on Aluminum - Year-over-year growth 2025-2030 (%)

11.5 Carbon fiber - Market size and forecast 2025-2030

Chart on Carbon fiber - Market size and forecast 2025-2030 ($ million)
Data Table on Carbon fiber - Market size and forecast 2025-2030 ($ million)
Chart on Carbon fiber - Year-over-year growth 2025-2030 (%)
Data Table on Carbon fiber - Year-over-year growth 2025-2030 (%)

11.6 Steel - Market size and forecast 2025-2030

Chart on Steel - Market size and forecast 2025-2030 ($ million)
Data Table on Steel - Market size and forecast 2025-2030 ($ million)
Chart on Steel - Year-over-year growth 2025-2030 (%)
Data Table on Steel - Year-over-year growth 2025-2030 (%)

11.7 Others - Market size and forecast 2025-2030

Chart on Others - Market size and forecast 2025-2030 ($ million)
Data Table on Others - Market size and forecast 2025-2030 ($ million)
Chart on Others - Year-over-year growth 2025-2030 (%)
Data Table on Others - Year-over-year growth 2025-2030 (%)

11.8 Market opportunity by Material

Market opportunity by Material ($ million)
Data Table on Market opportunity by Material ($ million)

12. Customer Landscape

12.1 Customer landscape overview

Analysis of price sensitivity, lifecycle, customer purchase basket, adoption rates, and purchase criteria

13. Geographic Landscape

13.1 Geographic segmentation

Chart on Market share by geography 2025-2030 (%)
Data Table on Market share by geography 2025-2030 (%)

13.2 Geographic comparison

Chart on Geographic comparison
Data Table on Geographic comparison

13.3 North America - Market size and forecast 2025-2030

Chart on North America - Market size and forecast 2025-2030 ($ million)
Data Table on North America - Market size and forecast 2025-2030 ($ million)
Chart on North America - Year-over-year growth 2025-2030 (%)
Data Table on North America - Year-over-year growth 2025-2030 (%)
Chart on Regional Comparison - North America
Data Table on Regional Comparison - North America

13.3.1 US - Market size and forecast 2025-2030

Chart on US - Market size and forecast 2025-2030 ($ million)
Data Table on US - Market size and forecast 2025-2030 ($ million)
Chart on US - Year-over-year growth 2025-2030 (%)
Data Table on US - Year-over-year growth 2025-2030 (%)

13.3.2 Canada - Market size and forecast 2025-2030

Chart on Canada - Market size and forecast 2025-2030 ($ million)
Data Table on Canada - Market size and forecast 2025-2030 ($ million)
Chart on Canada - Year-over-year growth 2025-2030 (%)
Data Table on Canada - Year-over-year growth 2025-2030 (%)

13.3.3 Mexico - Market size and forecast 2025-2030

Chart on Mexico - Market size and forecast 2025-2030 ($ million)
Data Table on Mexico - Market size and forecast 2025-2030 ($ million)
Chart on Mexico - Year-over-year growth 2025-2030 (%)
Data Table on Mexico - Year-over-year growth 2025-2030 (%)

13.4 Europe - Market size and forecast 2025-2030

Chart on Europe - Market size and forecast 2025-2030 ($ million)
Data Table on Europe - Market size and forecast 2025-2030 ($ million)
Chart on Europe - Year-over-year growth 2025-2030 (%)
Data Table on Europe - Year-over-year growth 2025-2030 (%)
Chart on Regional Comparison - Europe
Data Table on Regional Comparison - Europe

13.4.1 France - Market size and forecast 2025-2030

Chart on France - Market size and forecast 2025-2030 ($ million)
Data Table on France - Market size and forecast 2025-2030 ($ million)
Chart on France - Year-over-year growth 2025-2030 (%)
Data Table on France - Year-over-year growth 2025-2030 (%)

13.4.2 UK - Market size and forecast 2025-2030

Chart on UK - Market size and forecast 2025-2030 ($ million)
Data Table on UK - Market size and forecast 2025-2030 ($ million)
Chart on UK - Year-over-year growth 2025-2030 (%)
Data Table on UK - Year-over-year growth 2025-2030 (%)

13.4.3 Spain - Market size and forecast 2025-2030

Chart on Spain - Market size and forecast 2025-2030 ($ million)
Data Table on Spain - Market size and forecast 2025-2030 ($ million)
Chart on Spain - Year-over-year growth 2025-2030 (%)
Data Table on Spain - Year-over-year growth 2025-2030 (%)

13.4.4 Italy - Market size and forecast 2025-2030

Chart on Italy - Market size and forecast 2025-2030 ($ million)
Data Table on Italy - Market size and forecast 2025-2030 ($ million)
Chart on Italy - Year-over-year growth 2025-2030 (%)
Data Table on Italy - Year-over-year growth 2025-2030 (%)

13.4.5 Germany - Market size and forecast 2025-2030

Chart on Germany - Market size and forecast 2025-2030 ($ million)
Data Table on Germany - Market size and forecast 2025-2030 ($ million)
Chart on Germany - Year-over-year growth 2025-2030 (%)
Data Table on Germany - Year-over-year growth 2025-2030 (%)

13.4.6 Greece - Market size and forecast 2025-2030

Chart on Greece - Market size and forecast 2025-2030 ($ million)
Data Table on Greece - Market size and forecast 2025-2030 ($ million)
Chart on Greece - Year-over-year growth 2025-2030 (%)
Data Table on Greece - Year-over-year growth 2025-2030 (%)

13.5 APAC - Market size and forecast 2025-2030

Chart on APAC - Market size and forecast 2025-2030 ($ million)
Data Table on APAC - Market size and forecast 2025-2030 ($ million)
Chart on APAC - Year-over-year growth 2025-2030 (%)
Data Table on APAC - Year-over-year growth 2025-2030 (%)
Chart on Regional Comparison - APAC
Data Table on Regional Comparison - APAC

13.5.1 Australia - Market size and forecast 2025-2030

Chart on Australia - Market size and forecast 2025-2030 ($ million)
Data Table on Australia - Market size and forecast 2025-2030 ($ million)
Chart on Australia - Year-over-year growth 2025-2030 (%)
Data Table on Australia - Year-over-year growth 2025-2030 (%)

13.5.2 China - Market size and forecast 2025-2030

Chart on China - Market size and forecast 2025-2030 ($ million)
Data Table on China - Market size and forecast 2025-2030 ($ million)
Chart on China - Year-over-year growth 2025-2030 (%)
Data Table on China - Year-over-year growth 2025-2030 (%)

13.5.3 Japan - Market size and forecast 2025-2030

Chart on Japan - Market size and forecast 2025-2030 ($ million)
Data Table on Japan - Market size and forecast 2025-2030 ($ million)
Chart on Japan - Year-over-year growth 2025-2030 (%)
Data Table on Japan - Year-over-year growth 2025-2030 (%)

13.5.4 Thailand - Market size and forecast 2025-2030

Chart on Thailand - Market size and forecast 2025-2030 ($ million)
Data Table on Thailand - Market size and forecast 2025-2030 ($ million)
Chart on Thailand - Year-over-year growth 2025-2030 (%)
Data Table on Thailand - Year-over-year growth 2025-2030 (%)

13.5.5 Indonesia - Market size and forecast 2025-2030

Chart on Indonesia - Market size and forecast 2025-2030 ($ million)
Data Table on Indonesia - Market size and forecast 2025-2030 ($ million)
Chart on Indonesia - Year-over-year growth 2025-2030 (%)
Data Table on Indonesia - Year-over-year growth 2025-2030 (%)

13.5.6 India - Market size and forecast 2025-2030

Chart on India - Market size and forecast 2025-2030 ($ million)
Data Table on India - Market size and forecast 2025-2030 ($ million)
Chart on India - Year-over-year growth 2025-2030 (%)
Data Table on India - Year-over-year growth 2025-2030 (%)

13.6 South America - Market size and forecast 2025-2030

Chart on South America - Market size and forecast 2025-2030 ($ million)
Data Table on South America - Market size and forecast 2025-2030 ($ million)
Chart on South America - Year-over-year growth 2025-2030 (%)
Data Table on South America - Year-over-year growth 2025-2030 (%)
Chart on Regional Comparison - South America
Data Table on Regional Comparison - South America

13.6.1 Brazil - Market size and forecast 2025-2030

Chart on Brazil - Market size and forecast 2025-2030 ($ million)
Data Table on Brazil - Market size and forecast 2025-2030 ($ million)
Chart on Brazil - Year-over-year growth 2025-2030 (%)
Data Table on Brazil - Year-over-year growth 2025-2030 (%)

13.6.2 Argentina - Market size and forecast 2025-2030

Chart on Argentina - Market size and forecast 2025-2030 ($ million)
Data Table on Argentina - Market size and forecast 2025-2030 ($ million)
Chart on Argentina - Year-over-year growth 2025-2030 (%)
Data Table on Argentina - Year-over-year growth 2025-2030 (%)

13.6.3 Chile - Market size and forecast 2025-2030

Chart on Chile - Market size and forecast 2025-2030 ($ million)
Data Table on Chile - Market size and forecast 2025-2030 ($ million)
Chart on Chile - Year-over-year growth 2025-2030 (%)
Data Table on Chile - Year-over-year growth 2025-2030 (%)

13.7 Middle East and Africa - Market size and forecast 2025-2030

Chart on Middle East and Africa - Market size and forecast 2025-2030 ($ million)
Data Table on Middle East and Africa - Market size and forecast 2025-2030 ($ million)
Chart on Middle East and Africa - Year-over-year growth 2025-2030 (%)
Data Table on Middle East and Africa - Year-over-year growth 2025-2030 (%)
Chart on Regional Comparison - Middle East and Africa
Data Table on Regional Comparison - Middle East and Africa

13.7.1 UAE - Market size and forecast 2025-2030

Chart on UAE - Market size and forecast 2025-2030 ($ million)
Data Table on UAE - Market size and forecast 2025-2030 ($ million)
Chart on UAE - Year-over-year growth 2025-2030 (%)
Data Table on UAE - Year-over-year growth 2025-2030 (%)

13.7.2 South Africa - Market size and forecast 2025-2030

Chart on South Africa - Market size and forecast 2025-2030 ($ million)
Data Table on South Africa - Market size and forecast 2025-2030 ($ million)
Chart on South Africa - Year-over-year growth 2025-2030 (%)
Data Table on South Africa - Year-over-year growth 2025-2030 (%)

13.7.3 Saudi Arabia - Market size and forecast 2025-2030

Chart on Saudi Arabia - Market size and forecast 2025-2030 ($ million)
Data Table on Saudi Arabia - Market size and forecast 2025-2030 ($ million)
Chart on Saudi Arabia - Year-over-year growth 2025-2030 (%)
Data Table on Saudi Arabia - Year-over-year growth 2025-2030 (%)

13.7.4 Egypt - Market size and forecast 2025-2030

Chart on Egypt - Market size and forecast 2025-2030 ($ million)
Data Table on Egypt - Market size and forecast 2025-2030 ($ million)
Chart on Egypt - Year-over-year growth 2025-2030 (%)
Data Table on Egypt - Year-over-year growth 2025-2030 (%)

13.7.5 Qatar - Market size and forecast 2025-2030

Chart on Qatar - Market size and forecast 2025-2030 ($ million)
Data Table on Qatar - Market size and forecast 2025-2030 ($ million)
Chart on Qatar - Year-over-year growth 2025-2030 (%)
Data Table on Qatar - Year-over-year growth 2025-2030 (%)

13.8 Market opportunity by geography

Market opportunity by geography ($ million)
Data Tables on Market opportunity by geography ($ million)

14. Drivers, Challenges, and Opportunity

14.1 Market drivers

Escalating demand for marine tourism and luxury yacht charters
Rising disposable income and wealth expansion among high-net-worth individuals
Growing focus on onboard wellness and luxury

14.2 Market challenges

High initial capital expenditure and financial barriers for commercial operators
Severe infrastructure limitations and elevated mooring costs in premier marinas
Compliance with stringent international environmental and decarbonization mandates

14.3 Impact of drivers and challenges

Impact of drivers and challenges in 2025 and 2030

14.4 Market opportunities

Accelerated adoption of smart hybrid propulsion and eco-conscious power systems
Integration of smart navigation and digital technology
Rapid growth of power catamarans

15. Competitive Landscape

15.1 Overview

15.2

Overview on criticality of inputs and factors of differentiation

15.3 Landscape disruption

Overview on factors of disruption

15.4 Industry risks

Impact of key risks on business

16. Competitive Analysis

16.1 Companies profiled

Companies covered

16.2 Company ranking index

16.3 Market positioning of companies

Matrix on companies position and classification

16.4 Alva Yachts

Alva Yachts - Overview
Alva Yachts - Product / Service
Alva Yachts - Key offerings
SWOT

16.5 Balance Catamarans

Balance Catamarans - Overview
Balance Catamarans - Product / Service
Balance Catamarans - Key offerings
SWOT

16.6 Bali Catamarans

Bali Catamarans - Overview
Bali Catamarans - Product / Service
Bali Catamarans - Key offerings
SWOT

16.7 Broadblue Catamarans

Broadblue Catamarans - Overview
Broadblue Catamarans - Product / Service
Broadblue Catamarans - Key offerings
SWOT

16.8 Fountaine Pajot SA

Fountaine Pajot SA - Overview
Fountaine Pajot SA - Product / Service
Fountaine Pajot SA - Key offerings
SWOT

16.9 Grand Large Yachting Group

Grand Large Yachting Group - Overview
Grand Large Yachting Group - Product / Service
Grand Large Yachting Group - Key offerings
SWOT

16.10 Groupe Beneteau

Groupe Beneteau - Overview
Groupe Beneteau - Business segments
Groupe Beneteau - Key offerings
Groupe Beneteau - Segment focus
SWOT

16.11 HanseYachts AG

HanseYachts AG - Overview
HanseYachts AG - Product / Service
HanseYachts AG - Key offerings
SWOT

16.12 Hudson Yacht Group

Hudson Yacht Group - Overview
Hudson Yacht Group - Product / Service
Hudson Yacht Group - Key offerings
SWOT

16.13 Kinetic Catamarans

Kinetic Catamarans - Overview
Kinetic Catamarans - Product / Service
Kinetic Catamarans - Key offerings
SWOT

16.14 Knysna Yacht Co

Knysna Yacht Co - Overview
Knysna Yacht Co - Product / Service
Knysna Yacht Co - Key offerings
SWOT

16.15 Pedigree Cats Inc.

Pedigree Cats Inc. - Overview
Pedigree Cats Inc. - Product / Service
Pedigree Cats Inc. - Key offerings
SWOT

16.16 Roberston and Caine

Roberston and Caine - Overview
Roberston and Caine - Product / Service
Roberston and Caine - Key offerings
SWOT

16.17 Travelopia Group

Travelopia Group - Overview
Travelopia Group - Product / Service
Travelopia Group - Key offerings
SWOT

16.18 Xquisite Yachts

Xquisite Yachts - Overview
Xquisite Yachts - Product / Service
Xquisite Yachts - Key offerings
SWOT

17. Appendix

17.1 Scope of the report

Market definition
Objectives
Notes and caveats

17.2 Inclusions and exclusions checklist

Inclusions checklist
Exclusions checklist

17.3 Currency conversion rates for US$

17.4 Research methodology

17.5 Data procurement

Information sources

17.6 Data validation

17.7 Validation techniques employed for market sizing

17.8 Data synthesis

17.9 360 degree market analysis

17.10 List of abbreviations

Research Methodology

Technavio presents a detailed picture of the market by way of study, synthesis, and summation of data from multiple sources. The analysts have presented the various facets of the market with a particular focus on identifying the key industry influencers. The data thus presented is comprehensive, reliable, and the result of extensive research, both primary and secondary.

INFORMATION SOURCES

Primary sources

  • Manufacturers and suppliers
  • Channel partners
  • Industry experts
  • Strategic decision makers

Secondary sources

  • Industry journals and periodicals
  • Government data
  • Financial reports of key industry players
  • Historical data
  • Press releases

DATA ANALYSIS

Data Synthesis

  • Collation of data
  • Estimation of key figures
  • Analysis of derived insights

Data Validation

  • Triangulation with data models
  • Reference against proprietary databases
  • Corroboration with industry experts

REPORT WRITING

Qualitative

  • Market drivers
  • Market challenges
  • Market trends
  • Five forces analysis

Quantitative

  • Market size and forecast
  • Market segmentation
  • Geographical insights
  • Competitive landscape

Interested in this report?

Get your sample now to see our research methodology and insights!

Download Now

Frequently Asked Questions

Catamaran market growth will increase by USD 585.7 million during 2026-2030.

The Catamaran market is expected to grow at a CAGR of 6.2% during 2026-2030.

Catamaran market is segmented by Product (Sailing catamarans, Power catamarans) Application (Sport, Leisure, Transport, Others) Propulsion (Motor-powered, Sail-powered, Hybrid, Electric-powered) Material (Fiberglass, Aluminum, Carbon fiber, Steel, Others)

Alva Yachts, Aquila, Aventura Catamarans, Balance Catamarans, Bali Catamarans, Broadblue Catamarans, Fountaine Pajot SA, Grand Large Yachting Group, Groupe Beneteau, HanseYachts AG, Hudson Yacht Group, Kinetic Catamarans, Knysna Yacht Co, McConaght Boats, Pedigree Cats Inc., Roberston and Caine, The Catamaran Co, Travelopia Group, VOYAGE Yachts, Xquisite Yachts are a few of the key vendors in the Catamaran market.

North America will register the highest growth rate of 54% among the other regions. Therefore, the Catamaran market in North America is expected to garner significant business opportunities for the vendors during the forecast period.

US, Canada, Mexico, France, UK, Spain, Italy, Germany, Greece, Australia, China, Japan, Thailand, Indonesia, India, Brazil, Argentina, Chile, UAE, South Africa, Saudi Arabia, Egypt, Qatar

  • Escalating demand for marine tourism and luxury yacht charters is the driving factor this market.

The Catamaran market vendors should focus on grabbing business opportunities from the Product segment as it accounted for the largest market share in the base year.
RIA - Research AI Assistant
Ask RIA