CCaas Market Size 2025-2029
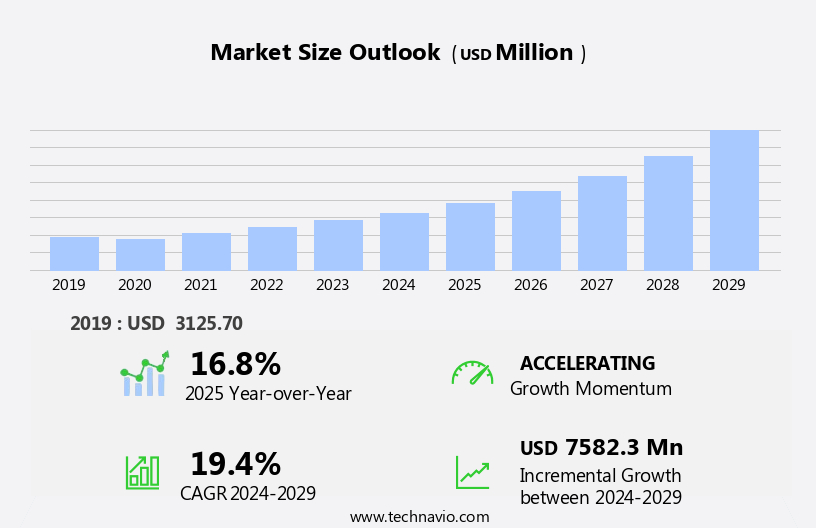
The ccaas market size is forecast to increase by USD 7.58 billion, at a CAGR of 19.4% between 2024 and 2029.
- The market is experiencing significant growth, driven by the increasing adoption of cloud-based offerings and the growing demand for social interaction in customer engagement. Companies are recognizing the benefits of cloud solutions, such as scalability, flexibility, and cost savings, leading to a shift away from traditional on-premises systems. Furthermore, the need for seamless and personalized customer experiences across various channels, including social media, is fueling the demand for CCaaS solutions that enable effective communication and collaboration. However, the market is not without challenges. The increased use of cloud technologies also brings heightened risks related to data security and privacy.
- As businesses store and process sensitive customer information in the cloud, they become vulnerable to cyber threats and data breaches. Ensuring robust security measures and adhering to regulatory compliance are essential for CCaaS providers and their clients to maintain trust and protect their reputations. Companies must prioritize these concerns to effectively capitalize on market opportunities and navigate challenges in the evolving CCaaS landscape.
What will be the Size of the CCaas Market during the forecast period?

Explore in-depth regional segment analysis with market size data - historical 2019-2023 and forecasts 2025-2029 - in the full report.
Request Free Sample
The Customer Relationship Management (CRM) market continues to evolve, with dynamic market dynamics shaping its growth and applications across various sectors. Subscription models, sales pipeline management, and hybrid solutions are increasingly popular, enabling businesses to optimize customer interactions and streamline operations. Data privacy and security are paramount, with customer feedback management and customer support being key areas of focus. Customer experience management, customer relationship management, and customer service automation are integrated to enhance the overall customer journey. Technical support and issue resolution are critical components, ensuring seamless problem resolution and maintaining customer satisfaction. Social media marketing and customer engagement strategies are also essential, requiring marketing automation and self-service portals to effectively manage lead generation and customer onboarding.
The market's ongoing evolution includes the integration of AI-powered chatbots, customer analytics, and net promoter score to improve customer engagement and personalize interactions. Sales forecasting and lead scoring help businesses anticipate customer needs and prioritize resources effectively. Training services and consulting are also valuable, ensuring successful implementation and integration with CRM, ERP, and other systems. Market activities remain robust, with ongoing compliance regulations and evolving customer expectations driving continuous innovation. Cloud-based and on-premise solutions cater to diverse business needs, while customer churn reduction, customer advocacy, and customer loyalty initiatives remain key priorities. The market's continuous dynamism underscores the importance of adaptability and ongoing investment in customer-centric technologies and strategies.
How is this CCaas Industry segmented?
The ccaas industry research report provides comprehensive data (region-wise segment analysis), with forecasts and estimates in "USD million" for the period 2025-2029, as well as historical data from 2019-2023 for the following segments.
- Component
- End-user
- BFSI
- IT and telecom
- Consumer goods and retail
- Healthcare
- Others
- Enterprise Size
- Large Enterprises
- Small & Medium Enterprises
- Functionality
- Automatic Call Distribution (ACD)
- Call Recording
- Customer Collaboration
-
Interactive Voice Response (IVR)
-
Workforce Optimization
-
Reporting & Analytics
- Computer Telephony Integration (CTI)
- Dialer
- Deployment Type
- Geography
- North America
- Europe
- Middle East and Africa
- APAC
- Australia
- China
- India
- Japan
- South Korea
- South America
- Rest of World (ROW)
By Component Insights
The solutions segment is estimated to witness significant growth during the forecast period.
The market witnessed substantial growth in 2024, with the solutions segment leading the way. Enterprises across industries, including finance and retail, adopted CCaaS to manage and analyze customer inquiries efficiently. These solutions offer automated responses, call distribution, and customer collaboration, enhancing the overall customer experience. When call volumes are high or agents are occupied, CCaaS solutions ensure calls are directed appropriately, reducing wait times. Moreover, the integration of AI-powered chatbots and customer journey mapping in CCaaS solutions has streamlined support services. These tools enable personalized interactions, issue resolution, and product support, leading to increased customer satisfaction. Sales automation and lead generation are other significant benefits, allowing businesses to optimize their sales pipeline and improve forecasting.
Pricing models, customer analytics, and compliance regulations are essential considerations in the market. Subscription models and hybrid solutions cater to various business needs, while data privacy and security remain top priorities. CRM integration, customer segmentation, and lead scoring are essential features for effective customer relationship management. The market also offers consulting services, training, and implementation to ensure a smooth transition to CCaaS platforms. Technical support, self-service portals, and knowledge base management are essential for ongoing customer support and retention. Social media marketing and customer experience management further expand the reach and engagement opportunities for businesses. In summary, the market's growth is driven by the need for efficient customer engagement and support.
Solutions that offer automation, analytics, and personalized interactions are increasingly preferred by businesses to improve customer satisfaction and loyalty.

Request Free Sample
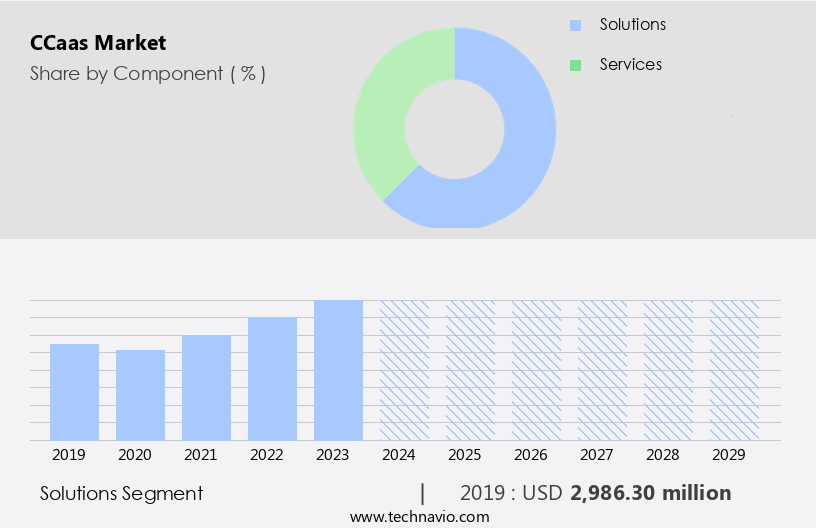
The Solutions segment was valued at USD 2.99 billion in 2019 and showed a gradual increase during the forecast period.
Regional Analysis
North America is estimated to contribute 35% to the growth of the global market during the forecast period.Technavio’s analysts have elaborately explained the regional trends and drivers that shape the market during the forecast period.

Request Free Sample
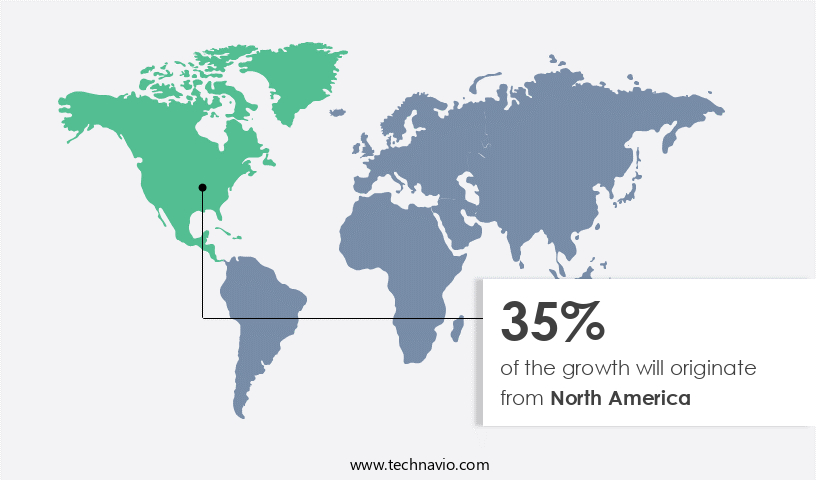
The market in North America is experiencing significant growth due to the increasing adoption of public cloud services by enterprises and the necessity to analyze customer data. Advanced technological infrastructure and the presence of numerous cloud service providers, including Microsoft, Salesforce, Oracle, and Adobe, are fueling market expansion in the region. Enterprises are shifting towards cloud services to implement enterprise applications and optimize business processes. CCaaS solutions allow organizations to reduce customer contact costs and pay only for potential leads, while also decreasing IT spending by investing in pertinent software and applications. Sales automation, content marketing, and lead generation are key functionalities driving the demand for CCaaS.
Pricing models have evolved to subscription-based structures, enabling businesses to pay for only the services they require. Customer analytics, customer success, training services, and net promoter score are essential components of CCaaS, contributing to improved customer engagement and retention. Hybrid solutions that integrate with CRM systems and ERP platforms are gaining popularity, offering seamless data flow between departments. Compliance regulations, data privacy, and sales pipeline management are critical considerations for businesses implementing CCaaS. AI-powered chatbots, issue resolution, product support, and self-service portals are essential features for enhancing customer experience and reducing support costs. Customer feedback management, customer support, customer service automation, and technical support are essential for maintaining a positive customer relationship.
Social media marketing and customer experience management are increasingly important for businesses to engage with their customers and build brand loyalty. Marketing automation, customer churn reduction, customer advocacy, customer escalation, data security, and cloud-based solutions are other essential aspects of CCaaS. On-premise solutions are still used by some businesses, but the trend is shifting towards cloud-based solutions due to their flexibility and cost-effectiveness. Customer training, customer retention, knowledge base management, and customer satisfaction are crucial elements for ensuring long-term success with CCaaS. Overall, the market in North America is evolving to meet the changing needs of businesses, with a focus on enhancing customer engagement, reducing costs, and improving operational efficiency.
Market Dynamics
Our researchers analyzed the data with 2024 as the base year, along with the key drivers, trends, and challenges. A holistic analysis of drivers will help companies refine their marketing strategies to gain a competitive advantage.
What are the key market drivers leading to the rise in the adoption of CCaas Industry?
- The significant growth in the market can be attributed to the increasing adoption of cloud-based offerings by businesses and organizations. These cloud-based solutions provide numerous benefits, including cost savings, scalability, and flexibility, making them an attractive option for companies looking to streamline their operations and enhance productivity.
- The market is experiencing significant growth due to enterprises increasing their IT spending on cloud computing strategies. This trend is driving the adoption of cloud-based call center solutions, including Interactive Voice Response (IVR), 360-degree customer support, and cloud-based call recording. The global potential for cloud applications is vast, given the benefits of cloud computing, such as scalability, reliability, and high resource availability. These advantages are compelling businesses to adopt cloud architecture for their business models. Moreover, the use of cloud computing eliminates the requirement for a dedicated IT support team and can lead to operational cost savings.
- Additionally, customer engagement strategies like SMS marketing, customer effort score, customer lifetime value, and net promoter score are increasingly being integrated into CCaaS platforms. Sales automation, content marketing, customer analytics, customer success, training services, and AI-powered chatbots are also essential features that enhance the value proposition of CCaaS solutions. Pricing models are also becoming more flexible and customizable to cater to various business needs. The integration of a customer data platform and service automation further strengthens the capabilities of CCaaS platforms. Overall, the market is poised for continued growth as businesses increasingly adopt cloud-based solutions to improve customer engagement and streamline operations.
What are the market trends shaping the CCaas Industry?
- The increasing preference for social connection represents a significant market trend. This demand for enhanced interaction is a key focus area for professionals and businesses alike.
- The Customer as a Service (CCaas) market is witnessing significant growth due to the integration of social media services with call centers. This integration enables businesses to gain valuable insights for lead generation and product development by predicting social customer behavior. The primary components of social interactions are social customer prediction and social customer conversation. Social customer prediction identifies potential buyers by analyzing social media communications, while social customer conversation engages likely buyers and moves them further in the demand requirement process. Advanced analytics platforms are being adopted to integrate social data into their forecast models, allowing companies to examine social contacts in real time.
- This approach combines keyword analysis and predictive algorithms to provide a more comprehensive understanding of customer needs and preferences. Furthermore, CCaas solutions offer various features such as email marketing, customer journey mapping, support services including live chat and consulting, self-service portals, issue resolution, and product support. Compliance regulations and customer segmentation are also crucial aspects of CCaas, ensuring businesses maintain a positive reputation and cater to diverse customer needs effectively.
What challenges does the CCaas Industry face during its growth?
- The escalating risks to data security and privacy pose a significant challenge to the industry's growth, requiring robust measures to mitigate potential threats and ensure compliance with regulatory frameworks.
- Cloud-based call center software, also known as Contact Center as a Service (CCaaS), offers US businesses subscription models for managing sales pipeline, customer feedback, and support operations. While the cloud provides flexibility and cost savings, data privacy and security are paramount concerns. The shift to CCaaS involves transferring control of customer interaction and data to service providers, increasing dependence and potential risks of information leakage. Misuse or manipulation of customer data could result in legal and reputational issues. Hybrid solutions that combine cloud and on-premises systems can offer a balance between flexibility and control.
- Sales forecasting, customer experience management, customer relationship management, technical support, social media marketing, and customer service automation are key features of CCaaS. Implementation services ensure smooth transition and optimization of these functionalities. Organizations must carefully evaluate the security measures and reliability of CCaaS providers to mitigate risks and ensure compliance with data privacy regulations.
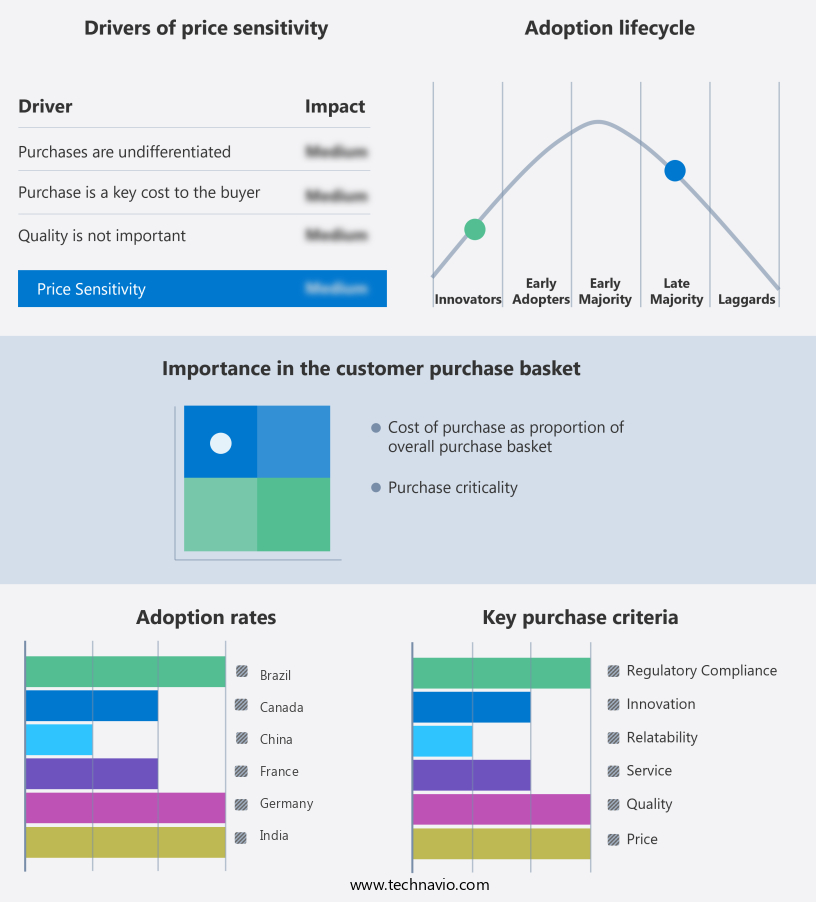
Exclusive Customer Landscape
The ccaas market forecasting report includes the adoption lifecycle of the market, covering from the innovator’s stage to the laggard’s stage. It focuses on adoption rates in different regions based on penetration. Furthermore, the ccaas market report also includes key purchase criteria and drivers of price sensitivity to help companies evaluate and develop their market growth analysis strategies.

Customer Landscape
Key Companies & Market Insights
Companies are implementing various strategies, such as strategic alliances, ccaas market forecast, partnerships, mergers and acquisitions, geographical expansion, and product/service launches, to enhance their presence in the industry.
Amazon Web Services Inc. - The company delivers a Cloud Contact Center as a Service (CCaaS) solution, 3CLogic Cloud Call Center, empowering businesses with advanced communication capabilities. This innovative technology integrates voice, chat, email, and social media channels to streamline customer interactions. By leveraging artificial intelligence and automation, it enhances agent productivity, improves customer satisfaction, and drives operational efficiency. The platform's robust reporting and analytics features offer valuable insights, enabling data-driven decision-making. 3CLogic Cloud Call Center is a versatile, scalable, and customizable solution, catering to diverse industries and business sizes.
The industry research and growth report includes detailed analyses of the competitive landscape of the market and information about key companies, including:
- Amazon Web Services Inc.
- Microsoft Corporation
- Cisco Systems Inc.
- Genesys
- NICE Ltd.
- Five9 Inc.
- Talkdesk Inc.
- Zendesk Inc.
- RingCentral Inc.
- 8x8 Inc.
- Vonage Holdings Corp.
- Avaya Inc.
- Mitel Networks Corporation
- Twilio Inc.
- Dialpad Inc.
- UJET Inc.
- Freshworks Inc.
- LivePerson Inc.
- Content Guru
- Odigo
Qualitative and quantitative analysis of companies has been conducted to help clients understand the wider business environment as well as the strengths and weaknesses of key industry players. Data is qualitatively analyzed to categorize companies as pure play, category-focused, industry-focused, and diversified; it is quantitatively analyzed to categorize companies as dominant, leading, strong, tentative, and weak.
Recent Development and News in CCaas Market
- In January 2024, Microsoft Teams announced the integration of its Communication Platform as a Service (CPaaS) capabilities with Salesforce CRM, enabling seamless customer interactions and improving sales productivity (Microsoft Press Release).
- In March 2024, Twilio acquired Segment, a customer data infrastructure company, for approximately USD3.2 billion, expanding its offerings beyond communication services and enhancing its data-driven marketing and customer engagement capabilities (Twilio Press Release).
- In May 2024, Zoom Video Communications reported a 35% increase in Q1 revenue, reaching USD1.05 billion, driven by the continued demand for remote work solutions and the expansion of its CCaas offerings (Zoom Q1 2024 Earnings Report).
- In April 2025, Google Cloud Platform launched a new CCaas solution, Google Meet Series One, which includes hardware devices for video conferencing and advanced AI capabilities, targeting enterprise customers (Google Cloud Blog).
Research Analyst Overview
- In the Customer Relationship Management (CRM) landscape, Contact Center as a Service (CCaaS) solutions have emerged as a game-changer for businesses seeking to enhance customer engagement and optimize customer journeys. The market for CCaaS is dynamic, with a focus on customer insights and journey analytics to drive customer success. Security is paramount, ensuring data privacy and protection. Automation plays a significant role, enabling proactive customer support and personalized experiences. Customer feedback analysis and relationship intelligence fuel continuous improvement and innovation.
- Integration with various systems and omnichannel customer experience strategies are essential for scalability and multichannel support. Customer-centric design and a customer-driven approach are key to delivering customer service excellence. Privacy and security remain top priorities as businesses strive for customer experience strategy success.
Dive into Technavio’s robust research methodology, blending expert interviews, extensive data synthesis, and validated models for unparalleled CCaas Market insights. See full methodology.
Market Scope
|
Report Coverage
|
Details
|
Page number
|
195
|
Base year
|
2024
|
Historic period
|
2019-2023 |
Forecast period
|
2025-2029
|
Growth momentum & CAGR
|
Accelerate at a CAGR of 19.4%
|
Market growth 2025-2029
|
USD 7582.3 million
|
Market structure
|
Fragmented
|
YoY growth 2024-2025(%)
|
16.8
|
Key countries
|
US, China, Germany, Japan, UK, Australia, India, France, Brazil, UAE, Rest of World (ROW), Saudi Arabia, France, South Korea, Mexico, and Italy
|
Competitive landscape
|
Leading Companies, Market Positioning of Companies, Competitive Strategies, and Industry Risks
|
Request Free Sample
What are the Key Data Covered in this CCaas Market Research and Growth Report?
- CAGR of the CCaas industry during the forecast period
- Detailed information on factors that will drive the growth and forecasting between 2025 and 2029
- Precise estimation of the size of the market and its contribution of the industry in focus to the parent market
- Accurate predictions about upcoming growth and trends and changes in consumer behaviour
- Growth of the market across North America, Europe, APAC, South America, and Middle East and Africa
- Thorough analysis of the market’s competitive landscape and detailed information about companies
- Comprehensive analysis of factors that will challenge the ccaas market growth of industry companies
We can help! Our analysts can customize this ccaas market research report to meet your requirements.
Get in touch
1 Executive Summary
- 1.1 Market overview
- Executive Summary - Chart on Market Overview
- Executive Summary - Data Table on Market Overview
- Executive Summary - Chart on Global Market Characteristics
- Executive Summary - Chart on Market by Geography
- Executive Summary - Chart on Market Segmentation by Component
- Executive Summary - Chart on Market Segmentation by End-user
- Executive Summary - Chart on Incremental Growth
- Executive Summary - Data Table on Incremental Growth
- Executive Summary - Chart on Company Market Positioning
2 Technavio Analysis
- 2.1 Analysis of price sensitivity, lifecycle, customer purchase basket, adoption rates, and purchase criteria
- Analysis of price sensitivity, lifecycle, customer purchase basket, adoption rates, and purchase criteria
- 2.2 Criticality of inputs and Factors of differentiation
- Overview on criticality of inputs and factors of differentiation
- 2.3 Factors of disruption
- Overview on factors of disruption
- 2.4 Impact of drivers and challenges
- Impact of drivers and challenges in 2024 and 2029
3 Market Landscape
- 3.1 Market ecosystem
- Parent Market
- Data Table on - Parent Market
- 3.2 Market characteristics
- Market characteristics analysis
4 Market Sizing
- 4.1 Market definition
- Offerings of companies included in the market definition
- 4.2 Market segment analysis
- 4.4 Market outlook: Forecast for 2024-2029
- Chart on Global - Market size and forecast 2024-2029 ($ million)
- Data Table on Global - Market size and forecast 2024-2029 ($ million)
- Chart on Global Market: Year-over-year growth 2024-2029 (%)
- Data Table on Global Market: Year-over-year growth 2024-2029 (%)
5 Historic Market Size
- 5.1 Global CCaaS Market 2019 - 2023
- Historic Market Size - Data Table on Global CCaaS Market 2019 - 2023 ($ million)
- 5.2 Component segment analysis 2019 - 2023
- Historic Market Size - Component Segment 2019 - 2023 ($ million)
- 5.3 End-user segment analysis 2019 - 2023
- Historic Market Size - End-user Segment 2019 - 2023 ($ million)
- 5.4 Geography segment analysis 2019 - 2023
- Historic Market Size - Geography Segment 2019 - 2023 ($ million)
- 5.5 Country segment analysis 2019 - 2023
- Historic Market Size - Country Segment 2019 - 2023 ($ million)
6 Qualitative Analysis
- 6.1 Impact of AI in the global CCaaS market
7 Five Forces Analysis
- 7.1 Five forces summary
- Five forces analysis - Comparison between 2024 and 2029
- 7.2 Bargaining power of buyers
- Bargaining power of buyers - Impact of key factors 2024 and 2029
- 7.3 Bargaining power of suppliers
- Bargaining power of suppliers - Impact of key factors in 2024 and 2029
- 7.4 Threat of new entrants
- Threat of new entrants - Impact of key factors in 2024 and 2029
- 7.5 Threat of substitutes
- Threat of substitutes - Impact of key factors in 2024 and 2029
- 7.6 Threat of rivalry
- Threat of rivalry - Impact of key factors in 2024 and 2029
- 7.7 Market condition
- Chart on Market condition - Five forces 2024 and 2029
8 Market Segmentation by Component
- 8.1 Market segments
- Chart on Component - Market share (2024-2029) (%)
- Data Table on Component - Market share (2024-2029) (%)
- 8.2 Comparison by Component
- Chart on Comparison by Component
- Data Table on Comparison by Component
- 8.3 Solutions - Market size and forecast (2024-2029)
- Chart on Solutions - Market size and forecast (2024-2029) ($ million)
- Data Table on Solutions - Market size and forecast (2024-2029) ($ million)
- Chart on Solutions - Year-over-year growth (2024-2029) (%)
- Data Table on Solutions - Year-over-year growth (2024-2029) (%)
- 8.4 Services - Market size and forecast (2024-2029)
- Chart on Services - Market size and forecast (2024-2029) ($ million)
- Data Table on Services - Market size and forecast (2024-2029) ($ million)
- Chart on Services - Year-over-year growth (2024-2029) (%)
- Data Table on Services - Year-over-year growth (2024-2029) (%)
- 8.5 Market opportunity by Component
- Market opportunity by Component ($ million)
- Data Table on Market opportunity by Component ($ million)
9 Market Segmentation by End-user
- 9.1 Market segments
- Chart on End-user - Market share (2024-2029) (%)
- Data Table on End-user - Market share (2024-2029) (%)
- 9.2 Comparison by End-user
- Chart on Comparison by End-user
- Data Table on Comparison by End-user
- 9.3 BFSI - Market size and forecast (2024-2029)
- Chart on BFSI - Market size and forecast (2024-2029) ($ million)
- Data Table on BFSI - Market size and forecast (2024-2029) ($ million)
- Chart on BFSI - Year-over-year growth (2024-2029) (%)
- Data Table on BFSI - Year-over-year growth (2024-2029) (%)
- 9.4 IT and telecom - Market size and forecast (2024-2029)
- Chart on IT and telecom - Market size and forecast (2024-2029) ($ million)
- Data Table on IT and telecom - Market size and forecast (2024-2029) ($ million)
- Chart on IT and telecom - Year-over-year growth (2024-2029) (%)
- Data Table on IT and telecom - Year-over-year growth (2024-2029) (%)
- 9.5 Consumer goods and retail - Market size and forecast (2024-2029)
- Chart on Consumer goods and retail - Market size and forecast (2024-2029) ($ million)
- Data Table on Consumer goods and retail - Market size and forecast (2024-2029) ($ million)
- Chart on Consumer goods and retail - Year-over-year growth (2024-2029) (%)
- Data Table on Consumer goods and retail - Year-over-year growth (2024-2029) (%)
- 9.6 Healthcare - Market size and forecast (2024-2029)
- Chart on Healthcare - Market size and forecast (2024-2029) ($ million)
- Data Table on Healthcare - Market size and forecast (2024-2029) ($ million)
- Chart on Healthcare - Year-over-year growth (2024-2029) (%)
- Data Table on Healthcare - Year-over-year growth (2024-2029) (%)
- 9.7 Others - Market size and forecast (2024-2029)
- Chart on Others - Market size and forecast (2024-2029) ($ million)
- Data Table on Others - Market size and forecast (2024-2029) ($ million)
- Chart on Others - Year-over-year growth (2024-2029) (%)
- Data Table on Others - Year-over-year growth (2024-2029) (%)
- 9.8 Market opportunity by End-user
- Market opportunity by End-user ($ million)
- Data Table on Market opportunity by End-user ($ million)
10 Market Segmentation by Enterprise Size
- 10.1 Market segments
- Chart on Enterprise Size - Market share (2024-2029) (%)
- Data Table on Enterprise Size - Market share (2024-2029) (%)
- 10.2 Comparison by Enterprise Size
- Chart on Comparison by Enterprise Size
- Data Table on Comparison by Enterprise Size
- 10.3 Large Enterprises - Market size and forecast (2024-2029)
- Chart on Large Enterprises - Market size and forecast (2024-2029) ($ million)
- Data Table on Large Enterprises - Market size and forecast (2024-2029) ($ million)
- Chart on Large Enterprises - Year-over-year growth (2024-2029) (%)
- Data Table on Large Enterprises - Year-over-year growth (2024-2029) (%)
- 10.4 Small & Medium Enterprises - Market size and forecast (2024-2029)
- Chart on Small & Medium Enterprises - Market size and forecast (2024-2029) ($ million)
- Data Table on Small & Medium Enterprises - Market size and forecast (2024-2029) ($ million)
- Chart on Small & Medium Enterprises - Year-over-year growth (2024-2029) (%)
- Data Table on Small & Medium Enterprises - Year-over-year growth (2024-2029) (%)
- 10.5 Market opportunity by Enterprise Size
- Market opportunity by Enterprise Size ($ million)
- Data Table on Market opportunity by Enterprise Size ($ million)
11 Market Segmentation by Functionality
- 11.1 Market segments
- Chart on Functionality - Market share (2024-2029) (%)
- Data Table on Functionality - Market share (2024-2029) (%)
- Chart on Dialer - Market size and forecast (2024-2029) ($ million)
- Data Table on Dialer - Market size and forecast (2024-2029) ($ million)
- Chart on Dialer - Year-over-year growth (2024-2029) (%)
- Data Table on Dialer - Year-over-year growth (2024-2029) (%)
- 11.2 Comparison by Functionality
- Chart on Comparison by Functionality
- Data Table on Comparison by Functionality
- Market opportunity by Functionality ($ million)
- Data Table on Market opportunity by Functionality ($ million)
- 11.3 Automatic Call Distribution (ACD) - Market size and forecast (2024-2029)
- Chart on Automatic Call Distribution (ACD) - Market size and forecast (2024-2029) ($ million)
- Data Table on Automatic Call Distribution (ACD) - Market size and forecast (2024-2029) ($ million)
- Chart on Automatic Call Distribution (ACD) - Year-over-year growth (2024-2029) (%)
- Data Table on Automatic Call Distribution (ACD) - Year-over-year growth (2024-2029) (%)
- 11.4 Call Recording - Market size and forecast (2024-2029)
- Chart on Call Recording - Market size and forecast (2024-2029) ($ million)
- Data Table on Call Recording - Market size and forecast (2024-2029) ($ million)
- Chart on Call Recording - Year-over-year growth (2024-2029) (%)
- Data Table on Call Recording - Year-over-year growth (2024-2029) (%)
- 11.5 Customer Collaboration - Market size and forecast (2024-2029)
- Chart on Customer Collaboration - Market size and forecast (2024-2029) ($ million)
- Data Table on Customer Collaboration - Market size and forecast (2024-2029) ($ million)
- Chart on Customer Collaboration - Year-over-year growth (2024-2029) (%)
- Data Table on Customer Collaboration - Year-over-year growth (2024-2029) (%)
- 11.6 Interactive Voice Response (IVR) - Market size and forecast (2024-2029)
- Chart on Interactive Voice Response (IVR) - Market size and forecast (2024-2029) ($ million)
- Data Table on Interactive Voice Response (IVR) - Market size and forecast (2024-2029) ($ million)
- Chart on Interactive Voice Response (IVR) - Year-over-year growth (2024-2029) (%)
- Data Table on Interactive Voice Response (IVR) - Year-over-year growth (2024-2029) (%)
- 11.7 Workforce Optimization - Market size and forecast (2024-2029)
- Chart on Workforce Optimization - Market size and forecast (2024-2029) ($ million)
- Data Table on Workforce Optimization - Market size and forecast (2024-2029) ($ million)
- Chart on Workforce Optimization - Year-over-year growth (2024-2029) (%)
- Data Table on Workforce Optimization - Year-over-year growth (2024-2029) (%)
- 11.8 Reporting & Analytics - Market size and forecast (2024-2029)
- Chart on Reporting & Analytics - Market size and forecast (2024-2029) ($ million)
- Data Table on Reporting & Analytics - Market size and forecast (2024-2029) ($ million)
- Chart on Reporting & Analytics - Year-over-year growth (2024-2029) (%)
- Data Table on Reporting & Analytics - Year-over-year growth (2024-2029) (%)
- 11.9 Computer Telephony Integration (CTI) - Market size and forecast (2024-2029)
- Chart on Computer Telephony Integration (CTI) - Market size and forecast (2024-2029) ($ million)
- Data Table on Computer Telephony Integration (CTI) - Market size and forecast (2024-2029) ($ million)
- Chart on Computer Telephony Integration (CTI) - Year-over-year growth (2024-2029) (%)
- Data Table on Computer Telephony Integration (CTI) - Year-over-year growth (2024-2029) (%)
12 Market Segmentation by Deployment Type
- 12.1 Market segments
- Chart on Deployment Type - Market share (2024-2029) (%)
- Data Table on Deployment Type - Market share (2024-2029) (%)
- 12.2 Comparison by Deployment Type
- Chart on Comparison by Deployment Type
- Data Table on Comparison by Deployment Type
- 12.3 Cloud - Market size and forecast (2024-2029)
- Chart on Cloud - Market size and forecast (2024-2029) ($ million)
- Data Table on Cloud - Market size and forecast (2024-2029) ($ million)
- Chart on Cloud - Year-over-year growth (2024-2029) (%)
- Data Table on Cloud - Year-over-year growth (2024-2029) (%)
- 12.4 Hybrid - Market size and forecast (2024-2029)
- Chart on Hybrid - Market size and forecast (2024-2029) ($ million)
- Data Table on Hybrid - Market size and forecast (2024-2029) ($ million)
- Chart on Hybrid - Year-over-year growth (2024-2029) (%)
- Data Table on Hybrid - Year-over-year growth (2024-2029) (%)
- 12.5 Market opportunity by Deployment Type
- Market opportunity by Deployment Type ($ million)
- Data Table on Market opportunity by Deployment Type ($ million)
13 Customer Landscape
- 13.1 Customer landscape overview
- Analysis of price sensitivity, lifecycle, customer purchase basket, adoption rates, and purchase criteria
14 Geographic Landscape
- 14.1 Geographic segmentation
- Chart on Market share by geography 2024-2029 (%)
- Data Table on Market share by geography 2024-2029 (%)
- 14.2 Geographic comparison
- Chart on Geographic comparison
- Data Table on Geographic comparison
- 14.3 North America - Market size and forecast 2024-2029
- Chart on North America - Market size and forecast 2024-2029 ($ million)
- Data Table on North America - Market size and forecast 2024-2029 ($ million)
- Chart on North America - Year-over-year growth 2024-2029 (%)
- Data Table on North America - Year-over-year growth 2024-2029 (%)
- 14.4 Europe - Market size and forecast 2024-2029
- Chart on Europe - Market size and forecast 2024-2029 ($ million)
- Data Table on Europe - Market size and forecast 2024-2029 ($ million)
- Chart on Europe - Year-over-year growth 2024-2029 (%)
- Data Table on Europe - Year-over-year growth 2024-2029 (%)
- 14.5 APAC - Market size and forecast 2024-2029
- Chart on APAC - Market size and forecast 2024-2029 ($ million)
- Data Table on APAC - Market size and forecast 2024-2029 ($ million)
- Chart on APAC - Year-over-year growth 2024-2029 (%)
- Data Table on APAC - Year-over-year growth 2024-2029 (%)
- 14.6 South America - Market size and forecast 2024-2029
- Chart on South America - Market size and forecast 2024-2029 ($ million)
- Data Table on South America - Market size and forecast 2024-2029 ($ million)
- Chart on South America - Year-over-year growth 2024-2029 (%)
- Data Table on South America - Year-over-year growth 2024-2029 (%)
- 14.7 Middle East and Africa - Market size and forecast 2024-2029
- Chart on Middle East and Africa - Market size and forecast 2024-2029 ($ million)
- Data Table on Middle East and Africa - Market size and forecast 2024-2029 ($ million)
- Chart on Middle East and Africa - Year-over-year growth 2024-2029 (%)
- Data Table on Middle East and Africa - Year-over-year growth 2024-2029 (%)
- 14.8 China - Market size and forecast 2024-2029
- Chart on China - Market size and forecast 2024-2029 ($ million)
- Data Table on China - Market size and forecast 2024-2029 ($ million)
- Chart on China - Year-over-year growth 2024-2029 (%)
- Data Table on China - Year-over-year growth 2024-2029 (%)
- 14.9 Japan - Market size and forecast 2024-2029
- Chart on Japan - Market size and forecast 2024-2029 ($ million)
- Data Table on Japan - Market size and forecast 2024-2029 ($ million)
- Chart on Japan - Year-over-year growth 2024-2029 (%)
- Data Table on Japan - Year-over-year growth 2024-2029 (%)
- 14.10 India - Market size and forecast 2024-2029
- Chart on India - Market size and forecast 2024-2029 ($ million)
- Data Table on India - Market size and forecast 2024-2029 ($ million)
- Chart on India - Year-over-year growth 2024-2029 (%)
- Data Table on India - Year-over-year growth 2024-2029 (%)
- 14.11 South Korea - Market size and forecast 2024-2029
- Chart on South Korea - Market size and forecast 2024-2029 ($ million)
- Data Table on South Korea - Market size and forecast 2024-2029 ($ million)
- Chart on South Korea - Year-over-year growth 2024-2029 (%)
- Data Table on South Korea - Year-over-year growth 2024-2029 (%)
- 14.12 France - Market size and forecast 2024-2029
- Chart on France - Market size and forecast 2024-2029 ($ million)
- Data Table on France - Market size and forecast 2024-2029 ($ million)
- Chart on France - Year-over-year growth 2024-2029 (%)
- Data Table on France - Year-over-year growth 2024-2029 (%)
- 14.13 Germany - Market size and forecast 2024-2029
- Chart on Germany - Market size and forecast 2024-2029 ($ million)
- Data Table on Germany - Market size and forecast 2024-2029 ($ million)
- Chart on Germany - Year-over-year growth 2024-2029 (%)
- Data Table on Germany - Year-over-year growth 2024-2029 (%)
- 14.14 Italy - Market size and forecast 2024-2029
- Chart on Italy - Market size and forecast 2024-2029 ($ million)
- Data Table on Italy - Market size and forecast 2024-2029 ($ million)
- Chart on Italy - Year-over-year growth 2024-2029 (%)
- Data Table on Italy - Year-over-year growth 2024-2029 (%)
- 14.15 UK - Market size and forecast 2024-2029
- Chart on UK - Market size and forecast 2024-2029 ($ million)
- Data Table on UK - Market size and forecast 2024-2029 ($ million)
- Chart on UK - Year-over-year growth 2024-2029 (%)
- Data Table on UK - Year-over-year growth 2024-2029 (%)
- 14.16 US - Market size and forecast 2024-2029
- Chart on US - Market size and forecast 2024-2029 ($ million)
- Data Table on US - Market size and forecast 2024-2029 ($ million)
- Chart on US - Year-over-year growth 2024-2029 (%)
- Data Table on US - Year-over-year growth 2024-2029 (%)
- 14.17 Canada - Market size and forecast 2024-2029
- Chart on Canada - Market size and forecast 2024-2029 ($ million)
- Data Table on Canada - Market size and forecast 2024-2029 ($ million)
- Chart on Canada - Year-over-year growth 2024-2029 (%)
- Data Table on Canada - Year-over-year growth 2024-2029 (%)
- 14.18 Market opportunity by geography
- Market opportunity by geography ($ million)
- Data Tables on Market opportunity by geography ($ million)
- 14.19 US - Market size and forecast (2024-2029)
- Chart on US - Market size and forecast (2024-2029) ($ million)
- Data Table on US - Market size and forecast (2024-2029) ($ million)
- Chart on US - Year-over-year growth (2024-2029) (%)
- Data Table on US - Year-over-year growth (2024-2029) (%)
- 14.20 Australia - Market size and forecast (2024-2029)
- Chart on Australia - Market size and forecast (2024-2029) ($ million)
- Data Table on Australia - Market size and forecast (2024-2029) ($ million)
- Chart on Australia - Year-over-year growth (2024-2029) (%)
- Data Table on Australia - Year-over-year growth (2024-2029) (%)
- 14.21 Brazil - Market size and forecast (2024-2029)
- Chart on Brazil - Market size and forecast (2024-2029) ($ million)
- Data Table on Brazil - Market size and forecast (2024-2029) ($ million)
- Chart on Brazil - Year-over-year growth (2024-2029) (%)
- Data Table on Brazil - Year-over-year growth (2024-2029) (%)
- 14.22 UAE - Market size and forecast (2024-2029)
- Chart on UAE - Market size and forecast (2024-2029) ($ million)
- Data Table on UAE - Market size and forecast (2024-2029) ($ million)
- Chart on UAE - Year-over-year growth (2024-2029) (%)
- Data Table on UAE - Year-over-year growth (2024-2029) (%)
- 14.23 Rest of World (ROW) - Market size and forecast (2024-2029)
- Chart on Rest of World (ROW) - Market size and forecast (2024-2029) ($ million)
- Data Table on Rest of World (ROW) - Market size and forecast (2024-2029) ($ million)
- Chart on Rest of World (ROW) - Year-over-year growth (2024-2029) (%)
- Data Table on Rest of World (ROW) - Year-over-year growth (2024-2029) (%)
- 14.24 Saudi Arabia - Market size and forecast (2024-2029)
- Chart on Saudi Arabia - Market size and forecast (2024-2029) ($ million)
- Data Table on Saudi Arabia - Market size and forecast (2024-2029) ($ million)
- Chart on Saudi Arabia - Year-over-year growth (2024-2029) (%)
- Data Table on Saudi Arabia - Year-over-year growth (2024-2029) (%)
- 14.25 Mexico - Market size and forecast (2024-2029)
- Chart on Mexico - Market size and forecast (2024-2029) ($ million)
- Data Table on Mexico - Market size and forecast (2024-2029) ($ million)
- Chart on Mexico - Year-over-year growth (2024-2029) (%)
- Data Table on Mexico - Year-over-year growth (2024-2029) (%)
15 Drivers, Challenges, and Opportunity/Restraints
- 15.3 Impact of drivers and challenges
- Impact of drivers and challenges in 2024 and 2029
- 15.4 Market opportunities/restraints
16 Competitive Landscape
- 16.2 Competitive Landscape
- Overview on criticality of inputs and factors of differentiation
- 16.3 Landscape disruption
- Overview on factors of disruption
- 16.4 Industry risks
- Impact of key risks on business
17 Competitive Analysis
- 17.2 Market positioning of companies
- Matrix on companies position and classification
- 17.3 Amazon Web Services Inc.
- Amazon Web Services Inc. - Overview
- Amazon Web Services Inc. - Product / Service
- Amazon Web Services Inc. - Key offerings
- 17.4 Microsoft Corporation
- Microsoft Corporation - Overview
- Microsoft Corporation - Product / Service
- Microsoft Corporation - Key offerings
- 17.5 Cisco Systems Inc.
- Cisco Systems Inc. - Overview
- Cisco Systems Inc. - Product / Service
- Cisco Systems Inc. - Key offerings
- 17.6 Genesys
- Genesys - Overview
- Genesys - Product / Service
- Genesys - Key offerings
- 17.7 NICE Ltd.
- NICE Ltd. - Overview
- NICE Ltd. - Product / Service
- NICE Ltd. - Key offerings
- 17.8 Five9 Inc.
- Five9 Inc. - Overview
- Five9 Inc. - Product / Service
- Five9 Inc. - Key offerings
- 17.9 Talkdesk Inc.
- Talkdesk Inc. - Overview
- Talkdesk Inc. - Product / Service
- Talkdesk Inc. - Key offerings
- 17.10 Zendesk Inc.
- Zendesk Inc. - Overview
- Zendesk Inc. - Product / Service
- Zendesk Inc. - Key offerings
- 17.11 RingCentral Inc.
- RingCentral Inc. - Overview
- RingCentral Inc. - Product / Service
- RingCentral Inc. - Key offerings
- 8x8 Inc.
- 8x8 Inc. - Overview
- 8x8 Inc. - Product / Service
- 8x8 Inc. - Key offerings
- 17.13 Vonage Holdings Corp.
- Vonage Holdings Corp. - Overview
- Vonage Holdings Corp. - Product / Service
- Vonage Holdings Corp. - Key offerings
- 17.14 Avaya Inc.
- Avaya Inc. - Overview
- Avaya Inc. - Product / Service
- Avaya Inc. - Key offerings
- 17.15 Mitel Networks Corporation
- Mitel Networks Corporation - Overview
- Mitel Networks Corporation - Product / Service
- Mitel Networks Corporation - Key offerings
- 17.16 Twilio Inc.
- Twilio Inc. - Overview
- Twilio Inc. - Product / Service
- Twilio Inc. - Key offerings
- 17.17 Dialpad Inc.
- Dialpad Inc. - Overview
- Dialpad Inc. - Product / Service
- Dialpad Inc. - Key offerings
- 17.18 UJET Inc.
- UJET Inc. - Overview
- UJET Inc. - Product / Service
- UJET Inc. - Key offerings
- 17.19 Freshworks Inc.
- Freshworks Inc. - Overview
- Freshworks Inc. - Product / Service
- Freshworks Inc. - Key offerings
- 17.20 LivePerson Inc.
- LivePerson Inc. - Overview
- LivePerson Inc. - Product / Service
- LivePerson Inc. - Key offerings
- 17.21 Content Guru
- Content Guru - Overview
- Content Guru - Product / Service
- Content Guru - Key offerings
- 17.22 Odigo
- Odigo - Overview
- Odigo - Product / Service
- Odigo - Key offerings
- 3CLogic Inc.
- 3CLogic Inc. - Overview
- 3CLogic Inc. - Product / Service
- 3CLogic Inc. - Key offerings
- 8x8 Inc.
- 8x8 Inc. - Overview
- 8x8 Inc. - Product / Service
- 8x8 Inc. - Key offerings
- 17.25 Alvaria Inc.
- Alvaria Inc. - Overview
- Alvaria Inc. - Product / Service
- Alvaria Inc. - Key offerings
- 17.26 Amazon Connect
- Amazon Connect - Overview
- Amazon Connect - Product / Service
- Amazon Connect - Key offerings
- 17.27 Atos SE
- Atos SE - Overview
- Atos SE - Product / Service
- Atos SE - Key offerings
- 17.28 Avaya LLC
- Avaya LLC - Overview
- Avaya LLC - Product / Service
- Avaya LLC - Key offerings
- 17.29 Capgemini Services SAS
- Capgemini Services SAS - Overview
- Capgemini Services SAS - Product / Service
- Capgemini Services SAS - Key offerings
- 17.30 China Huaxin Post and Telecom Technologies Co. Ltd.
- China Huaxin Post and Telecom Technologies Co. Ltd. - Overview
- China Huaxin Post and Telecom Technologies Co. Ltd. - Product / Service
- China Huaxin Post and Telecom Technologies Co. Ltd. - Key offerings
- 17.31 Cisco Systems Inc.
- Cisco Systems Inc. - Overview
- Cisco Systems Inc. - Product / Service
- Cisco Systems Inc. - Key offerings
- 17.32 Enghouse Systems Ltd.
- Enghouse Systems Ltd. - Overview
- Enghouse Systems Ltd. - Product / Service
- Enghouse Systems Ltd. - Key offerings
- 17.33 Evolve IP LLC
- Evolve IP LLC - Overview
- Evolve IP LLC - Product / Service
- Evolve IP LLC - Key offerings
- 17.34 Five9 Inc.
- Five9 Inc. - Overview
- Five9 Inc. - Product / Service
- Five9 Inc. - Key offerings
- 17.35 Genesys Telecommunications Laboratories Inc.
- Genesys Telecommunications Laboratories Inc. - Overview
- Genesys Telecommunications Laboratories Inc. - Product / Service
- Genesys Telecommunications Laboratories Inc. - Key offerings
- 17.36 Serenova LLC
- Serenova LLC - Overview
- Serenova LLC - Product / Service
- Serenova LLC - Key offerings
- 17.37 Lumen Technologies Inc.
- Lumen Technologies Inc. - Overview
- Lumen Technologies Inc. - Product / Service
- Lumen Technologies Inc. - Key offerings
- 17.38 Microsoft Corp.
- Microsoft Corp. - Overview
- Microsoft Corp. - Product / Service
- Microsoft Corp. - Key offerings
- 17.39 Mitel Networks Corp.
- Mitel Networks Corp. - Overview
- Mitel Networks Corp. - Product / Service
- Mitel Networks Corp. - Key offerings
- 17.40 Nice inContact
- Nice inContact - Overview
- Nice inContact - Product / Service
- Nice inContact - Key offerings
- 17.41 NICE Ltd.
- NICE Ltd. - Overview
- NICE Ltd. - Product / Service
- NICE Ltd. - Key offerings
- 17.42 Oracle Corp.
- Oracle Corp. - Overview
- Oracle Corp. - Product / Service
- Oracle Corp. - Key offerings
- 17.43 RingCentral Inc.
- RingCentral Inc. - Overview
- RingCentral Inc. - Product / Service
- RingCentral Inc. - Key offerings
- 17.44 SAP SE
- SAP SE - Overview
- SAP SE - Product / Service
- SAP SE - Key offerings
- 17.45 Twilio Inc.
- Twilio Inc. - Overview
- Twilio Inc. - Product / Service
- Twilio Inc. - Key offerings
18 Appendix
- 18.2 Inclusions and exclusions checklist
- Inclusions checklist
- Exclusions checklist
- 18.3 Currency conversion rates for US$
- Currency conversion rates for US$
- 18.4 Research methodology
- 18.7 Validation techniques employed for market sizing
- Validation techniques employed for market sizing
- 18.9 360 degree market analysis
- 360 degree market analysis
- 18.10 List of abbreviations