Contact Center Market Analysis, Size, and Forecast 2026-2030: North America (US, Canada, and Mexico), APAC (China, India, and Japan), Europe (Germany, France, and UK), South America (Brazil, Argentina, and Colombia), Middle East and Africa (South Africa, UAE, and Saudi Arabia), and Rest of World (ROW)

Contact Center Market Analysis, Size, and Forecast 2026-2030:
North America (US, Canada, and Mexico), APAC (China, India, and Japan), Europe (Germany, France, and UK), South America (Brazil, Argentina, and Colombia), Middle East and Africa (South Africa, UAE, and Saudi Arabia), and Rest of World (ROW)

Published: Mar 2026 295 Pages SKU: IRTNTR40477

Market Overview at a Glance

$259.3 B
Market Opportunity
11.1%
CAGR 2025 - 2030
34.2%
North America Growth
$151.5 B
Voice-based segment 2024

Contact Center Market Size 2026-2030

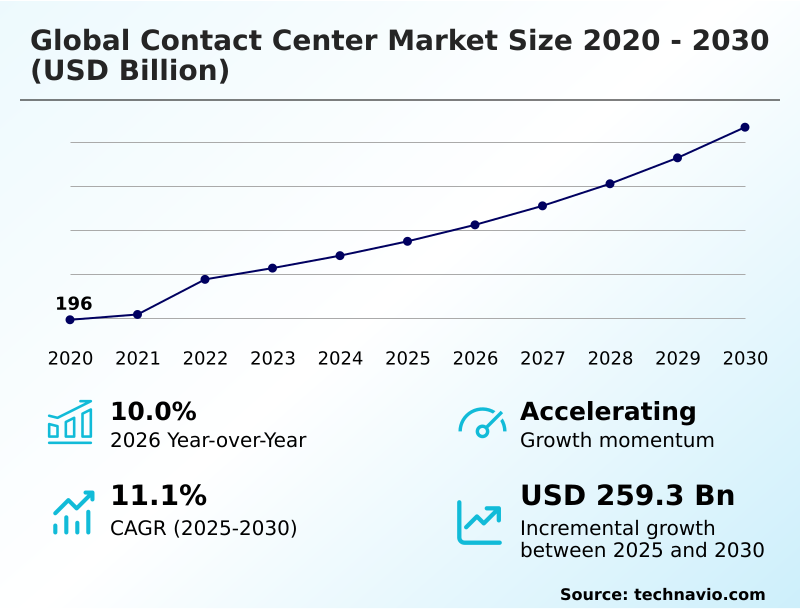
The contact center market size is valued to increase by USD 259.3 billion, at a CAGR of 11.1% from 2025 to 2030. Focus on reducing operating costs of businesses will drive the contact center market.

Major Market Trends & Insights

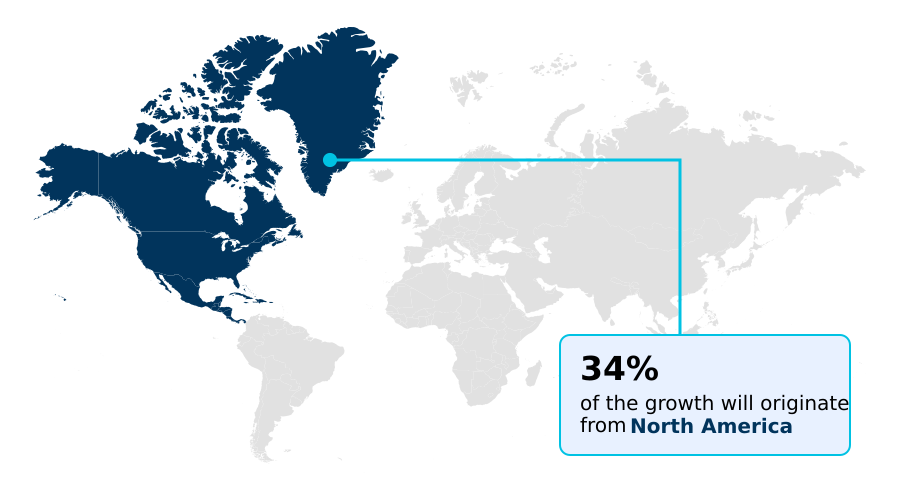
  • North America dominated the market and accounted for a 34.2% growth during the forecast period.
  • By Type - Voice-based segment was valued at USD 151.5 billion in 2024
  • By Deployment - On-premises segment accounted for the largest market revenue share in 2024

Market Size & Forecast

  • Market Opportunities: USD 437.6 billion
  • Market Future Opportunities: USD 259.3 billion
  • CAGR from 2025 to 2030 : 11.1%

Market Summary

  • The contact center market is undergoing a fundamental transformation, shifting from a traditional cost center to a strategic hub for customer engagement and business intelligence. This evolution is propelled by the widespread adoption of cloud-native architecture and the sophisticated integration of artificial intelligence.
  • AI-powered tools are now central to operations, enabling intelligent routing, predictive analytics, and advanced self-service portals that enhance customer satisfaction. A key business scenario involves retail enterprises leveraging omnichannel routing and workforce optimization tools to manage seasonal demand surges without compromising service quality.
  • By creating a unified customer journey map across all touchpoints—from social media to voice—companies can deliver personalized and seamless experiences. This strategic focus on technology-driven customer experience, rather than just cost containment, defines the modern competitive landscape.
  • The challenge remains in effectively managing data security and compliance within these increasingly complex, interconnected systems, which is critical for maintaining customer trust and ensuring long-term success.

What will be the Size of the Contact Center Market during the forecast period?

Get Key Insights on Market Forecast (PDF) Request Free Sample

How is the Contact Center Market Segmented?

The contact center industry research report provides comprehensive data (region-wise segment analysis), with forecasts and estimates in "USD billion" for the period 2026-2030, as well as historical data from 2020-2024 for the following segments.
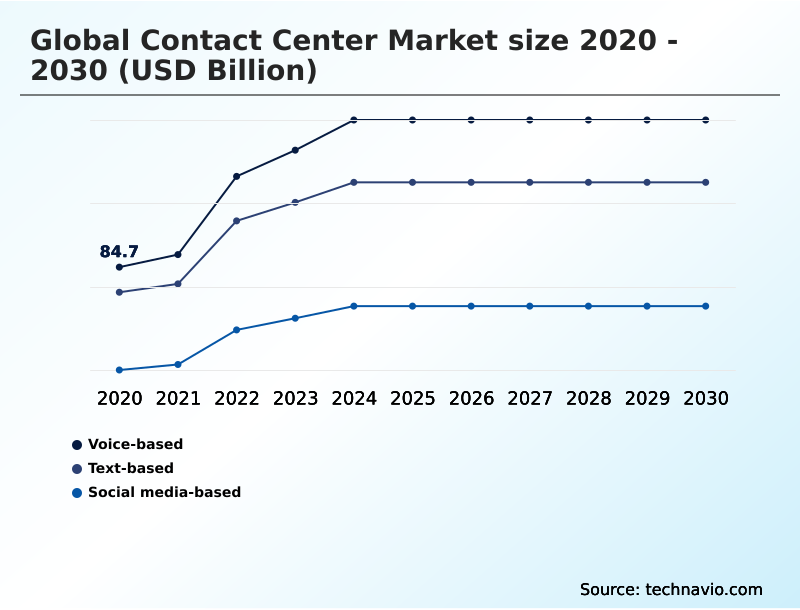
  • Type
    • Voice-based
    • Text-based
    • Social media-based
  • Deployment
    • On-premises
    • Cloud-based
  • Service
    • Professional services
    • Managed services
    • Cloud-based contact center as a services
  • Geography
    • North America
      • US
      • Canada
      • Mexico
    • APAC
      • China
      • India
      • Japan
    • Europe
      • Germany
      • France
      • UK
    • South America
      • Brazil
      • Argentina
      • Colombia
    • Middle East and Africa
      • South Africa
      • UAE
      • Saudi Arabia
    • Rest of World (ROW)

By Type Insights

The voice-based segment is estimated to witness significant growth during the forecast period.

The voice-based segment is evolving from a universal channel to a premium touchpoint for high-value interactions. Despite the rise of digital engagement channels, voice remains critical for complex or sensitive issues where human empathy is vital.

The integration of advanced speech analytics and real-time transcription is transforming this space. Technologies like emotional intelligence AI are being used to guide agent performance, improving the customer effort score.

A key trend is the use of voice biometrics for secure authentication, which has shown to reduce average handling time by over 15%.

This shift toward AI-augmented voice interactions, supported by robust knowledge management systems, redefines its role, focusing on quality and resolution rather than just volume, making it a cornerstone of effective customer experience management.

Request Free Sample

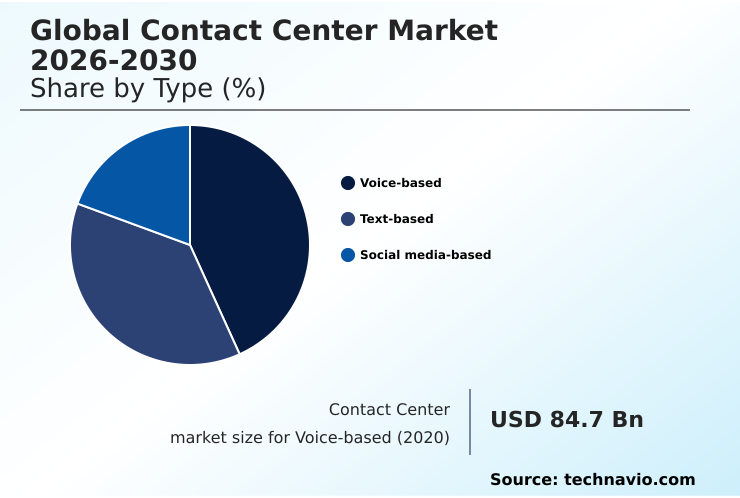
The Voice-based segment was valued at USD 151.5 billion in 2024 and showed a gradual increase during the forecast period.

Request Free Sample

Regional Analysis

North America is estimated to contribute 34.2% to the growth of the global market during the forecast period.Technavio’s analysts have elaborately explained the regional trends and drivers that shape the market during the forecast period.

See How Contact Center Market Demand is Rising in North America Request Free Sample

The global geographic landscape is characterized by diverse maturity levels and growth trajectories. North America remains the largest market, driven by heavy investment in agent empowerment tools and generative AI for agents to enhance customer experience.

In contrast, APAC is the fastest-growing region, with many enterprises leapfrogging legacy systems to adopt mobile-first, social media customer care strategies; this has led to a 40% increase in digital channel adoption over the past two years.

Europe's market is shaped by stringent compliance and data privacy regulations, pushing demand for secure, cloud-based IVR self-service automation and business intelligence integration.

Across regions, nearshoring to locations like South America and Eastern Europe is a prevalent strategy to manage costs, often reducing operational expenses by up to 30% while accessing skilled, multilingual talent pools for end-to-end journey orchestration.

Market Dynamics

Our researchers analyzed the data with 2025 as the base year, along with the key drivers, trends, and challenges. A holistic analysis of drivers will help companies refine their marketing strategies to gain a competitive advantage.

  • Strategic decision-making in the contemporary contact center environment requires a comprehensive evaluation of technology, operations, and security. A critical initial assessment involves weighing on-premise vs cloud contact center security, where cloud solutions now offer robust, certified environments that often exceed the capabilities of in-house teams.
  • The focus then shifts to implementing AI for proactive customer service, which moves the organization from a reactive to a predictive engagement model. Key to this is understanding how to improve first call resolution rate, a metric directly impacted by technologies that provide agents with immediate access to relevant information.
  • This is where the benefits of omnichannel customer engagement become clear, as a unified view of the customer journey provides essential context. Organizations are adopting best practices for workforce optimization, using AI for predictive call routing and scheduling to match agent skills with customer needs.
  • Successfully integrating CRM with contact center platforms is fundamental, creating a single source of truth that enriches every interaction. To combat high turnover, a significant focus is placed on reducing agent attrition in call centers through better tools and career pathing.
  • Many are using speech analytics for quality assurance, moving beyond random sampling to analyze 100% of interactions for compliance and training opportunities. This data-driven approach helps to clarify the role of IVR in modern contact centers, optimizing it for efficient self-service while ensuring seamless escalation.
  • To justify investments, businesses are measuring ROI of conversational AI and leveraging customer journey analytics use cases to refine strategies. Ultimately, adopting technology for personalized customer interactions, supported by a cohesive unified communications platform benefits the entire enterprise, leading to efficiency gains that are often double that of siloed approaches.

What are the key market drivers leading to the rise in the adoption of Contact Center Industry?

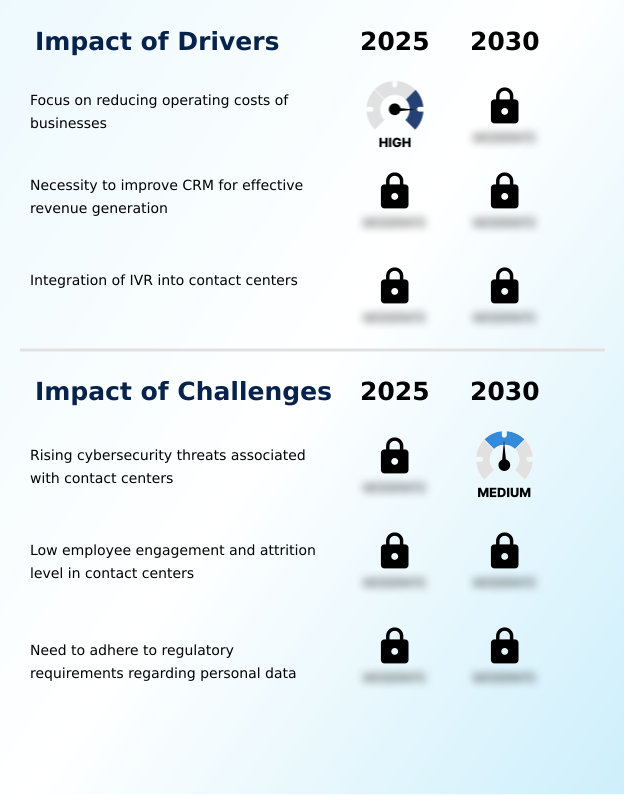
  • A primary driver for the market is the sustained business focus on reducing operational costs while enhancing service quality.

  • Market growth is primarily driven by the enterprise-wide mandate to enhance customer experience management while simultaneously reducing operational expenditures.
  • The migration to cloud contact center platforms is a central driver, as these solutions can lower the total cost of ownership by up to 35% compared to maintaining on-premise infrastructure.
  • This shift enables businesses of all sizes to access advanced capabilities like workforce management software and a unified agent desktop.
  • The necessity to improve CRM for effective revenue generation is another powerful driver; deep customer relationship management integration allows for more personalized interactions and has been linked to a 25% increase in successful cross-sell and upsell opportunities.
  • Furthermore, the relentless pursuit of efficiency through contact center automation and outbound dialing solutions continues to fuel investment in technologies that optimize agent productivity and resource allocation.

What are the market trends shaping the Contact Center Industry?

  • The integration of chatbots into business operations represents an emerging market trend. This is primarily aimed at improving customer service turnaround times and operational efficiency.

  • Key market trends revolve around the hyper-automation of customer interactions and the strategic use of AI-driven insights. The adoption of AI-powered chatbots and intelligent virtual agents continues to accelerate, with deployments successfully resolving up to 75% of tier-one inquiries without human intervention, directly improving turnaround times.
  • There is a significant push towards true omnichannel customer engagement, where unified platforms that support end-to-end journey orchestration have been shown to increase customer retention by over 15% compared to multichannel approaches. Another dominant trend is the use of contact center analytics and real-time monitoring to inform business strategy.
  • This data-driven approach, which includes customer sentiment tracking and post-call summarization, allows organizations to proactively identify service gaps and refine operations, driving continuous improvement and a more personalized customer experience.

What challenges does the Contact Center Industry face during its growth?

  • Rising cybersecurity threats associated with the handling of sensitive customer data in contact centers present a key challenge to industry growth and stability.

  • The market faces significant challenges, primarily centered on security, workforce stability, and regulatory adherence. The rising sophistication of cybersecurity threats necessitates constant investment in secure payment handling protocols and robust infrastructure, as a single data breach can have devastating financial and reputational consequences.
  • Employee retention remains a critical issue, with contact centers experiencing attrition rates approaching 45% in some sectors, nearly double the average of other industries, which drives up recruitment and training costs. Navigating the complex web of compliance and data privacy regulations, such as GDPR and CCPA, is an ongoing operational burden.
  • Failure to adhere to strict call recording and quality monitoring rules can result in substantial penalties. These challenges compel organizations to prioritize remote agent solutions and advanced security measures to ensure operational resilience and trustworthiness.

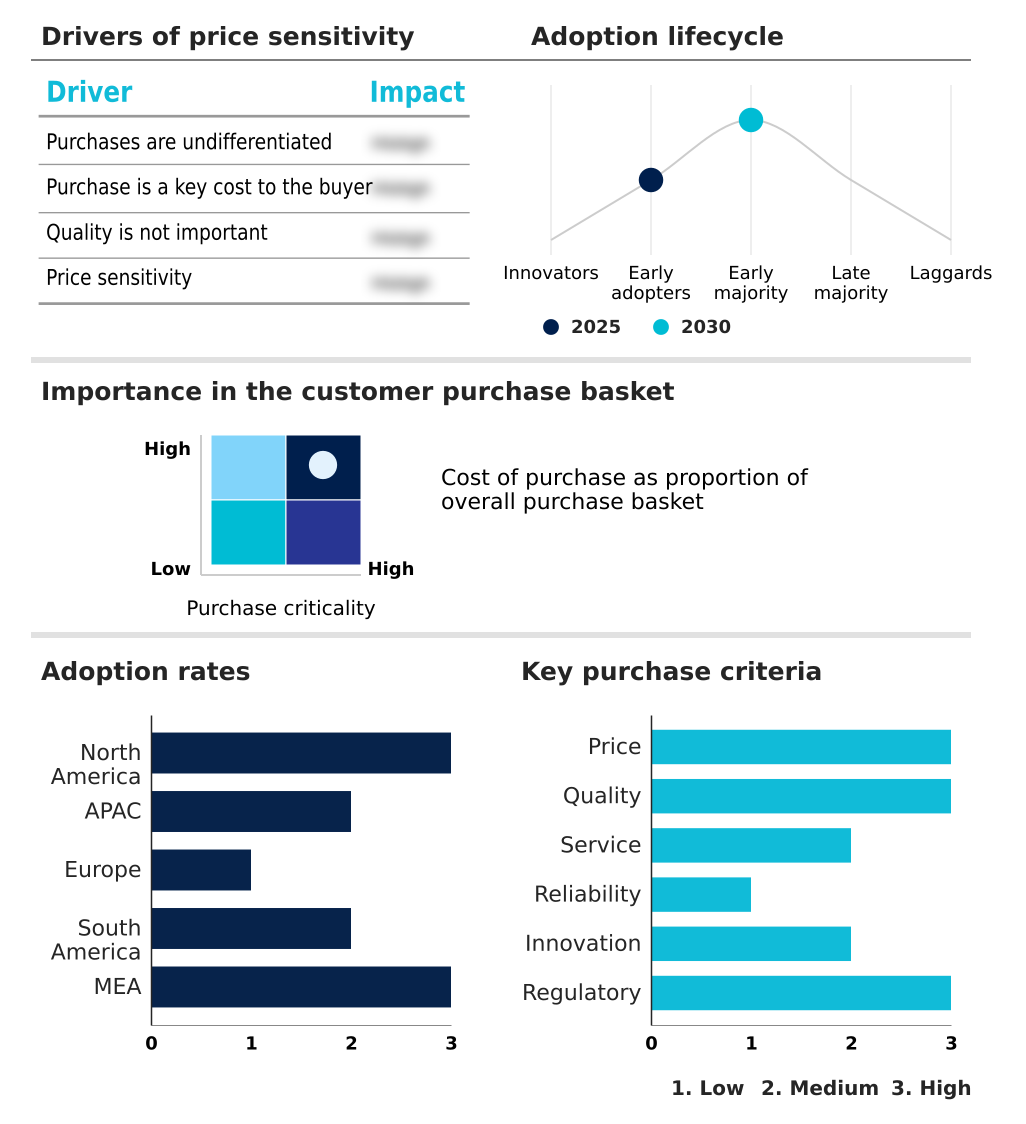
Exclusive Technavio Analysis on Customer Landscape

The contact center market forecasting report includes the adoption lifecycle of the market, covering from the innovator’s stage to the laggard’s stage. It focuses on adoption rates in different regions based on penetration. Furthermore, the contact center market report also includes key purchase criteria and drivers of price sensitivity to help companies evaluate and develop their market growth analysis strategies.

Customer Landscape of Contact Center Industry

Competitive Landscape

Companies are implementing various strategies, such as strategic alliances, contact center market forecast, partnerships, mergers and acquisitions, geographical expansion, and product/service launches, to enhance their presence in the industry.

8x8 Inc. - Providers offer integrated, cloud-native contact center platforms designed to enhance customer engagement and operational efficiency through advanced, AI-powered automation and analytics.

The industry research and growth report includes detailed analyses of the competitive landscape of the market and information about key companies, including:

  • 8x8 Inc.
  • ALE International
  • Alvaria Inc.
  • Amazon.com Inc.
  • Ameyo Pvt Ltd.
  • Atos SE
  • Avaya LLC
  • Cisco Systems Inc.
  • Enghouse Systems Ltd.
  • Five9 Inc.
  • Genesys Telecom Lab Inc.
  • Google LLC
  • Mitel Networks Corp.
  • NEC Corp.
  • NICE Ltd.
  • SAP SE
  • Vocalcom Group
  • Vonage Holdings Corp.
  • Zendesk Inc.
  • ZTE Corp.

Qualitative and quantitative analysis of companies has been conducted to help clients understand the wider business environment as well as the strengths and weaknesses of key industry players. Data is qualitatively analyzed to categorize companies as pure play, category-focused, industry-focused, and diversified; it is quantitatively analyzed to categorize companies as dominant, leading, strong, tentative, and weak.

Recent Development and News in Contact center market

  • In August, 2025, Onix strengthened its market position through the acquisition of the UJET services business, a move designed to enhance its alignment with Google Cloud's Customer Engagement AI Suite and scale its capacity for deploying complex, AI-driven enterprise contact center solutions.
  • In October, 2025, NICE introduced its AI Ops Center, a new operational control layer for the NICE Cognigy platform, providing a unified dashboard for monitoring AI agent performance, detecting bottlenecks, and ensuring system reliability across customer experience environments.
  • In May, 2025, Genesys enhanced its Genesys Cloud platform by expanding its native cloud journey management capabilities, enabling organizations to gain deeper visibility into customer behavior and more effectively build, monitor, and analyze end-to-end customer interactions.
  • In April, 2025, Google Cloud significantly upgraded its Contact Center AI Platform by integrating its Gemini models to power new functionalities, including an advanced Customer Engagement Suite and enhanced Agent Assist capabilities, focusing on augmenting agent performance and improving customer self-service.

Dive into Technavio’s robust research methodology, blending expert interviews, extensive data synthesis, and validated models for unparalleled Contact Center Market insights. See full methodology.

Market Scope
Page number 295
Base year 2025
Historic period 2020-2024
Forecast period 2026-2030
Growth momentum & CAGR Accelerate at a CAGR of 11.1%
Market growth 2026-2030 USD 259.3 billion
Market structure Fragmented
YoY growth 2025-2026(%) 10.0%
Key countries US, Canada, Mexico, China, India, Japan, Philippines, Australia, Indonesia, Germany, France, UK, Spain, The Netherlands, Italy, Brazil, Argentina, Colombia, South Africa, UAE, Saudi Arabia, Egypt and Nigeria
Competitive landscape Leading Companies, Market Positioning of Companies, Competitive Strategies, and Industry Risks

Request Free Sample

Research Analyst Overview

  • The contact center market is advancing beyond its traditional role, becoming a critical engine for enterprise-wide intelligence and customer loyalty. The pervasive integration of conversational AI and natural language processing is automating routine interactions and, more importantly, augmenting human agents.
  • Boardroom decisions increasingly focus on balancing investments in workforce engagement management with robotic process automation to optimize both efficiency and employee satisfaction. The deployment of sophisticated agent assist tools, which provide real-time guidance and access to information, has demonstrated a 30% reduction in agent onboarding time and a notable improvement in net promoter score.
  • This technological shift is underpinned by a transition to contact center as a service platforms built on cloud-native architecture. These platforms facilitate the use of advanced predictive analytics, speech analytics, and sentiment analysis to drive strategic initiatives. By leveraging technologies like computer telephony integration, voice biometrics, and intelligent routing, organizations are personalizing customer journey mapping.
  • This focus on first call resolution and optimizing average handling time through skills-based routing and call deflection strategies is crucial for maintaining a competitive edge.

What are the Key Data Covered in this Contact Center Market Research and Growth Report?

  • What is the expected growth of the Contact Center Market between 2026 and 2030?

    • USD 259.3 billion, at a CAGR of 11.1%

  • What segmentation does the market report cover?

    • The report is segmented by Type (Voice-based, Text-based, and Social media-based), Deployment (On-premises, and Cloud-based), Service (Professional services, Managed services, and Cloud-based contact center as a services) and Geography (North America, APAC, Europe, South America, Middle East and Africa)

  • Which regions are analyzed in the report?

    • North America, APAC, Europe, South America and Middle East and Africa

  • What are the key growth drivers and market challenges?

    • Focus on reducing operating costs of businesses, Rising cybersecurity threats associated with contact centers

  • Who are the major players in the Contact Center Market?

    • 8x8 Inc., ALE International, Alvaria Inc., Amazon.com Inc., Ameyo Pvt Ltd., Atos SE, Avaya LLC, Cisco Systems Inc., Enghouse Systems Ltd., Five9 Inc., Genesys Telecom Lab Inc., Google LLC, Mitel Networks Corp., NEC Corp., NICE Ltd., SAP SE, Vocalcom Group, Vonage Holdings Corp., Zendesk Inc. and ZTE Corp.

Market Research Insights

  • Market dynamics are defined by a strategic shift toward data-driven customer insights and operational agility, powered by AI in customer service. The adoption of cloud contact center platforms is accelerating, with businesses achieving an average 20% improvement in agent productivity compared to legacy on-premise systems.
  • This transition is not merely about infrastructure; it's about embedding intelligent virtual agents and contact center automation into core workflows. For instance, implementing AI-powered chatbots for initial query handling has proven to deflect up to 60% of routine inquiries, freeing human agents for more complex tasks.
  • Furthermore, sophisticated contact center analytics, fueled by proactive customer outreach and customer sentiment tracking, improve first call resolution rates by more than 15%. This focus on agent performance metrics and omnichannel customer engagement is creating a more resilient and responsive service environment.

We can help! Our analysts can customize this contact center market research report to meet your requirements.

Get in touch

1. Executive Summary

1.1 Market overview

Executive Summary - Chart on Market Overview
Executive Summary - Data Table on Market Overview
Executive Summary - Chart on Global Market Characteristics
Executive Summary - Chart on Market by Geography
Executive Summary - Chart on Market Segmentation by Type
Executive Summary - Chart on Market Segmentation by Deployment
Executive Summary - Chart on Market Segmentation by Service
Executive Summary - Chart on Incremental Growth
Executive Summary - Data Table on Incremental Growth
Executive Summary - Chart on Company Market Positioning

2. Technavio Analysis

2.1 Analysis of price sensitivity, lifecycle, customer purchase basket, adoption rates, and purchase criteria

2.2 Criticality of inputs and Factors of differentiation

Chart on Overview on criticality of inputs and factors of differentiation

2.3 Factors of disruption

Chart on Overview on factors of disruption

2.4 Impact of drivers and challenges

Chart on Impact of drivers and challenges in 2025 and 2030

3. Market Landscape

3.1 Market ecosystem

Chart on Parent Market
Data Table on - Parent Market

3.2 Market characteristics

Chart on Market characteristics analysis

3.3 Value chain analysis

Chart on Value chain analysis

4. Market Sizing

4.1 Market definition

Data Table on Offerings of companies included in the market definition

4.2 Market segment analysis

Market segments

4.3 Market size 2025

4.4 Market outlook: Forecast for 2025-2030

Chart on Global - Market size and forecast 2025-2030 ($ billion)
Data Table on Global - Market size and forecast 2025-2030 ($ billion)
Chart on Global Market: Year-over-year growth 2025-2030 (%)
Data Table on Global Market: Year-over-year growth 2025-2030 (%)

5. Historic Market Size

5.1 Global Contact Center Market 2020 - 2024

Historic Market Size - Data Table on Global Contact Center Market 2020 - 2024 ($ billion)

5.2 Type segment analysis 2020 - 2024

Historic Market Size - Type Segment 2020 - 2024 ($ billion)

5.3 Deployment segment analysis 2020 - 2024

Historic Market Size - Deployment Segment 2020 - 2024 ($ billion)

5.4 Service segment analysis 2020 - 2024

Historic Market Size - Service Segment 2020 - 2024 ($ billion)

5.5 Geography segment analysis 2020 - 2024

Historic Market Size - Geography Segment 2020 - 2024 ($ billion)

5.6 Country segment analysis 2020 - 2024

Historic Market Size - Country Segment 2020 - 2024 ($ billion)

6. Qualitative Analysis

6.1 Impact of AI on The Global Contact Center Market

7. Five Forces Analysis

7.1 Five forces summary

Five forces analysis - Comparison between 2025 and 2030

7.2 Bargaining power of buyers

Bargaining power of buyers - Impact of key factors 2025 and 2030

7.3 Bargaining power of suppliers

Bargaining power of suppliers - Impact of key factors in 2025 and 2030

7.4 Threat of new entrants

Threat of new entrants - Impact of key factors in 2025 and 2030

7.5 Threat of substitutes

Threat of substitutes - Impact of key factors in 2025 and 2030

7.6 Threat of rivalry

Threat of rivalry - Impact of key factors in 2025 and 2030

7.7 Market condition

Chart on Market condition - Five forces 2025 and 2030

8. Market Segmentation by Type

8.1 Market segments

Chart on Type - Market share 2025-2030 (%)
Data Table on Type - Market share 2025-2030 (%)

8.2 Comparison by Type

Chart on Comparison by Type
Data Table on Comparison by Type

8.3 Voice-based - Market size and forecast 2025-2030

Chart on Voice-based - Market size and forecast 2025-2030 ($ billion)
Data Table on Voice-based - Market size and forecast 2025-2030 ($ billion)
Chart on Voice-based - Year-over-year growth 2025-2030 (%)
Data Table on Voice-based - Year-over-year growth 2025-2030 (%)

8.4 Text-based - Market size and forecast 2025-2030

Chart on Text-based - Market size and forecast 2025-2030 ($ billion)
Data Table on Text-based - Market size and forecast 2025-2030 ($ billion)
Chart on Text-based - Year-over-year growth 2025-2030 (%)
Data Table on Text-based - Year-over-year growth 2025-2030 (%)

8.5 Social media-based - Market size and forecast 2025-2030

Chart on Social media-based - Market size and forecast 2025-2030 ($ billion)
Data Table on Social media-based - Market size and forecast 2025-2030 ($ billion)
Chart on Social media-based - Year-over-year growth 2025-2030 (%)
Data Table on Social media-based - Year-over-year growth 2025-2030 (%)

8.6 Market opportunity by Type

Market opportunity by Type ($ billion)
Data Table on Market opportunity by Type ($ billion)

9. Market Segmentation by Deployment

9.1 Market segments

Chart on Deployment - Market share 2025-2030 (%)
Data Table on Deployment - Market share 2025-2030 (%)

9.2 Comparison by Deployment

Chart on Comparison by Deployment
Data Table on Comparison by Deployment

9.3 On-premises - Market size and forecast 2025-2030

Chart on On-premises - Market size and forecast 2025-2030 ($ billion)
Data Table on On-premises - Market size and forecast 2025-2030 ($ billion)
Chart on On-premises - Year-over-year growth 2025-2030 (%)
Data Table on On-premises - Year-over-year growth 2025-2030 (%)

9.4 Cloud-based - Market size and forecast 2025-2030

Chart on Cloud-based - Market size and forecast 2025-2030 ($ billion)
Data Table on Cloud-based - Market size and forecast 2025-2030 ($ billion)
Chart on Cloud-based - Year-over-year growth 2025-2030 (%)
Data Table on Cloud-based - Year-over-year growth 2025-2030 (%)

9.5 Market opportunity by Deployment

Market opportunity by Deployment ($ billion)
Data Table on Market opportunity by Deployment ($ billion)

10. Market Segmentation by Service

10.1 Market segments

Chart on Service - Market share 2025-2030 (%)
Data Table on Service - Market share 2025-2030 (%)

10.2 Comparison by Service

Chart on Comparison by Service
Data Table on Comparison by Service

10.3 Professional services - Market size and forecast 2025-2030

Chart on Professional services - Market size and forecast 2025-2030 ($ billion)
Data Table on Professional services - Market size and forecast 2025-2030 ($ billion)
Chart on Professional services - Year-over-year growth 2025-2030 (%)
Data Table on Professional services - Year-over-year growth 2025-2030 (%)

10.4 Managed services - Market size and forecast 2025-2030

Chart on Managed services - Market size and forecast 2025-2030 ($ billion)
Data Table on Managed services - Market size and forecast 2025-2030 ($ billion)
Chart on Managed services - Year-over-year growth 2025-2030 (%)
Data Table on Managed services - Year-over-year growth 2025-2030 (%)

10.5 Cloud-based contact center as a services - Market size and forecast 2025-2030

Chart on Cloud-based contact center as a services - Market size and forecast 2025-2030 ($ billion)
Data Table on Cloud-based contact center as a services - Market size and forecast 2025-2030 ($ billion)
Chart on Cloud-based contact center as a services - Year-over-year growth 2025-2030 (%)
Data Table on Cloud-based contact center as a services - Year-over-year growth 2025-2030 (%)

10.6 Market opportunity by Service

Market opportunity by Service ($ billion)
Data Table on Market opportunity by Service ($ billion)

11. Customer Landscape

11.1 Customer landscape overview

Analysis of price sensitivity, lifecycle, customer purchase basket, adoption rates, and purchase criteria

12. Geographic Landscape

12.1 Geographic segmentation

Chart on Market share by geography 2025-2030 (%)
Data Table on Market share by geography 2025-2030 (%)

12.2 Geographic comparison

Chart on Geographic comparison
Data Table on Geographic comparison

12.3 North America - Market size and forecast 2025-2030

Chart on North America - Market size and forecast 2025-2030 ($ billion)
Data Table on North America - Market size and forecast 2025-2030 ($ billion)
Chart on North America - Year-over-year growth 2025-2030 (%)
Data Table on North America - Year-over-year growth 2025-2030 (%)
Chart on Regional Comparison - North America
Data Table on Regional Comparison - North America

12.3.1 US - Market size and forecast 2025-2030

Chart on US - Market size and forecast 2025-2030 ($ billion)
Data Table on US - Market size and forecast 2025-2030 ($ billion)
Chart on US - Year-over-year growth 2025-2030 (%)
Data Table on US - Year-over-year growth 2025-2030 (%)

12.3.2 Canada - Market size and forecast 2025-2030

Chart on Canada - Market size and forecast 2025-2030 ($ billion)
Data Table on Canada - Market size and forecast 2025-2030 ($ billion)
Chart on Canada - Year-over-year growth 2025-2030 (%)
Data Table on Canada - Year-over-year growth 2025-2030 (%)

12.3.3 Mexico - Market size and forecast 2025-2030

Chart on Mexico - Market size and forecast 2025-2030 ($ billion)
Data Table on Mexico - Market size and forecast 2025-2030 ($ billion)
Chart on Mexico - Year-over-year growth 2025-2030 (%)
Data Table on Mexico - Year-over-year growth 2025-2030 (%)

12.4 APAC - Market size and forecast 2025-2030

Chart on APAC - Market size and forecast 2025-2030 ($ billion)
Data Table on APAC - Market size and forecast 2025-2030 ($ billion)
Chart on APAC - Year-over-year growth 2025-2030 (%)
Data Table on APAC - Year-over-year growth 2025-2030 (%)
Chart on Regional Comparison - APAC
Data Table on Regional Comparison - APAC

12.4.1 China - Market size and forecast 2025-2030

Chart on China - Market size and forecast 2025-2030 ($ billion)
Data Table on China - Market size and forecast 2025-2030 ($ billion)
Chart on China - Year-over-year growth 2025-2030 (%)
Data Table on China - Year-over-year growth 2025-2030 (%)

12.4.2 India - Market size and forecast 2025-2030

Chart on India - Market size and forecast 2025-2030 ($ billion)
Data Table on India - Market size and forecast 2025-2030 ($ billion)
Chart on India - Year-over-year growth 2025-2030 (%)
Data Table on India - Year-over-year growth 2025-2030 (%)

12.4.3 Japan - Market size and forecast 2025-2030

Chart on Japan - Market size and forecast 2025-2030 ($ billion)
Data Table on Japan - Market size and forecast 2025-2030 ($ billion)
Chart on Japan - Year-over-year growth 2025-2030 (%)
Data Table on Japan - Year-over-year growth 2025-2030 (%)

12.4.4 Philippines - Market size and forecast 2025-2030

Chart on Philippines - Market size and forecast 2025-2030 ($ billion)
Data Table on Philippines - Market size and forecast 2025-2030 ($ billion)
Chart on Philippines - Year-over-year growth 2025-2030 (%)
Data Table on Philippines - Year-over-year growth 2025-2030 (%)

12.4.5 Australia - Market size and forecast 2025-2030

Chart on Australia - Market size and forecast 2025-2030 ($ billion)
Data Table on Australia - Market size and forecast 2025-2030 ($ billion)
Chart on Australia - Year-over-year growth 2025-2030 (%)
Data Table on Australia - Year-over-year growth 2025-2030 (%)

12.4.6 Indonesia - Market size and forecast 2025-2030

Chart on Indonesia - Market size and forecast 2025-2030 ($ billion)
Data Table on Indonesia - Market size and forecast 2025-2030 ($ billion)
Chart on Indonesia - Year-over-year growth 2025-2030 (%)
Data Table on Indonesia - Year-over-year growth 2025-2030 (%)

12.5 Europe - Market size and forecast 2025-2030

Chart on Europe - Market size and forecast 2025-2030 ($ billion)
Data Table on Europe - Market size and forecast 2025-2030 ($ billion)
Chart on Europe - Year-over-year growth 2025-2030 (%)
Data Table on Europe - Year-over-year growth 2025-2030 (%)
Chart on Regional Comparison - Europe
Data Table on Regional Comparison - Europe

12.5.1 Germany - Market size and forecast 2025-2030

Chart on Germany - Market size and forecast 2025-2030 ($ billion)
Data Table on Germany - Market size and forecast 2025-2030 ($ billion)
Chart on Germany - Year-over-year growth 2025-2030 (%)
Data Table on Germany - Year-over-year growth 2025-2030 (%)

12.5.2 France - Market size and forecast 2025-2030

Chart on France - Market size and forecast 2025-2030 ($ billion)
Data Table on France - Market size and forecast 2025-2030 ($ billion)
Chart on France - Year-over-year growth 2025-2030 (%)
Data Table on France - Year-over-year growth 2025-2030 (%)

12.5.3 UK - Market size and forecast 2025-2030

Chart on UK - Market size and forecast 2025-2030 ($ billion)
Data Table on UK - Market size and forecast 2025-2030 ($ billion)
Chart on UK - Year-over-year growth 2025-2030 (%)
Data Table on UK - Year-over-year growth 2025-2030 (%)

12.5.4 Spain - Market size and forecast 2025-2030

Chart on Spain - Market size and forecast 2025-2030 ($ billion)
Data Table on Spain - Market size and forecast 2025-2030 ($ billion)
Chart on Spain - Year-over-year growth 2025-2030 (%)
Data Table on Spain - Year-over-year growth 2025-2030 (%)

12.5.5 The Netherlands - Market size and forecast 2025-2030

Chart on The Netherlands - Market size and forecast 2025-2030 ($ billion)
Data Table on The Netherlands - Market size and forecast 2025-2030 ($ billion)
Chart on The Netherlands - Year-over-year growth 2025-2030 (%)
Data Table on The Netherlands - Year-over-year growth 2025-2030 (%)

12.5.6 Italy - Market size and forecast 2025-2030

Chart on Italy - Market size and forecast 2025-2030 ($ billion)
Data Table on Italy - Market size and forecast 2025-2030 ($ billion)
Chart on Italy - Year-over-year growth 2025-2030 (%)
Data Table on Italy - Year-over-year growth 2025-2030 (%)

12.6 South America - Market size and forecast 2025-2030

Chart on South America - Market size and forecast 2025-2030 ($ billion)
Data Table on South America - Market size and forecast 2025-2030 ($ billion)
Chart on South America - Year-over-year growth 2025-2030 (%)
Data Table on South America - Year-over-year growth 2025-2030 (%)
Chart on Regional Comparison - South America
Data Table on Regional Comparison - South America

12.6.1 Brazil - Market size and forecast 2025-2030

Chart on Brazil - Market size and forecast 2025-2030 ($ billion)
Data Table on Brazil - Market size and forecast 2025-2030 ($ billion)
Chart on Brazil - Year-over-year growth 2025-2030 (%)
Data Table on Brazil - Year-over-year growth 2025-2030 (%)

12.6.2 Argentina - Market size and forecast 2025-2030

Chart on Argentina - Market size and forecast 2025-2030 ($ billion)
Data Table on Argentina - Market size and forecast 2025-2030 ($ billion)
Chart on Argentina - Year-over-year growth 2025-2030 (%)
Data Table on Argentina - Year-over-year growth 2025-2030 (%)

12.6.3 Colombia - Market size and forecast 2025-2030

Chart on Colombia - Market size and forecast 2025-2030 ($ billion)
Data Table on Colombia - Market size and forecast 2025-2030 ($ billion)
Chart on Colombia - Year-over-year growth 2025-2030 (%)
Data Table on Colombia - Year-over-year growth 2025-2030 (%)

12.7 Middle East and Africa - Market size and forecast 2025-2030

Chart on Middle East and Africa - Market size and forecast 2025-2030 ($ billion)
Data Table on Middle East and Africa - Market size and forecast 2025-2030 ($ billion)
Chart on Middle East and Africa - Year-over-year growth 2025-2030 (%)
Data Table on Middle East and Africa - Year-over-year growth 2025-2030 (%)
Chart on Regional Comparison - Middle East and Africa
Data Table on Regional Comparison - Middle East and Africa

12.7.1 South Africa - Market size and forecast 2025-2030

Chart on South Africa - Market size and forecast 2025-2030 ($ billion)
Data Table on South Africa - Market size and forecast 2025-2030 ($ billion)
Chart on South Africa - Year-over-year growth 2025-2030 (%)
Data Table on South Africa - Year-over-year growth 2025-2030 (%)

12.7.2 UAE - Market size and forecast 2025-2030

Chart on UAE - Market size and forecast 2025-2030 ($ billion)
Data Table on UAE - Market size and forecast 2025-2030 ($ billion)
Chart on UAE - Year-over-year growth 2025-2030 (%)
Data Table on UAE - Year-over-year growth 2025-2030 (%)

12.7.3 Saudi Arabia - Market size and forecast 2025-2030

Chart on Saudi Arabia - Market size and forecast 2025-2030 ($ billion)
Data Table on Saudi Arabia - Market size and forecast 2025-2030 ($ billion)
Chart on Saudi Arabia - Year-over-year growth 2025-2030 (%)
Data Table on Saudi Arabia - Year-over-year growth 2025-2030 (%)

12.7.4 Egypt - Market size and forecast 2025-2030

Chart on Egypt - Market size and forecast 2025-2030 ($ billion)
Data Table on Egypt - Market size and forecast 2025-2030 ($ billion)
Chart on Egypt - Year-over-year growth 2025-2030 (%)
Data Table on Egypt - Year-over-year growth 2025-2030 (%)

12.7.5 Nigeria - Market size and forecast 2025-2030

Chart on Nigeria - Market size and forecast 2025-2030 ($ billion)
Data Table on Nigeria - Market size and forecast 2025-2030 ($ billion)
Chart on Nigeria - Year-over-year growth 2025-2030 (%)
Data Table on Nigeria - Year-over-year growth 2025-2030 (%)

12.8 Market opportunity by geography

Market opportunity by geography ($ billion)
Data Tables on Market opportunity by geography ($ billion)

13. Drivers, Challenges, and Opportunity

13.1 Market drivers

Focus on reducing operating costs of businesses
Necessity to improve CRM for effective revenue generation
Integration of IVR into contact centers

13.2 Market challenges

Rising cybersecurity threats associated with contact centers
Low employee engagement and attrition level in contact centers
Need to adhere to regulatory requirements regarding personal data

13.3 Impact of drivers and challenges

Impact of drivers and challenges in 2025 and 2030

13.4 Market opportunities

Integration of chatbots into businesses for better turnaround times
Rising adoption of cloud-based contact centers
Incorporation of AI into contact centers for providing customized solutions

14. Competitive Landscape

14.1 Overview

14.2

Overview on criticality of inputs and factors of differentiation

14.3 Landscape disruption

Overview on factors of disruption

14.4 Industry risks

Impact of key risks on business

15. Competitive Analysis

15.1 Companies profiled

Companies covered

15.2 Company ranking index

15.3 Market positioning of companies

Matrix on companies position and classification

15.4 8x8 Inc.

8x8 Inc. - Overview
8x8 Inc. - Product / Service
8x8 Inc. - Key news
8x8 Inc. - Key offerings
SWOT

15.5 ALE International

ALE International - Overview
ALE International - Product / Service
ALE International - Key offerings
SWOT

15.6 Alvaria Inc.

Alvaria Inc. - Overview
Alvaria Inc. - Product / Service
Alvaria Inc. - Key offerings
SWOT

15.7 Amazon.com Inc.

Amazon.com Inc. - Overview
Amazon.com Inc. - Business segments
Amazon.com Inc. - Key news
Amazon.com Inc. - Key offerings
Amazon.com Inc. - Segment focus
SWOT

15.8 Ameyo Pvt Ltd.

Ameyo Pvt Ltd. - Overview
Ameyo Pvt Ltd. - Product / Service
Ameyo Pvt Ltd. - Key offerings
SWOT

15.9 Atos SE

Atos SE - Overview
Atos SE - Business segments
Atos SE - Key news
Atos SE - Key offerings
Atos SE - Segment focus
SWOT

15.10 Avaya LLC

Avaya LLC - Overview
Avaya LLC - Product / Service
Avaya LLC - Key news
Avaya LLC - Key offerings
SWOT

15.11 Cisco Systems Inc.

Cisco Systems Inc. - Overview
Cisco Systems Inc. - Business segments
Cisco Systems Inc. - Key news
Cisco Systems Inc. - Key offerings
Cisco Systems Inc. - Segment focus
SWOT

15.12 Enghouse Systems Ltd.

Enghouse Systems Ltd. - Overview
Enghouse Systems Ltd. - Business segments
Enghouse Systems Ltd. - Key offerings
Enghouse Systems Ltd. - Segment focus
SWOT

15.13 Five9 Inc.

Five9 Inc. - Overview
Five9 Inc. - Product / Service
Five9 Inc. - Key news
Five9 Inc. - Key offerings
SWOT

15.14 Genesys Telecom Lab Inc.

Genesys Telecom Lab Inc. - Overview
Genesys Telecom Lab Inc. - Product / Service
Genesys Telecom Lab Inc. - Key offerings
SWOT

15.15 Google LLC

Google LLC - Overview
Google LLC - Product / Service
Google LLC - Key offerings
SWOT

15.16 Mitel Networks Corp.

Mitel Networks Corp. - Overview
Mitel Networks Corp. - Product / Service
Mitel Networks Corp. - Key offerings
SWOT

15.17 NEC Corp.

NEC Corp. - Overview
NEC Corp. - Business segments
NEC Corp. - Key news
NEC Corp. - Key offerings
NEC Corp. - Segment focus
SWOT

15.18 NICE Ltd.

NICE Ltd. - Overview
NICE Ltd. - Business segments
NICE Ltd. - Key news
NICE Ltd. - Key offerings
NICE Ltd. - Segment focus
SWOT

16. Appendix

16.1 Scope of the report

Market definition
Objectives
Notes and caveats

16.2 Inclusions and exclusions checklist

Inclusions checklist
Exclusions checklist

16.3 Currency conversion rates for US$

16.4 Research methodology

16.5 Data procurement

Information sources

16.6 Data validation

16.7 Validation techniques employed for market sizing

16.8 Data synthesis

16.9 360 degree market analysis

16.10 List of abbreviations

Research Methodology

Technavio presents a detailed picture of the market by way of study, synthesis, and summation of data from multiple sources. The analysts have presented the various facets of the market with a particular focus on identifying the key industry influencers. The data thus presented is comprehensive, reliable, and the result of extensive research, both primary and secondary.

INFORMATION SOURCES

Primary sources

  • Manufacturers and suppliers
  • Channel partners
  • Industry experts
  • Strategic decision makers

Secondary sources

  • Industry journals and periodicals
  • Government data
  • Financial reports of key industry players
  • Historical data
  • Press releases

DATA ANALYSIS

Data Synthesis

  • Collation of data
  • Estimation of key figures
  • Analysis of derived insights

Data Validation

  • Triangulation with data models
  • Reference against proprietary databases
  • Corroboration with industry experts

REPORT WRITING

Qualitative

  • Market drivers
  • Market challenges
  • Market trends
  • Five forces analysis

Quantitative

  • Market size and forecast
  • Market segmentation
  • Geographical insights
  • Competitive landscape

Interested in this report?

Get your sample now to see our research methodology and insights!

Download Now

Frequently Asked Questions

Contact Center market growth will increase by USD 259.3 billion during 2026-2030.

The Contact Center market is expected to grow at a CAGR of 11.1% during 2026-2030.

Contact Center market is segmented by Type (Voice-based, Text-based, Social media-based) Deployment (On-premises, Cloud-based) Service (Professional services, Managed services, Cloud-based contact center as a services)

8x8 Inc., ALE International, Alvaria Inc., Amazon.com Inc., Ameyo Pvt Ltd., Atos SE, Avaya LLC, Cisco Systems Inc., Enghouse Systems Ltd., Five9 Inc., Genesys Telecom Lab Inc., Google LLC, Mitel Networks Corp., NEC Corp., NICE Ltd., SAP SE, Vocalcom Group, Vonage Holdings Corp., Zendesk Inc., ZTE Corp. are a few of the key vendors in the Contact Center market.

North America will register the highest growth rate of 34.2% among the other regions. Therefore, the Contact Center market in North America is expected to garner significant business opportunities for the vendors during the forecast period.

US, Canada, Mexico, China, India, Japan, Philippines, Australia, Indonesia, Germany, France, UK, Spain, The Netherlands, Italy, Brazil, Argentina, Colombia, South Africa, UAE, Saudi Arabia, Egypt, Nigeria

  • Focus on reducing operating costs of businesses is the driving factor this market.

The Contact Center market vendors should focus on grabbing business opportunities from the Type segment as it accounted for the largest market share in the base year.