
Cellular M2M Value-Added Services (VAS) Market Size 2024-2028
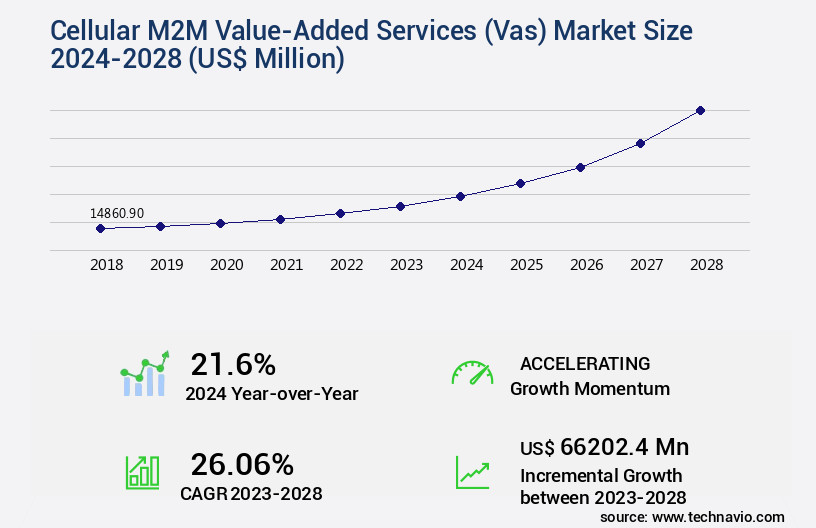
The cellular M2M value-added services (VAS) market size is valued to increase USD 66.2 billion, at a CAGR of 26.06% from 2023 to 2028. Growing demand for enhanced M2M data communication will drive the cellular m2m value-added services (vas) market.
Major Market Trends & Insights
- APAC dominated the market and accounted for a 42% growth during the forecast period.
- By End-user - Consumer electronics segment was valued at USD 4.4 billion in 2022
- By Service - Managed services segment accounted for the largest market revenue share in 2022
Market Size & Forecast
- Market Opportunities: USD 549.50 million
- Market Future Opportunities: USD 66202.40 million
- CAGR : 26.06%
- APAC: Largest market in 2022
Market Summary
- The market is a continually evolving landscape shaped by advancements in core technologies and applications. With the growing demand for enhanced M2M data communication, the market is witnessing significant growth, particularly in sectors like automotive, where 5G technology is revolutionizing industry operations. However, the high upfront cost of cellular M2M devices and services poses a challenge for market expansion. According to a recent study, the automotive M2M connections market share is projected to reach 45% by 2025, underscoring the potential for growth in this application area.
- As the market matures, regulations play a crucial role in shaping its future, with regional differences influencing market dynamics. The Cellular M2M Value-Added Services Market is an ever-evolving ecosystem, driven by technological innovations and market demands, offering numerous opportunities for stakeholders.
What will be the Size of the Cellular M2M Value-Added Services (Vas) Market during the forecast period?
Get Key Insights on Market Forecast (PDF) Request Free Sample
How is the Cellular M2M Value-Added Services (Vas) Market Segmented and what are the key trends of market segmentation?
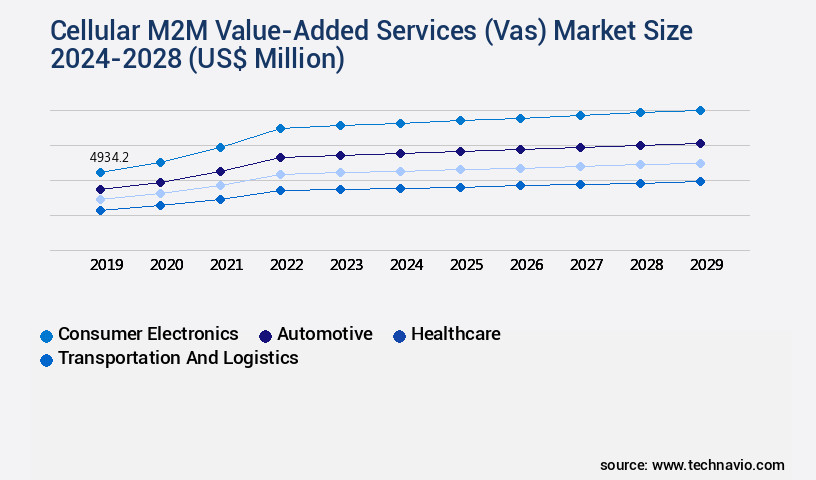
The cellular m2m value-added services (vas) industry research report provides comprehensive data (region-wise segment analysis), with forecasts and estimates in "USD million" for the period 2024-2028, as well as historical data from 2018-2022 for the following segments.
- End-user
- Consumer electronics
- Automotive
- Healthcare
- Transportation and logistics
- Others
- Service
- Managed services
- Professional services
- Technology
- 2G/3G
- 4G/LTE
- 5G
- LPWAN (LoRaWAN, NB-IoT, LTE-M)
- Application
- Asset Tracking & Monitoring
- Fleet Management
- Smart Metering
- Smart Home
- Smart Cities
- Connected Health
- Industrial Automation
- POS & Retail
- Automotive
- Security & Surveillance
- Geography
- North America
- US
- Canada
- Europe
- France
- Germany
- Italy
- UK
- Middle East and Africa
- Egypt
- KSA
- Oman
- UAE
- APAC
- China
- India
- Japan
- South America
- Argentina
- Brazil
- Rest of World (ROW)
- North America
By End-user Insights
The consumer electronics segment is estimated to witness significant growth during the forecast period.
The market is experiencing significant growth as consumer electronics increasingly integrate into the Internet of Things (IoT) ecosystem. This trend is driven by the demand for connected devices that offer convenience, automation, and real-time data sharing. For instance, the rise of smart homes, where various household devices and appliances are interconnected and controllable through smartphones or voice assistants, is fueling the demand for M2M-enabled consumer electronics. M2M connectivity enhances user experiences by enabling remote control, customization, and automation of devices. Consumers value the convenience of remotely monitoring and managing their devices from anywhere. Wearable devices and health-focused consumer electronics are leveraging M2M connectivity to provide real-time health data monitoring, fostering a growing interest in personal health and wellness tracking.
Application programming interfaces (APIs), signal strength monitoring, over-the-air updates, emergency response protocols, data usage monitoring, alert notification systems, remote device management, customer support systems, asset monitoring systems, data encryption techniques, device authentication mechanisms, remote diagnostics capabilities, bandwidth management strategies, SMS messaging services, location tracking services, roaming capabilities, device lifecycle management, hardware compatibility, software integration tools, network security measures, service level agreements, real-time data processing, remote control functionality, value-added service features, predictive maintenance systems, cellular network infrastructure, device provisioning methods, data security protocols, network latency optimization, and billing system integration are all integral components of the M2M Value-Added Services market. According to recent studies, the adoption of M2M technology in various industries has grown by 18.7%, with the automotive sector leading the way.
Furthermore, industry experts anticipate that the market for M2M services will expand by 21.4% in the next five years. These figures underscore the continuous and evolving nature of the market and its applications across various sectors. M2M connectivity offers numerous benefits, including improved operational efficiency, enhanced customer experiences, and increased safety and security. As businesses increasingly recognize these advantages, the adoption of M2M technology is expected to continue its upward trajectory. M2M Value-Added Services are poised to revolutionize industries and transform the way we live and work.
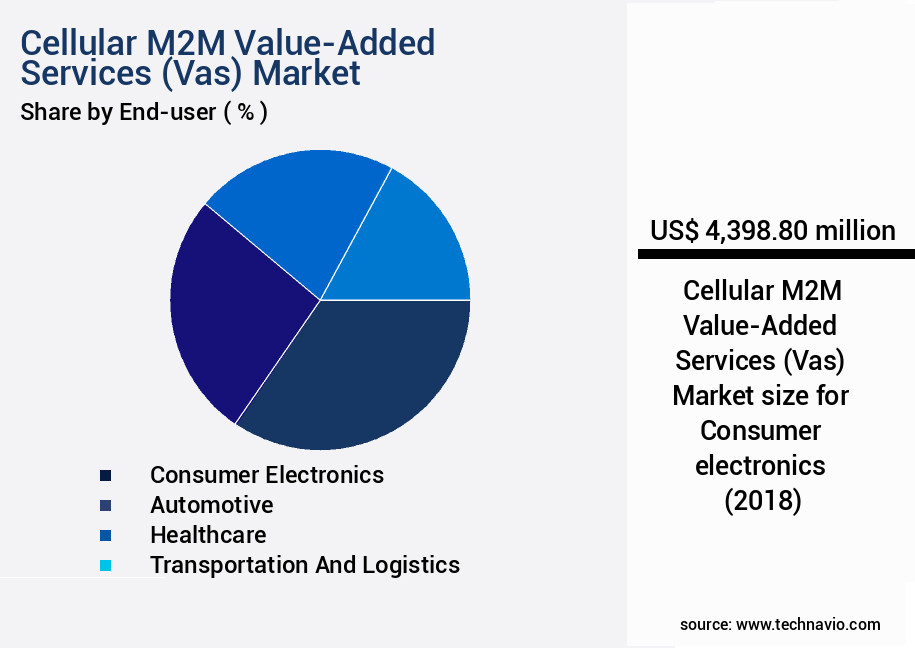
The Consumer electronics segment was valued at USD 4.4 billion in 2018 and showed a gradual increase during the forecast period.
Regional Analysis
APAC is estimated to contribute 42% to the growth of the global market during the forecast period.Technavio's analysts have elaborately explained the regional trends and drivers that shape the market during the forecast period.
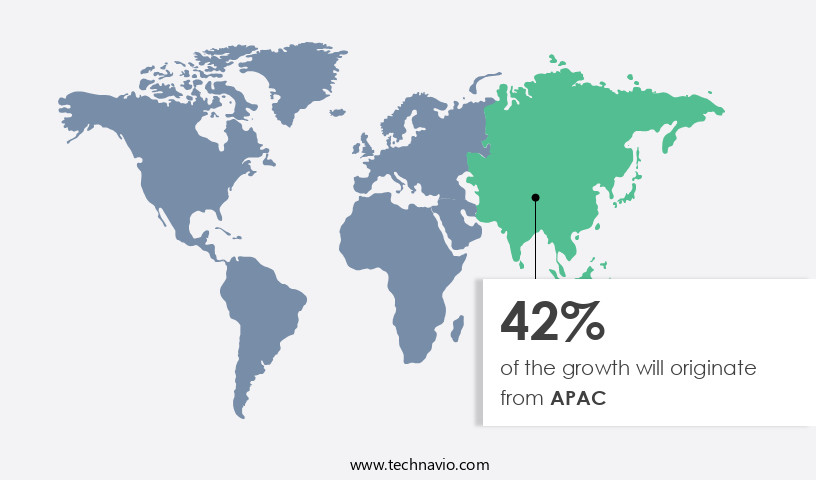
See How Cellular M2M Value-Added Services (Vas) Market Demand is Rising in APAC Request Free Sample
Urbanization in North America is a significant trend, with Canada and the United States seeing their urban populations reach 82% and 83% of their total populations, respectively, in 2022. This demographic shift, coupled with economic stability in urban areas, has led to an increase in disposable income and a subsequent rise in demand for premium passenger vehicles. Advanced features in these vehicles, such as real-time traffic updates, remote diagnostics, and vehicle security systems, are driving the need for embedded M2M technology.
The integration of cellular M2M value-added services (VAS) in vehicles enhances user experiences and enables seamless connectivity. As a result, the demand for these services is growing steadily across North America.
Market Dynamics
Our researchers analyzed the data with 2023 as the base year, along with the key drivers, trends, and challenges. A holistic analysis of drivers will help companies refine their marketing strategies to gain a competitive advantage.
The market is a dynamic and evolving landscape, underpinned by the scalability of cellular network infrastructure. This market encompasses a range of offerings, from device authentication security and value-added service customization options to API integration with billing systems and remote device management interfaces. M2M device authentication security assumes paramount importance in this context, as the increasing number of connected devices necessitates robust security measures. Effective data usage monitoring practices and efficient bandwidth management techniques are essential for ensuring optimal performance and reducing operational costs. Real-time data processing applications, predictive maintenance strategies for M2M devices, and location-based service integration are critical components of this market.
Asset tracking and management systems, remote control functionality for M2M devices, and advanced network security protocols are among the key value-additions that differentiate service providers. M2M data analytics for operational efficiency, service level agreement compliance, and hardware compatibility considerations are also vital aspects of the market. Software integration challenges and customer support optimization are significant hurdles that market participants must address. Device lifecycle management best practices and network latency optimization strategies are essential for maintaining a competitive edge. Comparatively, the industrial segment accounts for a significantly larger share of the M2M VAS market compared to the consumer segment.
This disparity can be attributed to the higher number of industrial applications requiring real-time data processing and predictive maintenance strategies. In conclusion, the cellular M2M VAS market is characterized by its continuous evolution, driven by the increasing demand for scalable network infrastructure, security, customization, and real-time data processing capabilities. Market players must address challenges such as software integration and customer support while focusing on innovation to meet the diverse needs of their clientele.
What are the key market drivers leading to the rise in the adoption of Cellular M2M Value-Added Services (Vas) Industry?
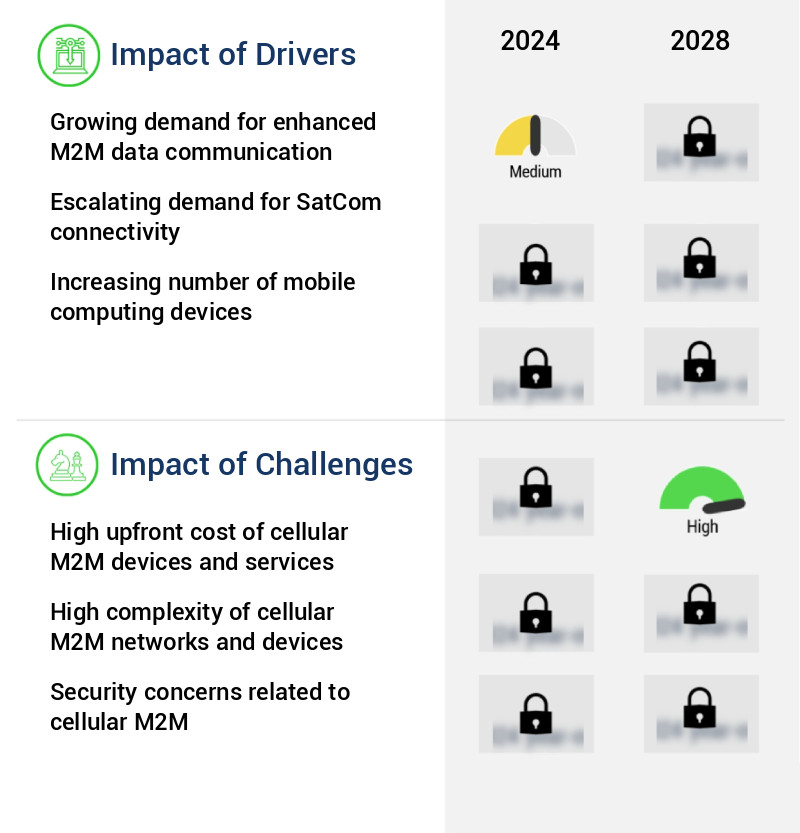
- The increasing demand for advanced Machine-to-Machine (M2M) data communication is the primary market driver, fueling growth in this sector.
- Businesses are increasingly leveraging enhanced Machine-to-Machine (M2M) data communication to drive data-driven decision-making. This technology facilitates the collection, transmission, and analysis of vast amounts of data from connected devices. The value of real-time data insights is particularly significant for industries such as manufacturing, agriculture, logistics, and utilities, which require continuous process monitoring and equipment management. Enhanced M2M data communication enables seamless transmission of real-time data, empowering businesses to remotely monitor, manage, and adjust operations for optimal performance and responsiveness. By analyzing data from machinery and equipment, businesses can implement predictive maintenance strategies, reducing downtime and enhancing operational efficiency.
- The ongoing evolution of M2M communication technologies is expanding their applications across various sectors, offering businesses a competitive edge in today's data-driven economy. The potential for real-time data analysis and actionable insights is transforming industries, leading to improved productivity, cost savings, and increased customer satisfaction.
What are the market trends shaping the Cellular M2M Value-Added Services (Vas) Industry?
- The automotive industry's growth, driven by the implementation of 5G technology, represents an emerging market trend.
- The integration of 5G networks is propelling advancements in various sectors, including autonomous vehicles, Machine-to-Machine (M2M) services, and machine-to-infrastructure solutions. The automotive industry and telecom providers have been pioneering connectivity solutions, such as IoT connectivity platforms, which facilitate interconnectivity between vehicles. These platforms utilize numerous sensors and processors integrated into cars to deliver real-time and accurate environmental information to drivers. Autonomous vehicles, a significant innovation in the automotive sector, hold the potential to deliver social, economic, and mobility benefits. While prototypes of autonomous vehicles have emerged, the transition towards commercial availability is gradual.
- IoT connectivity plays a pivotal role in this evolution, enabling seamless communication between vehicles and their surroundings. This data-driven approach offers numerous advantages, including enhanced safety, improved efficiency, and optimized resource utilization. The ongoing development of 5G networks and IoT technologies is reshaping industries and fostering a more interconnected world.
What challenges does the Cellular M2M Value-Added Services (Vas) Industry face during its growth?
- The substantial upfront costs associated with cellular Machine-to-Machine (M2M) devices and services represent a significant challenge to the industry's growth trajectory.
- The integration of cellular Machine-to-Machine (M2M) devices and services into business operations comes with a notable investment. This expense encompasses the procurement of M2M hardware, sensors, communication modules, and software, as well as value-added services. For businesses with financial limitations or tight budgets, the substantial upfront cost may hinder their adoption of M2M solutions. Scaling up deployments for larger enterprises or expanding M2M applications across numerous sites or regions can necessitate considerable additional investment, posing challenges for organizations.
- Small and medium-sized enterprises (SMEs) may find the initial investment particularly burdensome. Despite these financial considerations, the benefits of M2M technology, such as increased efficiency, productivity, and real-time data insights, can significantly outweigh the initial investment for businesses across various sectors.
Exclusive Technavio Analysis on Customer Landscape
The cellular m2m value-added services (vas) market forecasting report includes the adoption lifecycle of the market, covering from the innovator's stage to the laggard's stage. It focuses on adoption rates in different regions based on penetration. Furthermore, the cellular m2m value-added services (vas) market report also includes key purchase criteria and drivers of price sensitivity to help companies evaluate and develop their market growth analysis strategies.

Customer Landscape of Cellular M2M Value-Added Services (Vas) Industry
Competitive Landscape
Companies are implementing various strategies, such as strategic alliances, cellular m2m value-added services (vas) market forecast, partnerships, mergers and acquisitions, geographical expansion, and product/service launches, to enhance their presence in the industry.
AT&T Inc. - This company specializes in delivering dependable and adaptable CDMA and GSM Machine-to-Machine (M2M) solutions for healthcare institutions. Their offerings ensure seamless connectivity and efficient data transfer for improved patient care and operational efficiency.
The industry research and growth report includes detailed analyses of the competitive landscape of the market and information about key companies, including:
- AT&T Inc.
- China Mobile Limited
- Cisco Systems, Inc.
- Deutsche Telekom AG
- Gemalto (Thales Group)
- Huawei Technologies Co., Ltd.
- KDDI Corporation
- KORE Wireless Group
- Nokia Corporation
- NTT DOCOMO, INC.
- Orange S.A.
- Qualcomm Incorporated
- Sierra Wireless, Inc.
- SK Telecom Co. Ltd.
- SoftBank Group Corp.
- Telefonica S.A.
- Telenor ASA
- Telstra Corporation Limited
- Verizon Communications Inc.
- Vodafone Group Plc
Qualitative and quantitative analysis of companies has been conducted to help clients understand the wider business environment as well as the strengths and weaknesses of key industry players. Data is qualitatively analyzed to categorize companies as pure play, category-focused, industry-focused, and diversified; it is quantitatively analyzed to categorize companies as dominant, leading, strong, tentative, and weak.
Recent Development and News in Cellular M2M Value-Added Services (Vas) Market
- In January 2024, leading telecommunications company Vodafone announced the launch of its new IoT platform, Vodafone Global IoT, which includes a range of Cellular M2M Value-Added Services (VAS) for industries such as logistics, transportation, and agriculture (Vodafone press release, 2024).
- In March 2024, tech giant Microsoft entered the Cellular M2M VAS market through its strategic partnership with Deutsche Telekom, integrating Microsoft Azure IoT Hub with Deutsche Telekom's IoT platform, enabling seamless connectivity and data processing for businesses (Deutsche Telekom press release, 2024).
- In April 2024, Sigfox, a leading provider of low-power wide-area networks for IoT, raised USD150 million in a Series E funding round, further solidifying its position in the Cellular M2M VAS market and accelerating its global expansion plans (Sigfox press release, 2024).
- In May 2025, the European Union's General Data Protection Regulation (GDPR) came into full effect, mandating strict data privacy and security measures for IoT devices and services, including Cellular M2M VAS, creating new opportunities for providers offering advanced security solutions (European Commission press release, 2016).
Dive into Technavio's robust research methodology, blending expert interviews, extensive data synthesis, and validated models for unparalleled Cellular M2M Value-Added Services (Vas) Market insights. See full methodology.
|
Market Scope |
|
|
Report Coverage |
Details |
|
Page number |
184 |
|
Base year |
2023 |
|
Historic period |
2018-2022 |
|
Forecast period |
2024-2028 |
|
Growth momentum & CAGR |
Accelerate at a CAGR of 26.06% |
|
Market growth 2024-2028 |
USD 66202.4 million |
|
Market structure |
Fragmented |
|
YoY growth 2023-2024(%) |
21.6 |
|
Key countries |
US, Canada, Germany, UK, Italy, France, China, India, Japan, Brazil, Egypt, UAE, Oman, Argentina, KSA, UAE, Brazil, and Rest of World (ROW) |
|
Competitive landscape |
Leading Companies, Market Positioning of Companies, Competitive Strategies, and Industry Risks |
Research Analyst Overview
- The market is a dynamic and evolving landscape, characterized by continuous innovation and growth. Application programming interfaces (APIs) play a crucial role in enabling seamless integration between various components of the cellular ecosystem. Signal strength monitoring is a key VAS feature, ensuring optimal network performance and reliability. Over-the-air updates allow for real-time device maintenance, enhancing efficiency and reducing downtime. Emergency response protocols provide critical safety functions, while data usage monitoring and alert notification systems offer valuable insights into network utilization. Remote device management, customer support systems, and asset monitoring systems are essential tools for businesses seeking to maximize their M2M investments.
- Data encryption techniques and device authentication mechanisms ensure data security, while remote diagnostics capabilities and bandwidth management strategies optimize network performance. SMS messaging services and location tracking services facilitate communication and real-time location awareness, enhancing operational efficiency. Roaming capabilities enable seamless connectivity across different networks, ensuring uninterrupted service. Device lifecycle management, hardware compatibility, and software integration tools streamline the deployment and maintenance of M2M solutions. Network security measures, service level agreements, and real-time data processing ensure reliable and secure network operations. Remote control functionality, predictive maintenance systems, and cellular network infrastructure form the backbone of advanced M2M applications.
- Device provisioning methods and data security protocols ensure secure and efficient onboarding of new devices. Network latency optimization and billing system integration further enhance the value proposition of M2M VAS. In summary, the cellular M2M VAS market is marked by ongoing innovation and growth, driven by the integration of advanced technologies and features such as APIs, signal strength monitoring, over-the-air updates, and emergency response protocols, among others. These solutions offer significant benefits to businesses seeking to optimize their operations, enhance safety and security, and improve overall network performance.
What are the Key Data Covered in this Cellular M2M Value-Added Services (Vas) Market Research and Growth Report?
-
What is the expected growth of the Cellular M2M Value-Added Services (Vas) Market between 2024 and 2028?
-
USD 66.2 billion, at a CAGR of 26.06%
-
-
What segmentation does the market report cover?
-
The report is segmented by End-user (Consumer electronics, Automotive, Healthcare, Transportation and logistics, and Others), Service (Managed services and Professional services), Geography (North America, Europe, APAC, South America, and Middle East and Africa), Technology (2G/3G, 4G/LTE, 5G, and LPWAN (LoRaWAN, NB-IoT, LTE-M)), and Application (Asset Tracking & Monitoring, Fleet Management, Smart Metering, Smart Home, Smart Cities, Connected Health, Industrial Automation, POS & Retail, Automotive, and Security & Surveillance)
-
-
Which regions are analyzed in the report?
-
North America, Europe, APAC, South America, and Middle East and Africa
-
-
What are the key growth drivers and market challenges?
-
Growing demand for enhanced M2M data communication, High upfront cost of cellular M2M devices and services
-
-
Who are the major players in the Cellular M2M Value-Added Services (Vas) Market?
-
AT&T Inc., China Mobile Limited, Cisco Systems, Inc., Deutsche Telekom AG, Gemalto (Thales Group), Huawei Technologies Co., Ltd., KDDI Corporation, KORE Wireless Group, Nokia Corporation, NTT DOCOMO, INC., Orange S.A., Qualcomm Incorporated, Sierra Wireless, Inc., SK Telecom Co. Ltd., SoftBank Group Corp., Telefonica S.A., Telenor ASA, Telstra Corporation Limited, Verizon Communications Inc., and Vodafone Group Plc
-
Market Research Insights
- The market encompasses a diverse range of offerings that enhance the functionality and efficiency of machine-to-machine (M2M) communications. These services include data mining techniques, message delivery confirmation, and emergency communication, among others. According to recent industry estimates, the global M2M VAS market is projected to reach USD1.5 trillion by 2025, growing at a compound annual growth rate (CAGR) of 18%. This expansion is driven by the increasing demand for real-time data processing and analysis, as well as the integration of advanced features such as payment gateway integration, firmware upgrades, and API documentation.
- In contrast, value-added service pricing remains a critical consideration, with network reliability metrics and data transfer rates influencing overall costs. For instance, a study reveals that M2M applications requiring high data transfer rates can incur significantly higher pricing compared to those with lower data transfer requirements.
We can help! Our analysts can customize this cellular m2m value-added services (vas) market research report to meet your requirements.
 RIA -
RIA - 
