Machine To Machine (M2M) Services Market Analysis APAC, North America, Europe, South America, Middle East and Africa - US, China, Japan, India, UK - Size and Forecast 2024-2028

Machine To Machine (M2M) Services Market Analysis APAC, North America, Europe, South America, Middle East and Africa - US, China, Japan, India, UK - Size and Forecast 2024-2028

Published: Jul 2024 183 Pages SKU: IRTNTR45477

Market Overview at a Glance

$116.81 B
Market Opportunity
37.12%
CAGR
29.55
YoY growth 2023-2024(%)

Machine To Machine (M2M) Services Market Size 2024-2028

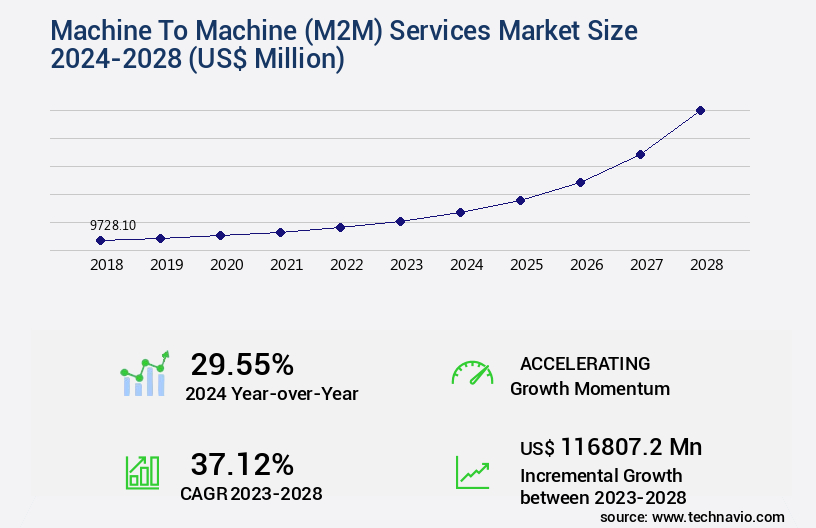
The machine to machine (m2m) services market size is valued to increase USD 116.81 billion, at a CAGR of 37.12% from 2023 to 2028. Rising demand for improved machine to machine data communication will drive the machine to machine (m2m) services market.

Major Market Trends & Insights

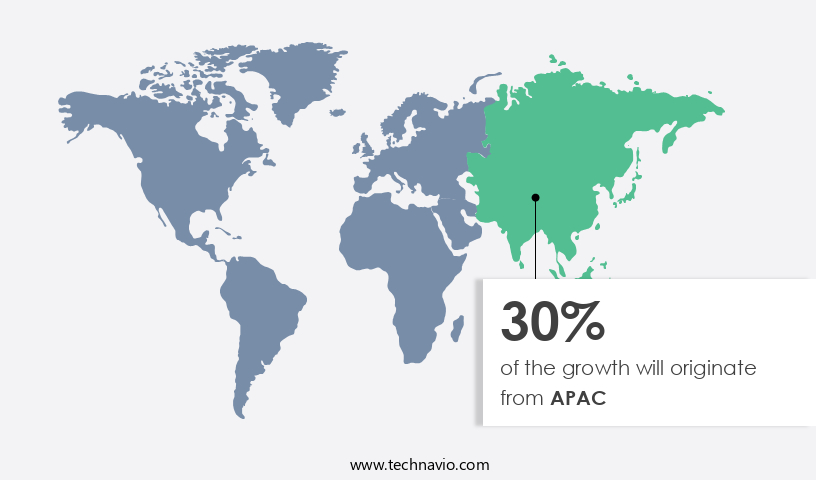
  • APAC dominated the market and accounted for a 30% growth during the forecast period.
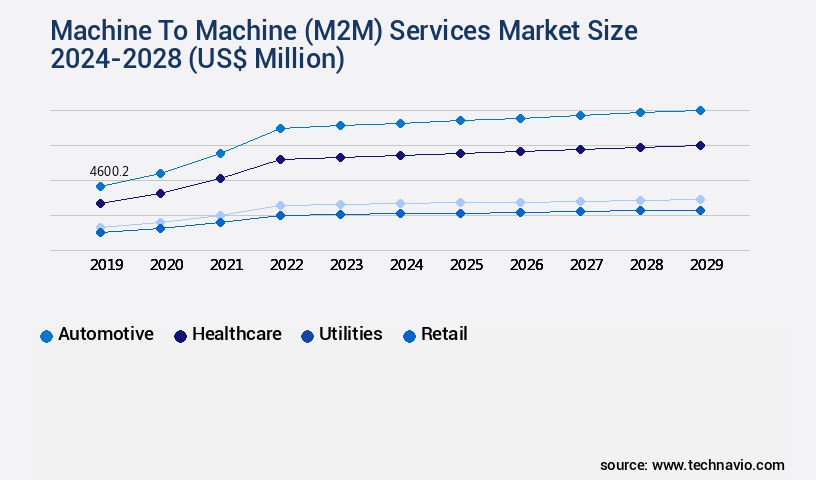
  • By Application - Automotive segment was valued at USD 3.67 billion in 2022
  • By Technology - Wireless segment accounted for the largest market revenue share in 2022

Market Size & Forecast

  • Market Opportunities: USD 1.00 million
  • Market Future Opportunities: USD 116807.20 million
  • CAGR from 2023 to 2028 : 37.12%

Market Summary

  • The market represents a dynamic and continually evolving landscape, driven by the increasing demand for seamless machine-to-machine data communication. This demand is particularly prominent in sectors such as automotive, where the integration of 5G technology is revolutionizing industries by enabling real-time data exchange and improved operational efficiency. However, the market is not without challenges. Standardization and policy-related issues persist, presenting obstacles to widespread adoption.
  • According to recent estimates, the M2M communication module market is projected to account for over 20% of the total connected vehicle market by 2025. As the market continues to unfold, key players are focusing on innovation and collaboration to address these challenges and capitalize on the opportunities presented by this burgeoning technology.

What will be the Size of the Machine To Machine (M2M) Services Market during the forecast period?

Machine To Machine (M2M) Services Market Size

Get Key Insights on Market Forecast (PDF) Request Free Sample

How is the Machine To Machine (M2M) Services Market Segmented ?

The machine to machine (m2m) services industry research report provides comprehensive data (region-wise segment analysis), with forecasts and estimates in "USD million" for the period 2024-2028, as well as historical data from 2018-2022 for the following segments.

  • Application
    • Automotive
    • Healthcare
    • Utilities
    • Retail
    • Others
  • Technology
    • Wireless
    • Wired
  • Geography
    • North America
      • US
    • Europe
      • UK
    • APAC
      • China
      • India
      • Japan
    • Rest of World (ROW)

    By Application Insights

    The automotive segment is estimated to witness significant growth during the forecast period.

    Machine to machine (M2M) services play a pivotal role in the remote monitoring and optimization of various industries, with significant adoption in the automotive sector. Currently, approximately 25% of cars are connected, and this number is projected to reach 75% by 2025. The increasing demand for infotainment services in connected vehicles fuels market growth. In the automotive industry, 4G LTE technologies' deployment is a major driver for M2M services adoption. These technologies enable real-time data transmission, ensuring efficient communication between vehicles and service providers. This results in enhanced safety and functionality, as remote diagnostics can alert drivers and solution centers about potential issues and solutions.

    M2M services offer several benefits, including power consumption optimization, support and maintenance, remote sensor monitoring, software scalability, and real-time data analytics. These services employ data encryption techniques, remote access control, device authentication, and predictive maintenance to ensure data security and system performance. Furthermore, M2M services integrate with various technologies such as cellular connectivity, bandwidth allocation, low-power wide-area networks, message queuing systems, and application programming interfaces. These technologies facilitate seamless communication and data exchange between devices, enhancing overall system efficiency. As the market evolves, there is a growing emphasis on network security breaches prevention, data aggregation methods, service level agreements, firmware updates, and system uptime monitoring.

    These aspects are crucial for maintaining high-quality services and ensuring customer satisfaction. In conclusion, the M2M services market is experiencing continuous growth, driven by the increasing adoption of connected devices and the need for real-time data exchange and analysis across various industries. The market's future growth is expected to reach new heights, with approximately 50% of businesses planning to implement M2M solutions by 2025.

    Machine To Machine (M2M) Services Market Size

    Request Free Sample

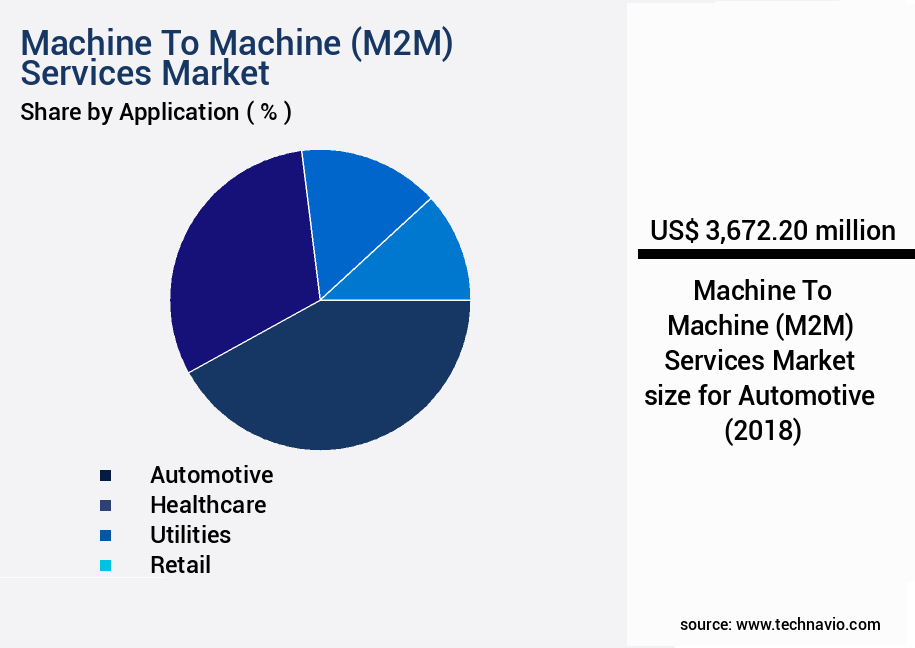
    The Automotive segment was valued at USD 3.67 billion in 2018 and showed a gradual increase during the forecast period.

    Machine To Machine (M2M) Services Market Size

    Request Free Sample

    Regional Analysis

    APAC is estimated to contribute 30% to the growth of the global market during the forecast period.Technavio’s analysts have elaborately explained the regional trends and drivers that shape the market during the forecast period.

    Machine To Machine (M2M) Services Market Share by Geography

    See How Machine To Machine (M2M) Services Market Demand is Rising in APAC Request Free Sample

    The surge in urbanization across Asia Pacific (APAC) has led to a significant increase in the demand for various types of vehicles, driving the growth of the market in the region. With the expanding urban population and rising disposable income, there is a heightened need for advanced technologies in both passenger and commercial vehicles to optimize fleet management and ensure security.

    This trend is further amplified by the increasing popularity of car-sharing services, which rely heavily on cellular M2M solutions to enhance their operational efficiency and communication requirements. As a result, the M2M services market in APAC is experiencing substantial growth, with numerous key players investing in innovative technologies and services to cater to the burgeoning demand.

    Market Dynamics

    Our researchers analyzed the data with 2023 as the base year, along with the key drivers, trends, and challenges. A holistic analysis of drivers will help companies refine their marketing strategies to gain a competitive advantage.

    The global m2m services market is witnessing significant growth, driven by the increasing adoption of IoT device management best practices and the need for optimizing m2m communication protocols. Remote sensor monitoring systems are increasingly being designed to leverage low-power wide-area networks for efficient data transmission, ensuring secure data transmission techniques and cloud-based data storage solutions. Real-time data analytics tools and predictive maintenance strategies are essential components of these systems, enabling remote diagnostics and troubleshooting, m2m platform integration methods, and API integration challenges and solutions. Data security and privacy measures are crucial considerations in the m2m services market, with system uptime and performance monitoring, power consumption management techniques, and bandwidth allocation strategies playing vital roles.

    Device authentication and authorization, data aggregation and processing pipeline, error handling and recovery mechanisms, and system architecture design considerations are essential elements of robust m2m services. Notably, more than 70% of new product developments in the industrial sector focus on implementing interoperability standards compliance, enabling seamless integration across various applications and platforms. This trend underscores the importance of system architecture design considerations and the need for error handling and recovery mechanisms. Despite these advancements, only a minority of players, less than 15%, dominate the high-end instrument market, highlighting the competitive landscape's fragmentation. In conclusion, the m2m services market is experiencing substantial growth, driven by the increasing adoption of IoT device management best practices and the need for optimizing m2m communication protocols.

    The market's dynamics are shaped by various factors, including data security and privacy, system uptime and performance monitoring, power consumption management, and interoperability standards compliance.

    Machine To Machine (M2M) Services Market Size

    What are the key market drivers leading to the rise in the adoption of Machine To Machine (M2M) Services Industry?

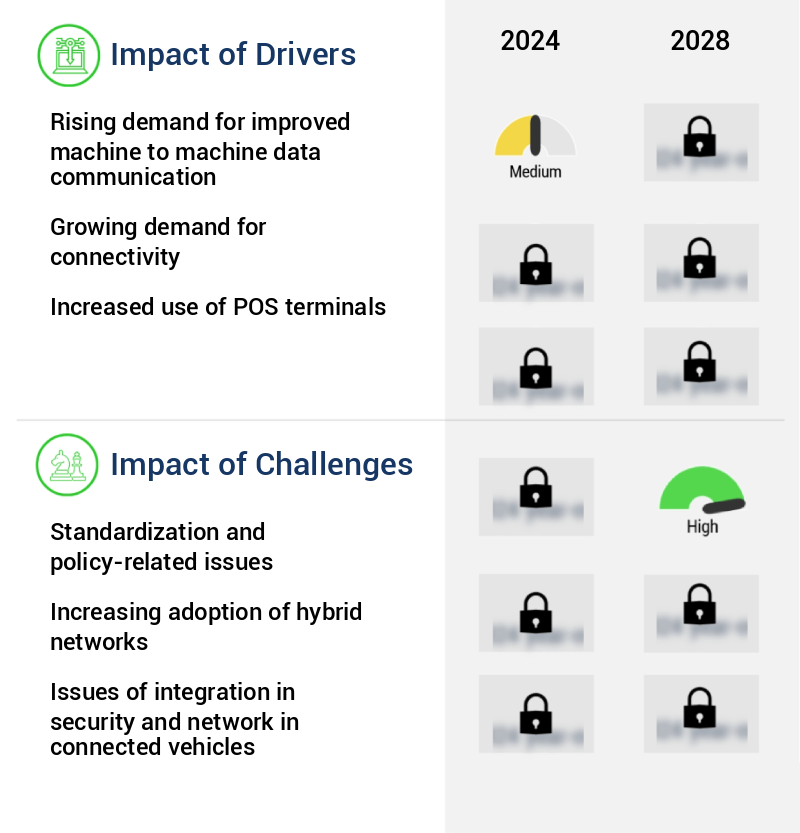
    • The escalating requirement for advanced machine-to-machine (M2M) data communication is the primary market driver, as industries increasingly seek to optimize operations and enhance productivity through seamless information exchange between devices. 

    • Machine-to-Machine (M2M) communications have experienced significant expansion and are anticipated to persist in their growth trajectory. Businesses increasingly prioritize the adoption of advanced M2M systems to enhance operational productivity and efficiency. Real-time monitoring of remote assets is a key application of M2M services, which will significantly impact industrial automation and remote facility management. The global M2M communications market is characterized by its far-reaching influence, with businesses across sectors recognizing its potential.
    • The integration of M2M systems facilitates real-time data exchange, enabling improved decision-making and operational agility. This trend is further fueling the demand for dependable and cost-effective data communications on a global scale.

    What are the market trends shaping the Machine To Machine (M2M) Services Industry?

    • The automotive industry's growth, driven by the implementation of 5G technology, represents an emerging market trend.

    • The 5G network is poised to fuel advancements in various sectors, including automotive and telecommunications. Autonomous vehicles, machine-to-machine (M2M) services, and machine-to-infrastructure (M2I) connectivity are among the anticipated developments. The automotive industry and telecom providers have been collaborating to create IoT connectivity platforms, enabling interconnectivity between vehicles. Integration of numerous sensors and processors in cars offers real-time, accurate information about the environment to drivers. Autonomous vehicles, a significant innovation, could yield social, economic, and mobility advantages. Although prototypes exist, the transition towards commercial availability is progressing steadily.
    • IoT connectivity plays a crucial role in this evolution, providing a foundation for advanced features and services. The potential of 5G technology in enhancing vehicle performance and safety is substantial, making it an essential component of the future automotive landscape.

    What challenges does the Machine To Machine (M2M) Services Industry face during its growth?

    • The standardization and formulation of policies pose significant challenges to the expansion and growth of the industry. 

    • Machine-to-machine (M2M) technology finds extensive applications in various industries, including automotive, manufacturing, energy, healthcare, and military. Due to the market's fragmented nature, operators must tailor their M2M platforms to cater to distinct use cases and applications. M2M devices and applications necessitate unique connectivity requirements, contrasting those of traditional mobile data devices. In emergency situations and during disasters, potential network overloads can occur due to millions of connected M2M devices. This risk arises from inadequate protocol implementations. Moreover, high signaling traffic is a common issue in M2M networks, given the numerous small devices that intermittently connect and disconnect. To mitigate these challenges, continuous innovation and optimization are crucial in the M2M market.
    • Companies invest in advanced technologies like low-power wide-area networks (LPWAN) and edge computing to enhance network efficiency and reliability. In this dynamic landscape, operators must stay updated on evolving trends and patterns to provide optimal solutions for their clients.

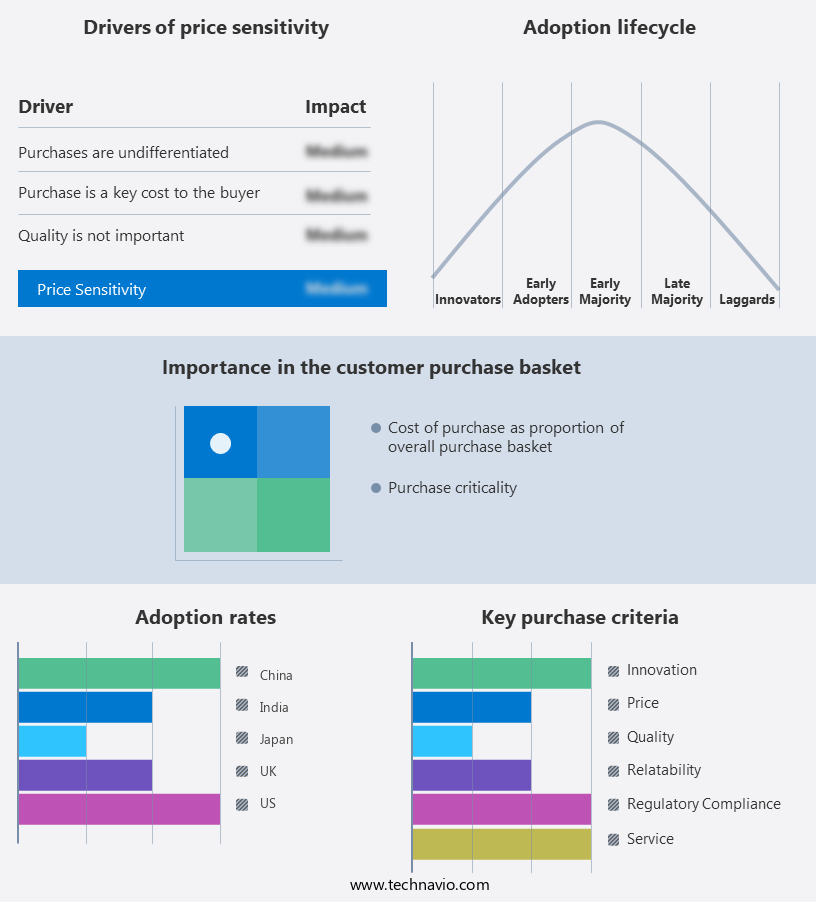
    Exclusive Technavio Analysis on Customer Landscape

    The machine to machine (m2m) services market forecasting report includes the adoption lifecycle of the market, covering from the innovator’s stage to the laggard’s stage. It focuses on adoption rates in different regions based on penetration. Furthermore, the machine to machine (m2m) services market report also includes key purchase criteria and drivers of price sensitivity to help companies evaluate and develop their market growth analysis strategies.

    Machine To Machine (M2M) Services Market Share by Geography

     Customer Landscape of Machine To Machine (M2M) Services Industry

    Competitive Landscape

    Companies are implementing various strategies, such as strategic alliances, machine to machine (m2m) services market forecast, partnerships, mergers and acquisitions, geographical expansion, and product/service launches, to enhance their presence in the industry.

    Aeris Communications Inc. - This company specializes in machine-to-machine services for Internet of Things (IoT) consoles, enabling seamless communication and data exchange between devices. Their offerings facilitate efficient automation, remote monitoring, and real-time analytics for various industries.

    The industry research and growth report includes detailed analyses of the competitive landscape of the market and information about key companies, including:

    • Aeris Communications Inc.
    • Alphabet Inc.
    • Amdocs Ltd.
    • AT and T Inc.
    • BT Group Plc
    • Cisco Systems Inc.
    • Comarch SA
    • Cstar Technologies Inc.
    • Deutsche Telekom AG
    • Huawei Technologies Co. Ltd.
    • Intel Corp.
    • Orange SA
    • Rogers Communications Inc.
    • Semtech Corp.
    • Telefonaktiebolaget LM Ericsson
    • Telefonica SA
    • Telit
    • Thales Group
    • Verizon Communications Inc.
    • Vodafone Group Plc

    Qualitative and quantitative analysis of companies has been conducted to help clients understand the wider business environment as well as the strengths and weaknesses of key industry players. Data is qualitatively analyzed to categorize companies as pure play, category-focused, industry-focused, and diversified; it is quantitatively analyzed to categorize companies as dominant, leading, strong, tentative, and weak.

    Recent Development and News in Machine To Machine (M2M) Services Market

    • In January 2024, leading telecommunications company Vodafone announced the launch of its new M2M SIM card, designed specifically for industrial IoT applications, in partnership with chipmaker Qualcomm (Reuters). This collaboration aimed to provide enhanced connectivity and security features for M2M devices.
    • In March 2024, Siemens and Microsoft entered into a strategic partnership to integrate Microsoft's Azure IoT platform with Siemens' MindSphere industrial IoT operating system (Microsoft Press Release). This collaboration aimed to offer advanced analytics and machine learning capabilities to industrial customers.
    • In May 2024, German automotive supplier Bosch completed the acquisition of US-based IoT startup, Sensicast Systems, for an undisclosed sum (Bosch Press Release). This acquisition was aimed at expanding Bosch's IoT portfolio, particularly in the smart city and industrial IoT sectors.
    • In April 2025, the European Union passed the new IoT Regulation, which sets security standards for M2M devices and networks, ensuring data protection and privacy (EU Commission Press Release). This regulation is expected to boost the adoption of secure M2M services in Europe.

    Dive into Technavio’s robust research methodology, blending expert interviews, extensive data synthesis, and validated models for unparalleled Machine To Machine (M2M) Services Market insights. See full methodology.

    Market Scope

    Report Coverage

    Details

    Page number

    183

    Base year

    2023

    Historic period

    2018-2022

    Forecast period

    2024-2028

    Growth momentum & CAGR

    Accelerate at a CAGR of 37.12%

    Market growth 2024-2028

    USD 116807.2 million

    Market structure

    Fragmented

    YoY growth 2023-2024(%)

    29.55

    Key countries

    US, China, Japan, India, and UK

    Competitive landscape

    Leading Companies, Market Positioning of Companies, Competitive Strategies, and Industry Risks

    Request Free Sample

    Research Analyst Overview

    • In the dynamic and evolving landscape of Machine-to-Machine (M2M) services, data visualization dashboards play a pivotal role in optimizing power consumption. These tools enable businesses to monitor and analyze real-time data from remote sensors, providing insights for efficient energy usage. Power consumption optimization is a critical concern in the M2M market, as the increasing adoption of IoT devices contributes to growing energy demands. Remote sensor monitoring and software scalability are essential components in addressing this challenge, allowing for proactive management of energy usage and identifying areas for improvement. Support and maintenance are also crucial aspects of the M2M services market.
    • Remote diagnostics and IoT device management facilitate issue resolution, ensuring system performance metrics remain optimal. Data encryption techniques and remote access control provide essential security measures, mitigating risks from network security breaches. Device authentication and data transmission rates are key performance indicators in the M2M market. Cellular connectivity and bandwidth allocation are vital considerations for ensuring reliable communication between devices. Real-time data analytics, API integration methods, and system uptime monitoring contribute to improved system performance and user experience. Hardware compatibility and network latency issues are ongoing challenges in the M2M services market. Firmware updates and data security protocols are essential for maintaining optimal system functionality and addressing vulnerabilities.
    • Predictive maintenance and device provisioning enable proactive problem-solving, reducing downtime and minimizing costs. Cloud-based data storage and low-power wide-area networks are emerging trends in the M2M services market. Message queuing systems and network topologies are essential infrastructure elements, ensuring efficient data processing and transmission. Error handling mechanisms and system performance metrics provide valuable insights for continuous improvement and optimization.

    What are the Key Data Covered in this Machine To Machine (M2M) Services Market Research and Growth Report?

    • What is the expected growth of the Machine To Machine (M2M) Services Market between 2024 and 2028?

      • USD 116.81 billion, at a CAGR of 37.12%

    • What segmentation does the market report cover?

      • The report is segmented by Application (Automotive, Healthcare, Utilities, Retail, and Others), Technology (Wireless and Wired), and Geography (APAC, North America, Europe, South America, and Middle East and Africa)

    • Which regions are analyzed in the report?

      • APAC, North America, Europe, South America, and Middle East and Africa

    • What are the key growth drivers and market challenges?

      • Rising demand for improved machine to machine data communication, Standardization and policy-related issues

    • Who are the major players in the Machine To Machine (M2M) Services Market?

      • Aeris Communications Inc., Alphabet Inc., Amdocs Ltd., AT and T Inc., BT Group Plc, Cisco Systems Inc., Comarch SA, Cstar Technologies Inc., Deutsche Telekom AG, Huawei Technologies Co. Ltd., Intel Corp., Orange SA, Rogers Communications Inc., Semtech Corp., Telefonaktiebolaget LM Ericsson, Telefonica SA, Telit, Thales Group, Verizon Communications Inc., and Vodafone Group Plc

    Market Research Insights

    • The Machine-to-Machine (M2M) services market is a dynamic and complex ecosystem, characterized by its focus on cost optimization, interoperability standards, and device lifecycle management. According to recent industry estimates, the global M2M market is projected to reach USD1.1 trillion by 2026, growing at a compound annual growth rate (CAGR) of 17.5% from 2021 to 2026. This growth is driven by the increasing adoption of M2M technologies in various industries, including transportation, healthcare, and energy. One key challenge in the M2M services market is system integration, which requires adherence to technical specifications and technical documentation. Another critical aspect is customer support, which ensures seamless interaction between machines and human users.
    • In this regard, predictive analytics and machine learning models play a crucial role in proactively addressing potential issues and optimizing performance. Additionally, secure data transmission, regulatory compliance, and quality assurance testing are essential components of M2M services, ensuring data privacy and security. Network infrastructure and data analytics platforms form the backbone of M2M services, facilitating data processing pipelines and sensor data acquisition. The market also prioritizes scalable architecture designs, deployment strategies, and remote control systems to cater to the evolving needs of businesses. Security certifications and performance monitoring are also essential to maintaining trust and reliability in M2M services.
    • Data mining techniques and data analytics platforms enable businesses to extract valuable insights from vast amounts of data, driving operational efficiency and competitive advantage.

    We can help! Our analysts can customize this machine to machine (m2m) services market research report to meet your requirements.

    Get in touch

    1 Executive Summary

    • 1.1 Market overview
      • Executive Summary - Chart on Market Overview
      • Executive Summary - Data Table on Market Overview
      • Executive Summary - Chart on Global Market Characteristics
      • Executive Summary - Chart on Market by Geography
      • Executive Summary - Chart on Market Segmentation by Application
      • Executive Summary - Chart on Market Segmentation by Technology
      • Executive Summary - Chart on Incremental Growth
      • Executive Summary - Data Table on Incremental Growth
      • Executive Summary - Chart on Company Market Positioning

    2 Market Landscape

    • 2.1 Market ecosystem
      • Parent Market
      • Data Table on - Parent Market
    • 2.2 Market characteristics
      • Market characteristics analysis
    • 2.3 Value chain analysis
      • Value Chain Analysis

    3 Market Sizing

    • 3.1 Market definition
      • Offerings of companies included in the market definition
    • 3.2 Market segment analysis
      • Market segments
    • 3.3 Market size 2023
      • 3.4 Market outlook: Forecast for 2023-2028
        • Chart on Global - Market size and forecast 2023-2028 ($ million)
        • Data Table on Global - Market size and forecast 2023-2028 ($ million)
        • Chart on Global Market: Year-over-year growth 2023-2028 (%)
        • Data Table on Global Market: Year-over-year growth 2023-2028 (%)

      4 Historic Market Size

      • 4.1 Global Machine To Machine (M2M) Services Market 2018 - 2022
        • Historic Market Size - Data Table on Global Machine To Machine (M2M) Services Market 2018 - 2022 ($ million)
      • 4.2 Application segment analysis 2018 - 2022
        • Historic Market Size - Application Segment 2018 - 2022 ($ million)
      • 4.3 Technology segment analysis 2018 - 2022
        • Historic Market Size - Technology Segment 2018 - 2022 ($ million)
      • 4.4 Geography segment analysis 2018 - 2022
        • Historic Market Size - Geography Segment 2018 - 2022 ($ million)
      • 4.5 Country segment analysis 2018 - 2022
        • Historic Market Size - Country Segment 2018 - 2022 ($ million)

      5 Five Forces Analysis

      • 5.1 Five forces summary
        • Five forces analysis - Comparison between 2023 and 2028
      • 5.2 Bargaining power of buyers
        • Bargaining power of buyers - Impact of key factors 2023 and 2028
      • 5.3 Bargaining power of suppliers
        • Bargaining power of suppliers - Impact of key factors in 2023 and 2028
      • 5.4 Threat of new entrants
        • Threat of new entrants - Impact of key factors in 2023 and 2028
      • 5.5 Threat of substitutes
        • Threat of substitutes - Impact of key factors in 2023 and 2028
      • 5.6 Threat of rivalry
        • Threat of rivalry - Impact of key factors in 2023 and 2028
      • 5.7 Market condition
        • Chart on Market condition - Five forces 2023 and 2028

      6 Market Segmentation by Application

      • 6.1 Market segments
        • Chart on Application - Market share 2023-2028 (%)
        • Data Table on Application - Market share 2023-2028 (%)
      • 6.2 Comparison by Application
        • Chart on Comparison by Application
        • Data Table on Comparison by Application
      • 6.3 Automotive - Market size and forecast 2023-2028
        • Chart on Automotive - Market size and forecast 2023-2028 ($ million)
        • Data Table on Automotive - Market size and forecast 2023-2028 ($ million)
        • Chart on Automotive - Year-over-year growth 2023-2028 (%)
        • Data Table on Automotive - Year-over-year growth 2023-2028 (%)
      • 6.4 Healthcare - Market size and forecast 2023-2028
        • Chart on Healthcare - Market size and forecast 2023-2028 ($ million)
        • Data Table on Healthcare - Market size and forecast 2023-2028 ($ million)
        • Chart on Healthcare - Year-over-year growth 2023-2028 (%)
        • Data Table on Healthcare - Year-over-year growth 2023-2028 (%)
      • 6.5 Utilities - Market size and forecast 2023-2028
        • Chart on Utilities - Market size and forecast 2023-2028 ($ million)
        • Data Table on Utilities - Market size and forecast 2023-2028 ($ million)
        • Chart on Utilities - Year-over-year growth 2023-2028 (%)
        • Data Table on Utilities - Year-over-year growth 2023-2028 (%)
      • 6.6 Retail - Market size and forecast 2023-2028
        • Chart on Retail - Market size and forecast 2023-2028 ($ million)
        • Data Table on Retail - Market size and forecast 2023-2028 ($ million)
        • Chart on Retail - Year-over-year growth 2023-2028 (%)
        • Data Table on Retail - Year-over-year growth 2023-2028 (%)
      • 6.7 Others - Market size and forecast 2023-2028
        • Chart on Others - Market size and forecast 2023-2028 ($ million)
        • Data Table on Others - Market size and forecast 2023-2028 ($ million)
        • Chart on Others - Year-over-year growth 2023-2028 (%)
        • Data Table on Others - Year-over-year growth 2023-2028 (%)
      • 6.8 Market opportunity by Application
        • Market opportunity by Application ($ million)
        • Data Table on Market opportunity by Application ($ million)

      7 Market Segmentation by Technology

      • 7.1 Market segments
        • Chart on Technology - Market share 2023-2028 (%)
        • Data Table on Technology - Market share 2023-2028 (%)
      • 7.2 Comparison by Technology
        • Chart on Comparison by Technology
        • Data Table on Comparison by Technology
      • 7.3 Wireless - Market size and forecast 2023-2028
        • Chart on Wireless - Market size and forecast 2023-2028 ($ million)
        • Data Table on Wireless - Market size and forecast 2023-2028 ($ million)
        • Chart on Wireless - Year-over-year growth 2023-2028 (%)
        • Data Table on Wireless - Year-over-year growth 2023-2028 (%)
      • 7.4 Wired - Market size and forecast 2023-2028
        • Chart on Wired - Market size and forecast 2023-2028 ($ million)
        • Data Table on Wired - Market size and forecast 2023-2028 ($ million)
        • Chart on Wired - Year-over-year growth 2023-2028 (%)
        • Data Table on Wired - Year-over-year growth 2023-2028 (%)
      • 7.5 Market opportunity by Technology
        • Market opportunity by Technology ($ million)
        • Data Table on Market opportunity by Technology ($ million)

      8 Customer Landscape

      • 8.1 Customer landscape overview
        • Analysis of price sensitivity, lifecycle, customer purchase basket, adoption rates, and purchase criteria

      9 Geographic Landscape

      • 9.1 Geographic segmentation
        • Chart on Market share by geography 2023-2028 (%)
        • Data Table on Market share by geography 2023-2028 (%)
      • 9.2 Geographic comparison
        • Chart on Geographic comparison
        • Data Table on Geographic comparison
      • 9.3 APAC - Market size and forecast 2023-2028
        • Chart on APAC - Market size and forecast 2023-2028 ($ million)
        • Data Table on APAC - Market size and forecast 2023-2028 ($ million)
        • Chart on APAC - Year-over-year growth 2023-2028 (%)
        • Data Table on APAC - Year-over-year growth 2023-2028 (%)
      • 9.4 North America - Market size and forecast 2023-2028
        • Chart on North America - Market size and forecast 2023-2028 ($ million)
        • Data Table on North America - Market size and forecast 2023-2028 ($ million)
        • Chart on North America - Year-over-year growth 2023-2028 (%)
        • Data Table on North America - Year-over-year growth 2023-2028 (%)
      • 9.5 Europe - Market size and forecast 2023-2028
        • Chart on Europe - Market size and forecast 2023-2028 ($ million)
        • Data Table on Europe - Market size and forecast 2023-2028 ($ million)
        • Chart on Europe - Year-over-year growth 2023-2028 (%)
        • Data Table on Europe - Year-over-year growth 2023-2028 (%)
      • 9.6 South America - Market size and forecast 2023-2028
        • Chart on South America - Market size and forecast 2023-2028 ($ million)
        • Data Table on South America - Market size and forecast 2023-2028 ($ million)
        • Chart on South America - Year-over-year growth 2023-2028 (%)
        • Data Table on South America - Year-over-year growth 2023-2028 (%)
      • 9.7 Middle East and Africa - Market size and forecast 2023-2028
        • Chart on Middle East and Africa - Market size and forecast 2023-2028 ($ million)
        • Data Table on Middle East and Africa - Market size and forecast 2023-2028 ($ million)
        • Chart on Middle East and Africa - Year-over-year growth 2023-2028 (%)
        • Data Table on Middle East and Africa - Year-over-year growth 2023-2028 (%)
      • 9.8 US - Market size and forecast 2023-2028
        • Chart on US - Market size and forecast 2023-2028 ($ million)
        • Data Table on US - Market size and forecast 2023-2028 ($ million)
        • Chart on US - Year-over-year growth 2023-2028 (%)
        • Data Table on US - Year-over-year growth 2023-2028 (%)
      • 9.9 China - Market size and forecast 2023-2028
        • Chart on China - Market size and forecast 2023-2028 ($ million)
        • Data Table on China - Market size and forecast 2023-2028 ($ million)
        • Chart on China - Year-over-year growth 2023-2028 (%)
        • Data Table on China - Year-over-year growth 2023-2028 (%)
      • 9.10 Japan - Market size and forecast 2023-2028
        • Chart on Japan - Market size and forecast 2023-2028 ($ million)
        • Data Table on Japan - Market size and forecast 2023-2028 ($ million)
        • Chart on Japan - Year-over-year growth 2023-2028 (%)
        • Data Table on Japan - Year-over-year growth 2023-2028 (%)
      • 9.11 India - Market size and forecast 2023-2028
        • Chart on India - Market size and forecast 2023-2028 ($ million)
        • Data Table on India - Market size and forecast 2023-2028 ($ million)
        • Chart on India - Year-over-year growth 2023-2028 (%)
        • Data Table on India - Year-over-year growth 2023-2028 (%)
      • 9.12 UK - Market size and forecast 2023-2028
        • Chart on UK - Market size and forecast 2023-2028 ($ million)
        • Data Table on UK - Market size and forecast 2023-2028 ($ million)
        • Chart on UK - Year-over-year growth 2023-2028 (%)
        • Data Table on UK - Year-over-year growth 2023-2028 (%)
      • 9.13 Market opportunity by geography
        • Market opportunity by geography ($ million)
        • Data Tables on Market opportunity by geography ($ million)

      10 Drivers, Challenges, and Opportunity/Restraints

      • 10.1 Market drivers
        • 10.2 Market challenges
          • 10.3 Impact of drivers and challenges
            • Impact of drivers and challenges in 2023 and 2028
          • 10.4 Market opportunities/restraints

            11 Competitive Landscape

            • 11.1 Overview
              • 11.2 Competitive Landscape
                • Overview on criticality of inputs and factors of differentiation
              • 11.3 Landscape disruption
                • Overview on factors of disruption
              • 11.4 Industry risks
                • Impact of key risks on business

              12 Competitive Analysis

              • 12.1 Companies profiled
                • Companies covered
              • 12.2 Market positioning of companies
                • Matrix on companies position and classification
              • 12.3 AT and T Inc.
                • AT and T Inc. - Overview
                • AT and T Inc. - Business segments
                • AT and T Inc. - Key news
                • AT and T Inc. - Key offerings
                • AT and T Inc. - Segment focus
              • 12.4 Cisco Systems Inc.
                • Cisco Systems Inc. - Overview
                • Cisco Systems Inc. - Business segments
                • Cisco Systems Inc. - Key news
                • Cisco Systems Inc. - Key offerings
                • Cisco Systems Inc. - Segment focus
              • 12.5 Comarch SA
                • Comarch SA - Overview
                • Comarch SA - Product / Service
                • Comarch SA - Key news
                • Comarch SA - Key offerings
              • 12.6 Cstar Technologies Inc.
                • Cstar Technologies Inc. - Overview
                • Cstar Technologies Inc. - Product / Service
                • Cstar Technologies Inc. - Key offerings
              • 12.7 Deutsche Telekom AG
                • Deutsche Telekom AG - Overview
                • Deutsche Telekom AG - Business segments
                • Deutsche Telekom AG - Key offerings
                • Deutsche Telekom AG - Segment focus
              • 12.8 Huawei Technologies Co. Ltd.
                • Huawei Technologies Co. Ltd. - Overview
                • Huawei Technologies Co. Ltd. - Product / Service
                • Huawei Technologies Co. Ltd. - Key news
                • Huawei Technologies Co. Ltd. - Key offerings
              • 12.9 Intel Corp.
                • Intel Corp. - Overview
                • Intel Corp. - Business segments
                • Intel Corp. - Key news
                • Intel Corp. - Key offerings
                • Intel Corp. - Segment focus
              • 12.10 Orange SA
                • Orange SA - Overview
                • Orange SA - Product / Service
                • Orange SA - Key offerings
              • 12.11 Rogers Communications Inc.
                • Rogers Communications Inc. - Overview
                • Rogers Communications Inc. - Business segments
                • Rogers Communications Inc. - Key offerings
                • Rogers Communications Inc. - Segment focus
              • 12.12 Semtech Corp.
                • Semtech Corp. - Overview
                • Semtech Corp. - Business segments
                • Semtech Corp. - Key news
                • Semtech Corp. - Key offerings
                • Semtech Corp. - Segment focus
              • 12.13 Telefonica SA
                • Telefonica SA - Overview
                • Telefonica SA - Business segments
                • Telefonica SA - Key news
                • Telefonica SA - Key offerings
                • Telefonica SA - Segment focus
              • 12.14 Telit
                • Telit - Overview
                • Telit - Product / Service
                • Telit - Key offerings
              • 12.15 Thales Group
                • Thales Group - Overview
                • Thales Group - Business segments
                • Thales Group - Key news
                • Thales Group - Key offerings
                • Thales Group - Segment focus
              • 12.16 Verizon Communications Inc.
                • Verizon Communications Inc. - Overview
                • Verizon Communications Inc. - Business segments
                • Verizon Communications Inc. - Key news
                • Verizon Communications Inc. - Key offerings
                • Verizon Communications Inc. - Segment focus
              • 12.17 Vodafone Group Plc
                • Vodafone Group Plc - Overview
                • Vodafone Group Plc - Business segments
                • Vodafone Group Plc - Key news
                • Vodafone Group Plc - Key offerings
                • Vodafone Group Plc - Segment focus

              13 Appendix

              • 13.1 Scope of the report
                • 13.2 Inclusions and exclusions checklist
                  • Inclusions checklist
                  • Exclusions checklist
                • 13.3 Currency conversion rates for US$
                  • Currency conversion rates for US$
                • 13.4 Research methodology
                  • Research methodology
                • 13.5 Data procurement
                  • Information sources
                • 13.6 Data validation
                  • Data validation
                • 13.7 Validation techniques employed for market sizing
                  • Validation techniques employed for market sizing
                • 13.8 Data synthesis
                  • Data synthesis
                • 360 degree market analysis
                  • 360 degree market analysis
                • 13.10 List of abbreviations
                  • List of abbreviations

                Research Methodology

                Technavio presents a detailed picture of the market by way of study, synthesis, and summation of data from multiple sources. The analysts have presented the various facets of the market with a particular focus on identifying the key industry influencers. The data thus presented is comprehensive, reliable, and the result of extensive research, both primary and secondary.

                INFORMATION SOURCES

                Primary sources

                • Manufacturers and suppliers
                • Channel partners
                • Industry experts
                • Strategic decision makers

                Secondary sources

                • Industry journals and periodicals
                • Government data
                • Financial reports of key industry players
                • Historical data
                • Press releases

                DATA ANALYSIS

                Data Synthesis

                • Collation of data
                • Estimation of key figures
                • Analysis of derived insights

                Data Validation

                • Triangulation with data models
                • Reference against proprietary databases
                • Corroboration with industry experts

                REPORT WRITING

                Qualitative

                • Market drivers
                • Market challenges
                • Market trends
                • Five forces analysis

                Quantitative

                • Market size and forecast
                • Market segmentation
                • Geographical insights
                • Competitive landscape

                Interested in this report?

                Get your sample now to see our research methodology and insights!

                Download Now

                Frequently Asked Questions

                Machine To Machine (M2M) Services market growth will increase by $ 116807.2 mn during 2024-2028 .

                The Machine To Machine (M2M) Services market is expected to grow at a CAGR of 37.12% during 2024-2028 .

                Machine To Machine (M2M) Services market is segmented by Application( Automotive, Healthcare, Utilities, Retail, Others) Technology( Wireless, Wired, Automotive, Energy and utility, Other end-users)

                Aeris Communications Inc., Alphabet Inc., Amdocs Ltd., AT and T Inc., BT Group Plc, Cisco Systems Inc., Comarch SA, Cstar Technologies Inc., Deutsche Telekom AG, Huawei Technologies Co. Ltd., Intel Corp., Orange SA, Rogers Communications Inc., Semtech Corp., Telefonaktiebolaget LM Ericsson, Telefonica SA, Telit, Thales Group, Verizon Communications Inc., Vodafone Group Plc are a few of the key vendors in the Machine To Machine (M2M) Services market.

                APAC will register the highest growth rate of 30% among the other regions. Therefore, the Machine To Machine (M2M) Services market in APAC is expected to garner significant business opportunities for the vendors during the forecast period.

                US, China, Japan, India, UK

                • Rising demand for improved machine to machine data communicationConsiderable growth has been witnessed and is expected to continue in the long term for machine to machine communications as it has been considered the next wave of technology development. Almost all businesses are focusing primarily on the latest machine to machine systems that improve operational effectiveness and efficiency. Also is the driving factor this market.
                • incorporating machine to machine systems into business operations would help to achieve real-time monitoring of remote assets. Machine to machine services will play a vital role in supporting remote facility monitoring is the driving factor this market.
                • real-time asset management is the driving factor this market.
                • and industrial automation. This will drive mobile bandwidth demands.Affordable and reliable data communications are available from anywhere to anywhere in the world. Some of the companies focus on building enhanced machine to machine data communication solutions to monitor is the driving factor this market.
                • control is the driving factor this market.
                • and protect assets and communicate in remote locations. They offer data communication tools that work when failure is not an option. Real-time position tracking is the driving factor this market.
                • managing is the driving factor this market.
                • and operating remote assets are required in critical areas of the supply chain. High-performance machine to machine terminals are used for a range of applications such as emergency responders is the driving factor this market.
                • mobile fleet management is the driving factor this market.
                • oil and gas pipeline monitoring is the driving factor this market.
                • and high-value asset tracking.Some of the instances are as follows:IsatData Pro (IDP) is the driving factor this market.
                • a two-way data communication service that connects people and assets in remote areas worldwide. The next-generation Inmarsat network offers comprehensive global coverage and is sent through Geostationary Earth Orbit (GEO) satellites. The messages are delivered within seconds and are ideal for mission-critical applications that require the exchange of huge amounts of data very fast through emails is the driving factor this market.
                • text messages is the driving factor this market.
                • logs is the driving factor this market.
                • electronic forms is the driving factor this market.
                • and more.Nupoint Systems develops satellite data communications tools. One can protect and monitor remote assets or communicate while traveling in remote areas out of cellular coverage. Its satellite data communication products are Remote Viewer (a satellite camera) is the driving factor this market.
                • Remote Connect (a satellite data transceiver) is the driving factor this market.
                • and Companion (a satellite email hotspot). These are lightweight is the driving factor this market.
                • rugged is the driving factor this market.
                • and reliable.Thuraya is enhancing its machine to machine product portfolio to meet the growing demands of customers for satellite services.The increasing requirement for enhanced data communication is the driving force that is prevailing in the market and due to which the market is gaining grip.Thus is the driving factor this market.
                • these factors are driving the growth of the global machine to machine services market during the forecast period. is the driving factor this market.

                The Machine To Machine (M2M) Services market vendors should focus on grabbing business opportunities from the Automotive segment as it accounted for the largest market share in the base year.