Central Nervous System (CNS) Stimulant Drugs Market Analysis, Size, and Forecast 2026-2030: North America (US, Canada, and Mexico), Europe (Germany, UK, and France), APAC (China, Japan, and India), South America (Brazil, Argentina, and Colombia), Middle East and Africa (Saudi Arabia, Turkey, and UAE), Asia, Rest of World (ROW)

Central Nervous System (CNS) Stimulant Drugs Market Analysis, Size, and Forecast 2026-2030:
North America (US, Canada, and Mexico), Europe (Germany, UK, and France), APAC (China, Japan, and India), South America (Brazil, Argentina, and Colombia), Middle East and Africa (Saudi Arabia, Turkey, and UAE), Asia, Rest of World (ROW)

Published: Mar 2026 289 Pages SKU: IRTNTR72695

Market Overview at a Glance

$9.54 B
Market Opportunity
7%
CAGR 2025 - 2030
41.5%
North America Growth
$13.93 B
Hospitals segment 2024

Central Nervous System (CNS) Stimulant Drugs Market Size 2026-2030

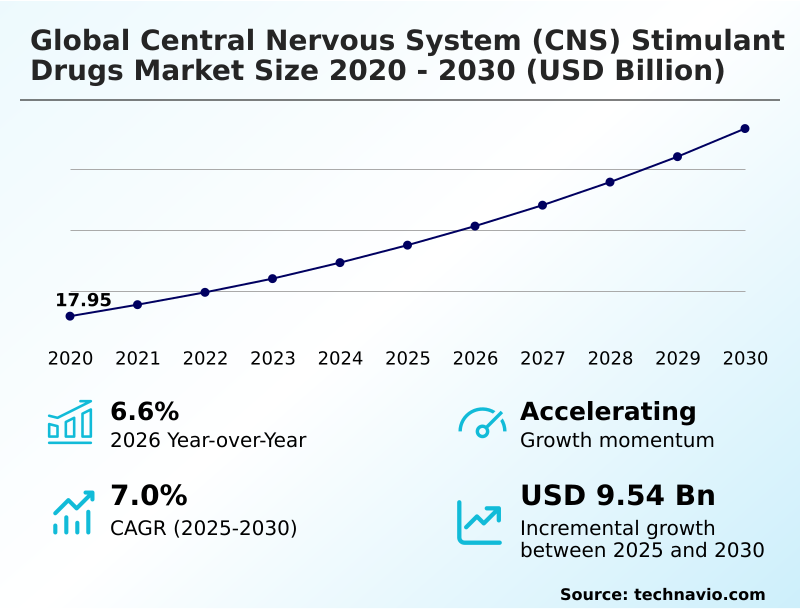
The central nervous system (cns) stimulant drugs market size is valued to increase by USD 9.54 billion, at a CAGR of 7% from 2025 to 2030. Integration of pediatric and adolescent diagnostic precision and evolution of early-intervention therapeutic protocols will drive the central nervous system (cns) stimulant drugs market.

Major Market Trends & Insights

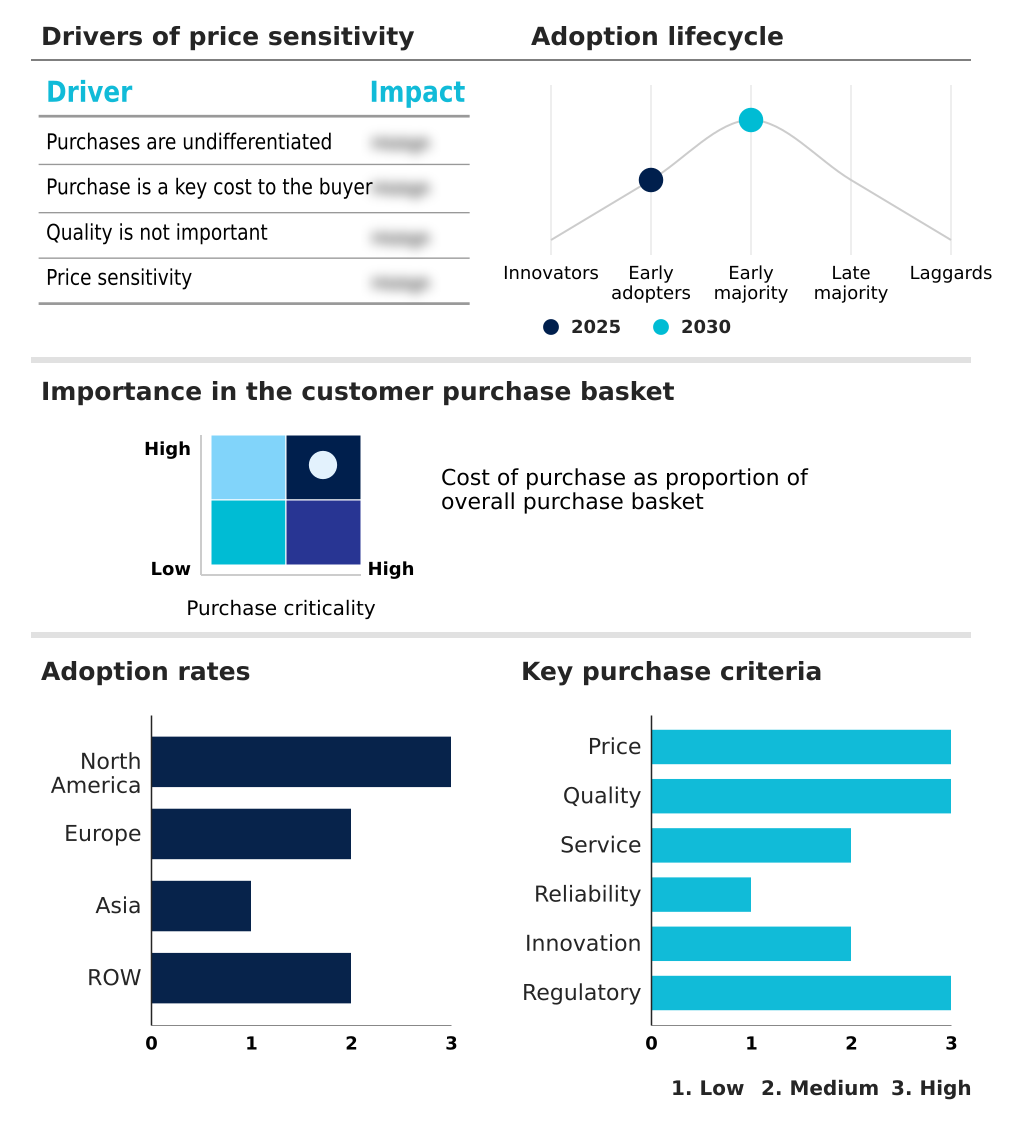
  • North America dominated the market and accounted for a 41.5% growth during the forecast period.
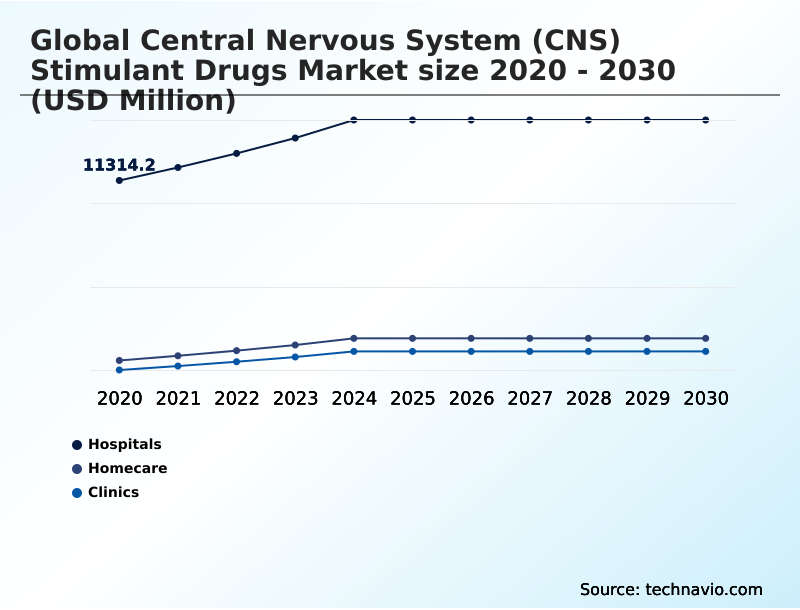
  • By Distribution Channel - Hospitals segment was valued at USD 13.93 billion in 2024
  • By Application - Attention-deficit hyperactivity disorder segment accounted for the largest market revenue share in 2024

Market Size & Forecast

  • Market Opportunities: USD 15.35 billion
  • Market Future Opportunities: USD 9.54 billion
  • CAGR from 2025 to 2030 : 7%

Market Summary

  • The central nervous system (CNS) stimulant drugs market is undergoing significant evolution, driven by rising diagnostic precision for conditions like attention deficit hyperactivity disorder and increasing neuro-performance demands in adult populations. Key market trends include the development of abuse-deterrent formulations and the shift towards orexin-first therapies that offer novel monoaminergic mechanisms.
  • These innovations aim to enhance therapeutic outcomes while addressing critical challenges such as supply chain volatility and a stringent regulatory compliance landscape. For example, a mid-sized pharmaceutical company is leveraging pharmacogenomic testing data to optimize its clinical trial design for a new multi-modal stimulant.
  • By stratifying patient groups based on predicted metabolic pathways, the firm improves the trial's efficiency, reduces clinical trial attrition rates by an estimated 15%, and accelerates its path to market.
  • This data-driven approach, combined with advances in transdermal drug delivery and digital therapeutics, is reshaping the competitive landscape, pushing the industry towards more personalized and secure treatment paradigms for managing sleep-wake dysregulation and other complex neurological conditions. The focus on early-intervention therapeutic protocols further supports this preventative and proactive healthcare model.

What will be the Size of the Central Nervous System (CNS) Stimulant Drugs Market during the forecast period?

Get Key Insights on Market Forecast (PDF) Request Free Sample

How is the Central Nervous System (CNS) Stimulant Drugs Market Segmented?

The central nervous system (cns) stimulant drugs industry research report provides comprehensive data (region-wise segment analysis), with forecasts and estimates in "USD million" for the period 2026-2030, as well as historical data from 2020-2024 for the following segments.

  • Distribution channel
    • Hospitals
    • Homecare
    • Clinics
  • Application
    • Attention-deficit hyperactivity disorder
    • Narcolepsy
    • Others
  • Route of administration
    • Oral tablets and capsules
    • Injectables
    • Transdermal patches
  • Geography
    • North America
      • US
      • Canada
      • Mexico
    • Europe
      • Germany
      • UK
      • France
    • Asia
    • Rest of World (ROW)

By Distribution Channel Insights

The hospitals segment is estimated to witness significant growth during the forecast period.

The hospitals segment is a critical channel for the global central nervous system (CNS) stimulant drugs market, managing high-potency therapies for acute neurological conditions.

These institutions are central to initiating treatment for severe narcolepsy treatment and stabilizing patients requiring immediate neuro-modulation therapies.

The segment’s importance is highlighted by regulatory actions, with production quotas for controlled research compounds increasing by 67% to support hospital-based trials and specialized protocols. This environment demands rigorous prescription drug monitoring and advanced systems for medication diversion control.

Hospitals are increasingly adopting sophisticated histaminergic modulators and catecholamine release stimulation agents, driving demand for therapies with superior cardiovascular safety profiles to manage conditions like excessive daytime sleepiness within an inpatient setting, ensuring both efficacy and compliance.

Request Free Sample

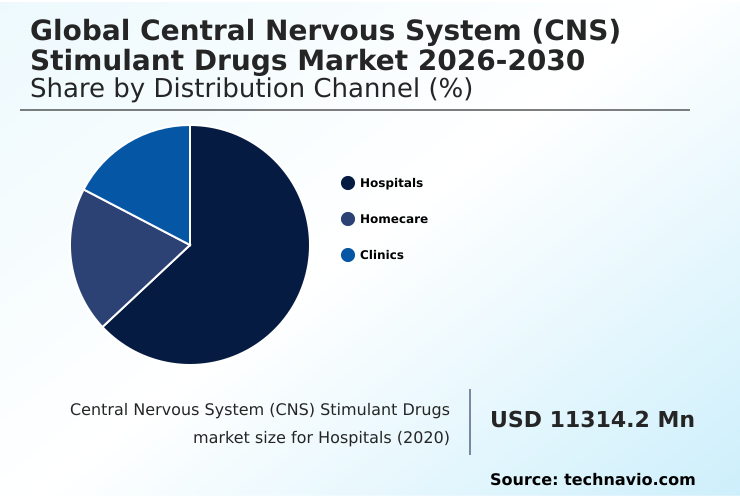
The Hospitals segment was valued at USD 13.93 billion in 2024 and showed a gradual increase during the forecast period.

Request Free Sample

Regional Analysis

North America is estimated to contribute 41.5% to the growth of the global market during the forecast period.Technavio’s analysts have elaborately explained the regional trends and drivers that shape the market during the forecast period.

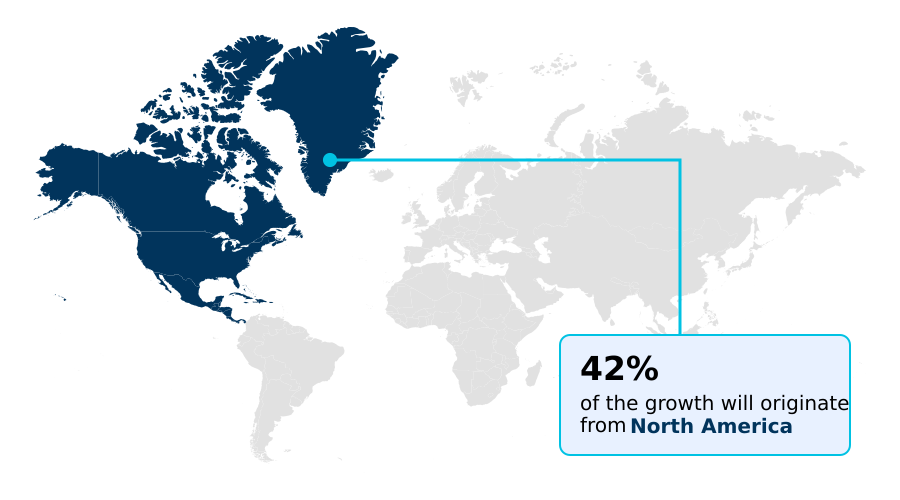
See How Central Nervous System (CNS) Stimulant Drugs Market Demand is Rising in North America Request Free Sample

The geographic landscape is shifting, with Asia emerging as the fastest-growing region, expanding at a rate of 9.4%, significantly outpacing North America's 6.3% growth.

This surge is fueled by a 38% increase in the identification of CNS-related conditions due to improved diagnostic access and a growing focus on pediatric neurodevelopment.

In mature markets, the focus is on precision neuro-modulation and implementing pro-drug stimulant technology to manage executive dysfunction support. In contrast, emerging economies are focused on building infrastructure for narcolepsy treatment and cataplexy management.

This global expansion relies on harmonizing standards for controlled-release harmonization and secure supply chain logistics to ensure therapies from selective norepinephrine reuptake inhibitors to sympathomimetic stimulants are available worldwide, addressing the global sleep-wake dysregulation burden.

Market Dynamics

Our researchers analyzed the data with 2025 as the base year, along with the key drivers, trends, and challenges. A holistic analysis of drivers will help companies refine their marketing strategies to gain a competitive advantage.

  • Strategic decision-making in the market is increasingly shaped by the development of abuse-deterrent cns stimulant formulations and the global harmonization of abuse-deterrent standards to address regulatory pressures. The integration of digital therapeutics for adhd management, often delivered via telepsychiatry for stimulant prescription monitoring, is becoming a standard of care.
  • In therapeutics, a significant shift is occurring toward orexin agonists for narcolepsy treatment, moving away from traditional approaches. Precision medicine is being realized through pharmacogenomic testing for stimulant selection, which helps in mitigating cardiovascular risks of stimulant use.
  • The industry is also exploring advanced delivery systems like long-acting injectables for cns disorders and transdermal patch technology for adhd to improve patient compliance and therapeutic outcomes. However, firms face significant challenges, including extended-release methylphenidate supply chain issues and the scientific hurdle of blood-brain barrier penetration enhancement techniques.
  • The intense regulatory oversight for schedule ii stimulants and ongoing challenges in developing novel cns therapeutics are major constraints. Discussions around the impact of pro-drug technology on misuse and the role of triple reuptake inhibitors are shaping R&D priorities.
  • Furthermore, managing the supply of controlled substances requires strategies for both supply chain resilience for controlled substances and addressing strategies for cns drug supply shortages.
  • Clinical practice is evolving with a focus on pediatric cns stimulant dosing strategies, managing adult adhd with lisdexamfetamine, optimizing cognitive performance with modafinil, and exploring non-stimulant alternatives for cns conditions and neuro-modulation as a stimulant alternative.

What are the key market drivers leading to the rise in the adoption of Central Nervous System (CNS) Stimulant Drugs Industry?

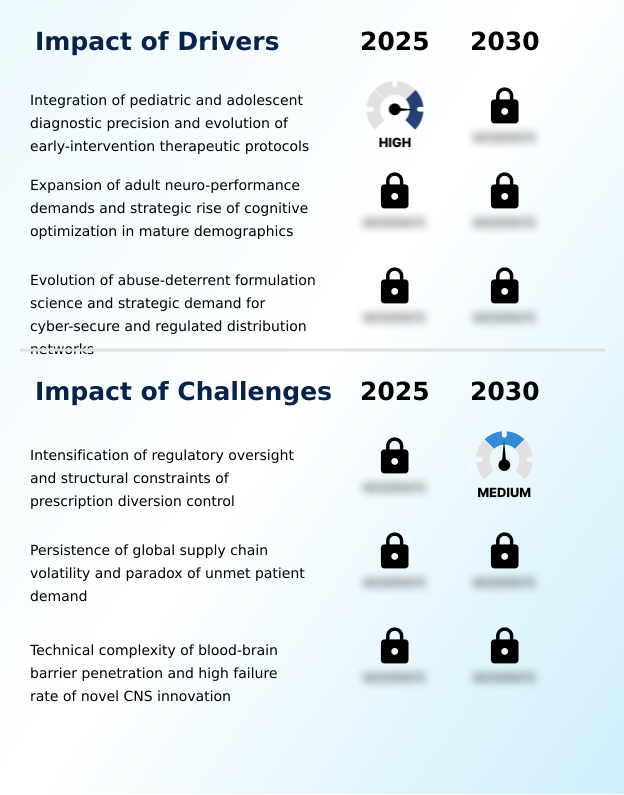
  • A key market driver is the integration of pediatric and adolescent diagnostic precision, which is consequently leading to the evolution of early-intervention therapeutic protocols.

  • A primary market driver is the surge in neuro-performance demands, particularly with the rise in adult ADHD diagnosis.
  • This has led to a record percentage increase in dispensing rates for adults over 25, creating a lifespan-management model for cognitive optimization pharmacology.
  • To meet this demand responsibly, the industry is advancing abuse-deterrent formulation science and pushing for secure regulated distribution networks. The recent regulatory approval of a generic amphetamine with specific exclusivity periods highlights the competitive pressure to balance access with safety.
  • This focus on pediatric diagnostic precision and early-intervention therapeutic protocols for conditions like attention deficit hyperactivity disorder ensures that pharmacokinetic profiles are optimized from an early stage, setting a foundation for long-term treatment success.

What are the market trends shaping the Central Nervous System (CNS) Stimulant Drugs Industry?

  • The market is witnessing a significant trend toward the institutionalization of specialized orexin agonists. This marks a strategic shift away from traditional monoaminergic mechanisms for promoting wakefulness.

  • The market is evolving beyond traditional pills, with transdermal drug delivery systems now accounting for 24% of new treatment modalities for certain CNS disorders. This shift is driven by the need to ensure therapeutic window stability and improve patient adherence monitoring.
  • The institutionalization of digital therapeutics and telepsychiatry-integrated monitoring systems is accelerating, underscored by a recent 9% single-quarter surge in CNS stimulant prescriptions in one major European health system. This reflects a broader trend toward a holistic management of neurodevelopmental disorders, where pharmacological intervention governance is enhanced by real-time data.
  • As non-monoaminergic wakefulness agents and orexin-first therapies gain traction, the focus remains on minimizing diversion risks and addressing unmet patient demand sustainably.

What challenges does the Central Nervous System (CNS) Stimulant Drugs Industry face during its growth?

  • A primary challenge affecting industry growth is the intensification of regulatory oversight coupled with the structural constraints of controlling prescription diversion.

  • A significant market challenge is the technical complexity of drug development, as blood-brain barrier penetration remains a formidable obstacle, blocking nearly 98% of potential therapeutic candidates. This results in high clinical trial attrition rates, with CNS drug candidates showing a markedly lower success rate compared to other therapy areas.
  • The industry grapples with supply chain volatility, which exacerbates unmet patient demand and complicates the management of medication diversion control. Furthermore, intensified regulatory oversight and the need for advanced compliance software create significant operational hurdles.
  • Addressing the psychiatric comorbidity management in patients requires more sophisticated multi-modal stimulants, yet the high cost of research and development investment and the difficulty in clinical endpoint demonstration restrain innovation, especially for treatment-resistant depression.

Exclusive Technavio Analysis on Customer Landscape

The central nervous system (cns) stimulant drugs market forecasting report includes the adoption lifecycle of the market, covering from the innovator’s stage to the laggard’s stage. It focuses on adoption rates in different regions based on penetration. Furthermore, the central nervous system (cns) stimulant drugs market report also includes key purchase criteria and drivers of price sensitivity to help companies evaluate and develop their market growth analysis strategies.

Customer Landscape of Central Nervous System (CNS) Stimulant Drugs Industry

Competitive Landscape

Companies are implementing various strategies, such as strategic alliances, central nervous system (cns) stimulant drugs market forecast, partnerships, mergers and acquisitions, geographical expansion, and product/service launches, to enhance their presence in the industry.

AbbVie Inc. - Offers central nervous system (CNS) stimulant drugs such as ABV-1505 and Vraylar for treating complex neurological conditions.

The industry research and growth report includes detailed analyses of the competitive landscape of the market and information about key companies, including:

  • AbbVie Inc.
  • Amneal Pharmaceuticals Inc.
  • Assertio Holdings Inc
  • Aytu BioPharma Inc.
  • Azurity Pharmaceuticals Inc.
  • Cosette Pharmaceuticals Inc.
  • Jazz Pharmaceuticals Plc
  • Lannett Co Inc.
  • Mallinckrodt Plc
  • Novartis AG
  • Noven Pharmaceuticals Inc.
  • Otsuka Holdings Co. Ltd.
  • Pfizer Inc.
  • Purdue Pharma LP
  • Rhodes Pharmaceuticals L.P.
  • Supernus Pharmaceuticals Inc.
  • Takeda Pharmaceutical Ltd.
  • Teva Pharmaceutical Ltd.
  • Zealand Pharma

Qualitative and quantitative analysis of companies has been conducted to help clients understand the wider business environment as well as the strengths and weaknesses of key industry players. Data is qualitatively analyzed to categorize companies as pure play, category-focused, industry-focused, and diversified; it is quantitatively analyzed to categorize companies as dominant, leading, strong, tentative, and weak.

Recent Development and News in Central nervous system (cns) stimulant drugs market

  • In April 2025, Jazz Pharmaceuticals Plc reported that its sleep franchise exceeded $2 billion in annual revenue for 2024, supported by the continued growth of its leading treatments for narcolepsy.
  • In February 2025, Supernus Pharmaceuticals Inc. reported record total revenues for its 2024 fiscal year, driven by the sustained commercial momentum of its integrated ADHD portfolio.
  • In January 2025, Takeda Pharmaceutical Ltd. announced a revision to its full-year 2024 financial forecasts, noting an acceleration toward its next-generation late-stage programs in neuroscience.
  • In September 2024, Alkermes plc received Breakthrough Therapy designation from the US Food and Drug Administration for alixorexton, an investigational oral OX2R agonist for the treatment of narcolepsy.

Dive into Technavio’s robust research methodology, blending expert interviews, extensive data synthesis, and validated models for unparalleled Central Nervous System (CNS) Stimulant Drugs Market insights. See full methodology.

Market Scope
Page number 289
Base year 2025
Historic period 2020-2024
Forecast period 2026-2030
Growth momentum & CAGR Accelerate at a CAGR of 7%
Market growth 2026-2030 USD 9541.2 million
Market structure Fragmented
YoY growth 2025-2026(%) 6.6%
Key countries US, Canada, Mexico, Germany, UK, France, Spain, The Netherlands, Italy, China, Japan, India, South Korea, Indonesia, Thailand, Brazil, Saudi Arabia, Turkey, UAE, South Africa, Israel, Argentina and Colombia
Competitive landscape Leading Companies, Market Positioning of Companies, Competitive Strategies, and Industry Risks

Request Free Sample

Research Analyst Overview

  • The market is defined by a push for cognitive optimization pharmacology, driven by escalating neuro-performance demands. A key boardroom focus is aligning R&D with abuse-deterrent formulation science, as the clinical success rate for CNS therapies remains significantly lower than other areas. Innovation is centered on orexin-first therapies and non-monoaminergic wakefulness agents, moving beyond traditional monoaminergic mechanisms and serotonin reuptake inhibition.
  • Development of abuse-deterrent formulations using prodrug technologies and microsphere matrices is critical for secure regulated distribution. Firms are exploring long-acting injectable formulations, pro-drug stimulant technology, and transdermal drug delivery to improve pharmacokinetic profiles. The pipeline includes precision neuro-modulation via orexin receptor agonists, selective norepinephrine reuptake inhibitors, alpha-2 adrenergic agonists, and histaminergic modulators.
  • Managing psychiatric comorbidity management requires advanced multi-modal stimulants and pharmacogenomic testing to overcome challenges in blood-brain barrier penetration and avoid interactions with synthetic cathinones. This requires detailed early-intervention therapeutic protocols based on pediatric diagnostic precision and supported by telepsychiatry-integrated monitoring.
  • The goal is controlled-release harmonization of agents that influence catecholamine release stimulation and neurotransmitter regulation through extended-release matrices and triple reuptake inhibitor technology.

What are the Key Data Covered in this Central Nervous System (CNS) Stimulant Drugs Market Research and Growth Report?

  • What is the expected growth of the Central Nervous System (CNS) Stimulant Drugs Market between 2026 and 2030?

    • USD 9.54 billion, at a CAGR of 7%

  • What segmentation does the market report cover?

    • The report is segmented by Distribution Channel (Hospitals, Homecare, and Clinics), Application (Attention-deficit hyperactivity disorder, Narcolepsy, and Others), Route of Administration (Oral tablets and capsules, Injectables, and Transdermal patches) and Geography (North America, Europe, Asia, Rest of World (ROW))

  • Which regions are analyzed in the report?

    • North America, Europe, Asia and Rest of World (ROW)

  • What are the key growth drivers and market challenges?

    • Integration of pediatric and adolescent diagnostic precision and evolution of early-intervention therapeutic protocols, Intensification of regulatory oversight and structural constraints of prescription diversion control

  • Who are the major players in the Central Nervous System (CNS) Stimulant Drugs Market?

    • AbbVie Inc., Amneal Pharmaceuticals Inc., Assertio Holdings Inc, Aytu BioPharma Inc., Azurity Pharmaceuticals Inc., Cosette Pharmaceuticals Inc., Jazz Pharmaceuticals Plc, Lannett Co Inc., Mallinckrodt Plc, Novartis AG, Noven Pharmaceuticals Inc., Otsuka Holdings Co. Ltd., Pfizer Inc., Purdue Pharma LP, Rhodes Pharmaceuticals L.P., Supernus Pharmaceuticals Inc., Takeda Pharmaceutical Ltd., Teva Pharmaceutical Ltd. and Zealand Pharma

Market Research Insights

  • The market dynamics are shaped by the need to manage adult ADHD diagnosis and executive dysfunction support amid a strict regulatory compliance landscape. The adoption of advanced compliance software has been shown to reduce reporting errors by over 40%, a critical factor given the scrutiny on medication diversion control.
  • As lifespan-management model approaches become standard for attention deficit hyperactivity disorder, the industry is focusing on diversion risk mitigation through innovative delivery systems. This has improved patient adherence monitoring, with some digital platforms showing a 25% increase in medication consistency.
  • The dual pressures of unmet patient demand and supply chain volatility are pushing firms toward more resilient secure supply chain logistics, making post-market surveillance and proactive risk management central to operational strategy.

We can help! Our analysts can customize this central nervous system (cns) stimulant drugs market research report to meet your requirements.

Get in touch

1. Executive Summary

1.1 Market overview

Executive Summary - Chart on Market Overview
Executive Summary - Data Table on Market Overview
Executive Summary - Chart on Global Market Characteristics
Executive Summary - Chart on Market by Geography
Executive Summary - Chart on Market Segmentation by Distribution Channel
Executive Summary - Chart on Market Segmentation by Application
Executive Summary - Chart on Market Segmentation by Route of Administration
Executive Summary - Chart on Incremental Growth
Executive Summary - Data Table on Incremental Growth
Executive Summary - Chart on Company Market Positioning

2. Technavio Analysis

2.1 Analysis of price sensitivity, lifecycle, customer purchase basket, adoption rates, and purchase criteria

2.2 Criticality of inputs and Factors of differentiation

Chart on Overview on criticality of inputs and factors of differentiation

2.3 Factors of disruption

Chart on Overview on factors of disruption

2.4 Impact of drivers and challenges

Chart on Impact of drivers and challenges in 2025 and 2030

3. Market Landscape

3.1 Market ecosystem

Chart on Parent Market
Data Table on - Parent Market

3.2 Market characteristics

Chart on Market characteristics analysis

3.3 Value chain analysis

Chart on Value chain analysis

4. Market Sizing

4.1 Market definition

Data Table on Offerings of companies included in the market definition

4.2 Market segment analysis

Market segments

4.3 Market size 2025

4.4 Market outlook: Forecast for 2025-2030

Chart on Global - Market size and forecast 2025-2030 ($ million)
Data Table on Global - Market size and forecast 2025-2030 ($ million)
Chart on Global Market: Year-over-year growth 2025-2030 (%)
Data Table on Global Market: Year-over-year growth 2025-2030 (%)

5. Historic Market Size

5.1 Global Central Nervous System (CNS) Stimulant Drugs Market 2020 - 2024

Historic Market Size - Data Table on Global Central Nervous System (CNS) Stimulant Drugs Market 2020 - 2024 ($ million)

5.2 Distribution Channel segment analysis 2020 - 2024

Historic Market Size - Distribution Channel Segment 2020 - 2024 ($ million)

5.3 Application segment analysis 2020 - 2024

Historic Market Size - Application Segment 2020 - 2024 ($ million)

5.4 Route of Administration segment analysis 2020 - 2024

Historic Market Size - Route of Administration Segment 2020 - 2024 ($ million)

5.5 Geography segment analysis 2020 - 2024

Historic Market Size - Geography Segment 2020 - 2024 ($ million)

5.6 Country segment analysis 2020 - 2024

Historic Market Size - Country Segment 2020 - 2024 ($ million)

6. Qualitative Analysis

6.1 Impact of AI global central nervous system (CNS) stimulant drugs market

6.2 Impact of geopolitical conflict for global central nervous system (CNS) stimulant drugs market

7. Five Forces Analysis

7.1 Five forces summary

Five forces analysis - Comparison between 2025 and 2030

7.2 Bargaining power of buyers

Bargaining power of buyers - Impact of key factors 2025 and 2030

7.3 Bargaining power of suppliers

Bargaining power of suppliers - Impact of key factors in 2025 and 2030

7.4 Threat of new entrants

Threat of new entrants - Impact of key factors in 2025 and 2030

7.5 Threat of substitutes

Threat of substitutes - Impact of key factors in 2025 and 2030

7.6 Threat of rivalry

Threat of rivalry - Impact of key factors in 2025 and 2030

7.7 Market condition

Chart on Market condition - Five forces 2025 and 2030

8. Market Segmentation by Distribution Channel

8.1 Market segments

Chart on Distribution Channel - Market share 2025-2030 (%)
Data Table on Distribution Channel - Market share 2025-2030 (%)

8.2 Comparison by Distribution Channel

Chart on Comparison by Distribution Channel
Data Table on Comparison by Distribution Channel

8.3 Hospitals - Market size and forecast 2025-2030

Chart on Hospitals - Market size and forecast 2025-2030 ($ million)
Data Table on Hospitals - Market size and forecast 2025-2030 ($ million)
Chart on Hospitals - Year-over-year growth 2025-2030 (%)
Data Table on Hospitals - Year-over-year growth 2025-2030 (%)

8.4 Homecare - Market size and forecast 2025-2030

Chart on Homecare - Market size and forecast 2025-2030 ($ million)
Data Table on Homecare - Market size and forecast 2025-2030 ($ million)
Chart on Homecare - Year-over-year growth 2025-2030 (%)
Data Table on Homecare - Year-over-year growth 2025-2030 (%)

8.5 Clinics - Market size and forecast 2025-2030

Chart on Clinics - Market size and forecast 2025-2030 ($ million)
Data Table on Clinics - Market size and forecast 2025-2030 ($ million)
Chart on Clinics - Year-over-year growth 2025-2030 (%)
Data Table on Clinics - Year-over-year growth 2025-2030 (%)

8.6 Market opportunity by Distribution Channel

Market opportunity by Distribution Channel ($ million)
Data Table on Market opportunity by Distribution Channel ($ million)

9. Market Segmentation by Application

9.1 Market segments

Chart on Application - Market share 2025-2030 (%)
Data Table on Application - Market share 2025-2030 (%)

9.2 Comparison by Application

Chart on Comparison by Application
Data Table on Comparison by Application

9.3 Attention-deficit hyperactivity disorder - Market size and forecast 2025-2030

Chart on Attention-deficit hyperactivity disorder - Market size and forecast 2025-2030 ($ million)
Data Table on Attention-deficit hyperactivity disorder - Market size and forecast 2025-2030 ($ million)
Chart on Attention-deficit hyperactivity disorder - Year-over-year growth 2025-2030 (%)
Data Table on Attention-deficit hyperactivity disorder - Year-over-year growth 2025-2030 (%)

9.4 Narcolepsy - Market size and forecast 2025-2030

Chart on Narcolepsy - Market size and forecast 2025-2030 ($ million)
Data Table on Narcolepsy - Market size and forecast 2025-2030 ($ million)
Chart on Narcolepsy - Year-over-year growth 2025-2030 (%)
Data Table on Narcolepsy - Year-over-year growth 2025-2030 (%)

9.5 Others - Market size and forecast 2025-2030

Chart on Others - Market size and forecast 2025-2030 ($ million)
Data Table on Others - Market size and forecast 2025-2030 ($ million)
Chart on Others - Year-over-year growth 2025-2030 (%)
Data Table on Others - Year-over-year growth 2025-2030 (%)

9.6 Market opportunity by Application

Market opportunity by Application ($ million)
Data Table on Market opportunity by Application ($ million)

10. Market Segmentation by Route of Administration

10.1 Market segments

Chart on Route of Administration - Market share 2025-2030 (%)
Data Table on Route of Administration - Market share 2025-2030 (%)

10.2 Comparison by Route of Administration

Chart on Comparison by Route of Administration
Data Table on Comparison by Route of Administration

10.3 Oral tablets and capsules - Market size and forecast 2025-2030

Chart on Oral tablets and capsules - Market size and forecast 2025-2030 ($ million)
Data Table on Oral tablets and capsules - Market size and forecast 2025-2030 ($ million)
Chart on Oral tablets and capsules - Year-over-year growth 2025-2030 (%)
Data Table on Oral tablets and capsules - Year-over-year growth 2025-2030 (%)

10.4 Injectables - Market size and forecast 2025-2030

Chart on Injectables - Market size and forecast 2025-2030 ($ million)
Data Table on Injectables - Market size and forecast 2025-2030 ($ million)
Chart on Injectables - Year-over-year growth 2025-2030 (%)
Data Table on Injectables - Year-over-year growth 2025-2030 (%)

10.5 Transdermal patches - Market size and forecast 2025-2030

Chart on Transdermal patches - Market size and forecast 2025-2030 ($ million)
Data Table on Transdermal patches - Market size and forecast 2025-2030 ($ million)
Chart on Transdermal patches - Year-over-year growth 2025-2030 (%)
Data Table on Transdermal patches - Year-over-year growth 2025-2030 (%)

10.6 Market opportunity by Route of Administration

Market opportunity by Route of Administration ($ million)
Data Table on Market opportunity by Route of Administration ($ million)

11. Customer Landscape

11.1 Customer landscape overview

Analysis of price sensitivity, lifecycle, customer purchase basket, adoption rates, and purchase criteria

12. Geographic Landscape

12.1 Geographic segmentation

Chart on Market share by geography 2025-2030 (%)
Data Table on Market share by geography 2025-2030 (%)

12.2 Geographic comparison

Chart on Geographic comparison
Data Table on Geographic comparison

12.3 North America - Market size and forecast 2025-2030

Chart on North America - Market size and forecast 2025-2030 ($ million)
Data Table on North America - Market size and forecast 2025-2030 ($ million)
Chart on North America - Year-over-year growth 2025-2030 (%)
Data Table on North America - Year-over-year growth 2025-2030 (%)
Chart on Regional Comparison - North America
Data Table on Regional Comparison - North America

12.3.1 US - Market size and forecast 2025-2030

Chart on US - Market size and forecast 2025-2030 ($ million)
Data Table on US - Market size and forecast 2025-2030 ($ million)
Chart on US - Year-over-year growth 2025-2030 (%)
Data Table on US - Year-over-year growth 2025-2030 (%)

12.3.2 Canada - Market size and forecast 2025-2030

Chart on Canada - Market size and forecast 2025-2030 ($ million)
Data Table on Canada - Market size and forecast 2025-2030 ($ million)
Chart on Canada - Year-over-year growth 2025-2030 (%)
Data Table on Canada - Year-over-year growth 2025-2030 (%)

12.3.3 Mexico - Market size and forecast 2025-2030

Chart on Mexico - Market size and forecast 2025-2030 ($ million)
Data Table on Mexico - Market size and forecast 2025-2030 ($ million)
Chart on Mexico - Year-over-year growth 2025-2030 (%)
Data Table on Mexico - Year-over-year growth 2025-2030 (%)

12.4 Europe - Market size and forecast 2025-2030

Chart on Europe - Market size and forecast 2025-2030 ($ million)
Data Table on Europe - Market size and forecast 2025-2030 ($ million)
Chart on Europe - Year-over-year growth 2025-2030 (%)
Data Table on Europe - Year-over-year growth 2025-2030 (%)
Chart on Regional Comparison - Europe
Data Table on Regional Comparison - Europe

12.4.1 Germany - Market size and forecast 2025-2030

Chart on Germany - Market size and forecast 2025-2030 ($ million)
Data Table on Germany - Market size and forecast 2025-2030 ($ million)
Chart on Germany - Year-over-year growth 2025-2030 (%)
Data Table on Germany - Year-over-year growth 2025-2030 (%)

12.4.2 UK - Market size and forecast 2025-2030

Chart on UK - Market size and forecast 2025-2030 ($ million)
Data Table on UK - Market size and forecast 2025-2030 ($ million)
Chart on UK - Year-over-year growth 2025-2030 (%)
Data Table on UK - Year-over-year growth 2025-2030 (%)

12.4.3 France - Market size and forecast 2025-2030

Chart on France - Market size and forecast 2025-2030 ($ million)
Data Table on France - Market size and forecast 2025-2030 ($ million)
Chart on France - Year-over-year growth 2025-2030 (%)
Data Table on France - Year-over-year growth 2025-2030 (%)

12.4.4 Spain - Market size and forecast 2025-2030

Chart on Spain - Market size and forecast 2025-2030 ($ million)
Data Table on Spain - Market size and forecast 2025-2030 ($ million)
Chart on Spain - Year-over-year growth 2025-2030 (%)
Data Table on Spain - Year-over-year growth 2025-2030 (%)

12.4.5 The Netherlands - Market size and forecast 2025-2030

Chart on The Netherlands - Market size and forecast 2025-2030 ($ million)
Data Table on The Netherlands - Market size and forecast 2025-2030 ($ million)
Chart on The Netherlands - Year-over-year growth 2025-2030 (%)
Data Table on The Netherlands - Year-over-year growth 2025-2030 (%)

12.4.6 Italy - Market size and forecast 2025-2030

Chart on Italy - Market size and forecast 2025-2030 ($ million)
Data Table on Italy - Market size and forecast 2025-2030 ($ million)
Chart on Italy - Year-over-year growth 2025-2030 (%)
Data Table on Italy - Year-over-year growth 2025-2030 (%)

12.5 Asia - Market size and forecast 2025-2030

Chart on Asia - Market size and forecast 2025-2030 ($ million)
Data Table on Asia - Market size and forecast 2025-2030 ($ million)
Chart on Asia - Year-over-year growth 2025-2030 (%)
Data Table on Asia - Year-over-year growth 2025-2030 (%)
Chart on Regional Comparison - Asia
Data Table on Regional Comparison - Asia

12.5.1 China - Market size and forecast 2025-2030

Chart on China - Market size and forecast 2025-2030 ($ million)
Data Table on China - Market size and forecast 2025-2030 ($ million)
Chart on China - Year-over-year growth 2025-2030 (%)
Data Table on China - Year-over-year growth 2025-2030 (%)

12.5.2 Japan - Market size and forecast 2025-2030

Chart on Japan - Market size and forecast 2025-2030 ($ million)
Data Table on Japan - Market size and forecast 2025-2030 ($ million)
Chart on Japan - Year-over-year growth 2025-2030 (%)
Data Table on Japan - Year-over-year growth 2025-2030 (%)

12.5.3 India - Market size and forecast 2025-2030

Chart on India - Market size and forecast 2025-2030 ($ million)
Data Table on India - Market size and forecast 2025-2030 ($ million)
Chart on India - Year-over-year growth 2025-2030 (%)
Data Table on India - Year-over-year growth 2025-2030 (%)

12.5.4 South Korea - Market size and forecast 2025-2030

Chart on South Korea - Market size and forecast 2025-2030 ($ million)
Data Table on South Korea - Market size and forecast 2025-2030 ($ million)
Chart on South Korea - Year-over-year growth 2025-2030 (%)
Data Table on South Korea - Year-over-year growth 2025-2030 (%)

12.5.5 Indonesia - Market size and forecast 2025-2030

Chart on Indonesia - Market size and forecast 2025-2030 ($ million)
Data Table on Indonesia - Market size and forecast 2025-2030 ($ million)
Chart on Indonesia - Year-over-year growth 2025-2030 (%)
Data Table on Indonesia - Year-over-year growth 2025-2030 (%)

12.5.6 Thailand - Market size and forecast 2025-2030

Chart on Thailand - Market size and forecast 2025-2030 ($ million)
Data Table on Thailand - Market size and forecast 2025-2030 ($ million)
Chart on Thailand - Year-over-year growth 2025-2030 (%)
Data Table on Thailand - Year-over-year growth 2025-2030 (%)

12.6 Rest of World (ROW) - Market size and forecast 2025-2030

Chart on Rest of World (ROW) - Market size and forecast 2025-2030 ($ million)
Data Table on Rest of World (ROW) - Market size and forecast 2025-2030 ($ million)
Chart on Rest of World (ROW) - Year-over-year growth 2025-2030 (%)
Data Table on Rest of World (ROW) - Year-over-year growth 2025-2030 (%)
Chart on Regional Comparison - Rest of World (ROW)
Data Table on Regional Comparison - Rest of World (ROW)

12.6.1 Brazil - Market size and forecast 2025-2030

Chart on Brazil - Market size and forecast 2025-2030 ($ million)
Data Table on Brazil - Market size and forecast 2025-2030 ($ million)
Chart on Brazil - Year-over-year growth 2025-2030 (%)
Data Table on Brazil - Year-over-year growth 2025-2030 (%)

12.6.2 Saudi Arabia - Market size and forecast 2025-2030

Chart on Saudi Arabia - Market size and forecast 2025-2030 ($ million)
Data Table on Saudi Arabia - Market size and forecast 2025-2030 ($ million)
Chart on Saudi Arabia - Year-over-year growth 2025-2030 (%)
Data Table on Saudi Arabia - Year-over-year growth 2025-2030 (%)

12.6.3 Turkey - Market size and forecast 2025-2030

Chart on Turkey - Market size and forecast 2025-2030 ($ million)
Data Table on Turkey - Market size and forecast 2025-2030 ($ million)
Chart on Turkey - Year-over-year growth 2025-2030 (%)
Data Table on Turkey - Year-over-year growth 2025-2030 (%)

12.6.4 UAE - Market size and forecast 2025-2030

Chart on UAE - Market size and forecast 2025-2030 ($ million)
Data Table on UAE - Market size and forecast 2025-2030 ($ million)
Chart on UAE - Year-over-year growth 2025-2030 (%)
Data Table on UAE - Year-over-year growth 2025-2030 (%)

12.6.5 South Africa - Market size and forecast 2025-2030

Chart on South Africa - Market size and forecast 2025-2030 ($ million)
Data Table on South Africa - Market size and forecast 2025-2030 ($ million)
Chart on South Africa - Year-over-year growth 2025-2030 (%)
Data Table on South Africa - Year-over-year growth 2025-2030 (%)

12.6.6 Israel - Market size and forecast 2025-2030

Chart on Israel - Market size and forecast 2025-2030 ($ million)
Data Table on Israel - Market size and forecast 2025-2030 ($ million)
Chart on Israel - Year-over-year growth 2025-2030 (%)
Data Table on Israel - Year-over-year growth 2025-2030 (%)

12.6.7 Argentina - Market size and forecast 2025-2030

Chart on Argentina - Market size and forecast 2025-2030 ($ million)
Data Table on Argentina - Market size and forecast 2025-2030 ($ million)
Chart on Argentina - Year-over-year growth 2025-2030 (%)
Data Table on Argentina - Year-over-year growth 2025-2030 (%)

12.6.8 Colombia - Market size and forecast 2025-2030

Chart on Colombia - Market size and forecast 2025-2030 ($ million)
Data Table on Colombia - Market size and forecast 2025-2030 ($ million)
Chart on Colombia - Year-over-year growth 2025-2030 (%)
Data Table on Colombia - Year-over-year growth 2025-2030 (%)

12.7 Market opportunity by geography

Market opportunity by geography ($ million)
Data Tables on Market opportunity by geography ($ million)

13. Drivers, Challenges, and Opportunity

13.1 Market drivers

Integration of pediatric and adolescent diagnostic precision and evolution of early-intervention therapeutic protocols
Expansion of adult neuro-performance demands and strategic rise of cognitive optimization in mature demographics
Evolution of abuse-deterrent formulation science and strategic demand for cyber-secure and regulated distribution networks

13.2 Market challenges

Intensification of regulatory oversight and structural constraints of prescription diversion control
Persistence of global supply chain volatility and paradox of unmet patient demand
Technical complexity of blood-brain barrier penetration and high failure rate of novel CNS innovation

13.3 Impact of drivers and challenges

Impact of drivers and challenges in 2025 and 2030

13.4 Market opportunities

Institutionalization of specialized orexin agonists and shift toward non-monoaminergic wakefulness
Growth of digital therapeutics and telepsychiatry-integrated monitoring systems
Strategic transition toward abuse-deterrent formulations and controlled release harmonization

14. Competitive Landscape

14.1 Overview

14.2

Overview on criticality of inputs and factors of differentiation

14.3 Landscape disruption

Overview on factors of disruption

14.4 Industry risks

Impact of key risks on business

15. Competitive Analysis

15.1 Companies profiled

Companies covered

15.2 Company ranking index

15.3 Market positioning of companies

Matrix on companies position and classification

15.4 AbbVie Inc.

AbbVie Inc. - Overview
AbbVie Inc. - Business segments
AbbVie Inc. - Key offerings
AbbVie Inc. - Segment focus
SWOT

15.5 Aytu BioPharma Inc.

Aytu BioPharma Inc. - Overview
Aytu BioPharma Inc. - Product / Service
Aytu BioPharma Inc. - Key offerings
SWOT

15.6 Azurity Pharmaceuticals Inc.

Azurity Pharmaceuticals Inc. - Overview
Azurity Pharmaceuticals Inc. - Product / Service
Azurity Pharmaceuticals Inc. - Key offerings
SWOT

15.7 Cosette Pharmaceuticals Inc.

Cosette Pharmaceuticals Inc. - Overview
Cosette Pharmaceuticals Inc. - Product / Service
Cosette Pharmaceuticals Inc. - Key offerings
SWOT

15.8 Jazz Pharmaceuticals Plc

Jazz Pharmaceuticals Plc - Overview
Jazz Pharmaceuticals Plc - Product / Service
Jazz Pharmaceuticals Plc - Key offerings
SWOT

15.9 Lannett Co Inc.

Lannett Co Inc. - Overview
Lannett Co Inc. - Product / Service
Lannett Co Inc. - Key offerings
SWOT

15.10 Mallinckrodt Plc

Mallinckrodt Plc - Overview
Mallinckrodt Plc - Business segments
Mallinckrodt Plc - Key offerings
Mallinckrodt Plc - Segment focus
SWOT

15.11 Novartis AG

Novartis AG - Overview
Novartis AG - Business segments
Novartis AG - Key news
Novartis AG - Key offerings
Novartis AG - Segment focus
SWOT

15.12 Noven Pharmaceuticals Inc.

Noven Pharmaceuticals Inc. - Overview
Noven Pharmaceuticals Inc. - Product / Service
Noven Pharmaceuticals Inc. - Key offerings
SWOT

15.13 Otsuka Holdings Co. Ltd.

Otsuka Holdings Co. Ltd. - Overview
Otsuka Holdings Co. Ltd. - Business segments
Otsuka Holdings Co. Ltd. - Key offerings
Otsuka Holdings Co. Ltd. - Segment focus
SWOT

15.14 Pfizer Inc.

Pfizer Inc. - Overview
Pfizer Inc. - Business segments
Pfizer Inc. - Key offerings
Pfizer Inc. - Segment focus
SWOT

15.15 Purdue Pharma LP

Purdue Pharma LP - Overview
Purdue Pharma LP - Product / Service
Purdue Pharma LP - Key offerings
SWOT

15.16 Supernus Pharmaceuticals Inc.

Supernus Pharmaceuticals Inc. - Overview
Supernus Pharmaceuticals Inc. - Product / Service
Supernus Pharmaceuticals Inc. - Key offerings
SWOT

15.17 Takeda Pharmaceutical Ltd.

Takeda Pharmaceutical Ltd. - Overview
Takeda Pharmaceutical Ltd. - Business segments
Takeda Pharmaceutical Ltd. - Key offerings
Takeda Pharmaceutical Ltd. - Segment focus
SWOT

15.18 Teva Pharmaceutical Ltd.

Teva Pharmaceutical Ltd. - Overview
Teva Pharmaceutical Ltd. - Business segments
Teva Pharmaceutical Ltd. - Key offerings
Teva Pharmaceutical Ltd. - Segment focus
SWOT

16. Appendix

16.1 Scope of the report

Market definition
Objectives
Notes and caveats

16.2 Inclusions and exclusions checklist

Inclusions checklist
Exclusions checklist

16.3 Currency conversion rates for US$

16.4 Research methodology

16.5 Data procurement

Information sources

16.6 Data validation

16.7 Validation techniques employed for market sizing

16.8 Data synthesis

16.9 360 degree market analysis

16.10 List of abbreviations

Research Methodology

Technavio presents a detailed picture of the market by way of study, synthesis, and summation of data from multiple sources. The analysts have presented the various facets of the market with a particular focus on identifying the key industry influencers. The data thus presented is comprehensive, reliable, and the result of extensive research, both primary and secondary.

INFORMATION SOURCES

Primary sources

  • Manufacturers and suppliers
  • Channel partners
  • Industry experts
  • Strategic decision makers

Secondary sources

  • Industry journals and periodicals
  • Government data
  • Financial reports of key industry players
  • Historical data
  • Press releases

DATA ANALYSIS

Data Synthesis

  • Collation of data
  • Estimation of key figures
  • Analysis of derived insights

Data Validation

  • Triangulation with data models
  • Reference against proprietary databases
  • Corroboration with industry experts

REPORT WRITING

Qualitative

  • Market drivers
  • Market challenges
  • Market trends
  • Five forces analysis

Quantitative

  • Market size and forecast
  • Market segmentation
  • Geographical insights
  • Competitive landscape

Interested in this report?

Get your sample now to see our research methodology and insights!

Download Now

Frequently Asked Questions

Central Nervous System (CNS) Stimulant Drugs market growth will increase by USD 9541.2 million during 2026-2030.

The Central Nervous System (CNS) Stimulant Drugs market is expected to grow at a CAGR of 7% during 2026-2030.

Central Nervous System (CNS) Stimulant Drugs market is segmented by Distribution channel (Hospitals, Homecare, Clinics) Application (Attention-deficit hyperactivity disorder, Narcolepsy, Others) Route of administration (Oral tablets and capsules, Injectables, Transdermal patches)

AbbVie Inc., Amneal Pharmaceuticals Inc., Assertio Holdings Inc, Aytu BioPharma Inc., Azurity Pharmaceuticals Inc., Cosette Pharmaceuticals Inc., Jazz Pharmaceuticals Plc, Lannett Co Inc., Mallinckrodt Plc, Novartis AG, Noven Pharmaceuticals Inc., Otsuka Holdings Co. Ltd., Pfizer Inc., Purdue Pharma LP, Rhodes Pharmaceuticals L.P., Supernus Pharmaceuticals Inc., Takeda Pharmaceutical Ltd., Teva Pharmaceutical Ltd., Zealand Pharma are a few of the key vendors in the Central Nervous System (CNS) Stimulant Drugs market.

North America will register the highest growth rate of 41.5% among the other regions. Therefore, the Central Nervous System (CNS) Stimulant Drugs market in North America is expected to garner significant business opportunities for the vendors during the forecast period.

US, Canada, Mexico, Germany, UK, France, Spain, The Netherlands, Italy, China, Japan, India, South Korea, Indonesia, Thailand, Brazil, Saudi Arabia, Turkey, UAE, South Africa, Israel, Argentina, Colombia

  • Integration of pediatric and adolescent diagnostic precision and evolution of early-intervention therapeutic protocols is the driving factor this market.

The Central Nervous System (CNS) Stimulant Drugs market vendors should focus on grabbing business opportunities from the Distribution channel segment as it accounted for the largest market share in the base year.
RIA - Research AI Assistant
Ask RIA