Childcare Management Software Market Analysis, Size, and Forecast 2024-2028: North America (US, Canada, and Mexico), Europe (France, Germany, Italy, Spain, UK), APAC (China, India, Japan, South Korea), South America (Brazil), and Middle East and Africa (UAE)

Childcare Management Software Market Analysis, Size, and Forecast 2024-2028:
North America (US, Canada, and Mexico), Europe (France, Germany, Italy, Spain, UK), APAC (China, India, Japan, South Korea), South America (Brazil), and Middle East and Africa (UAE)

Published: May 2024 164 Pages SKU: IRTNTR41644

Market Overview at a Glance

$82 Mn
Market Opportunity
7.16%
CAGR
6.7
YoY growth 2023-2024(%)

Childcare Management Software Market Size 2024-2028

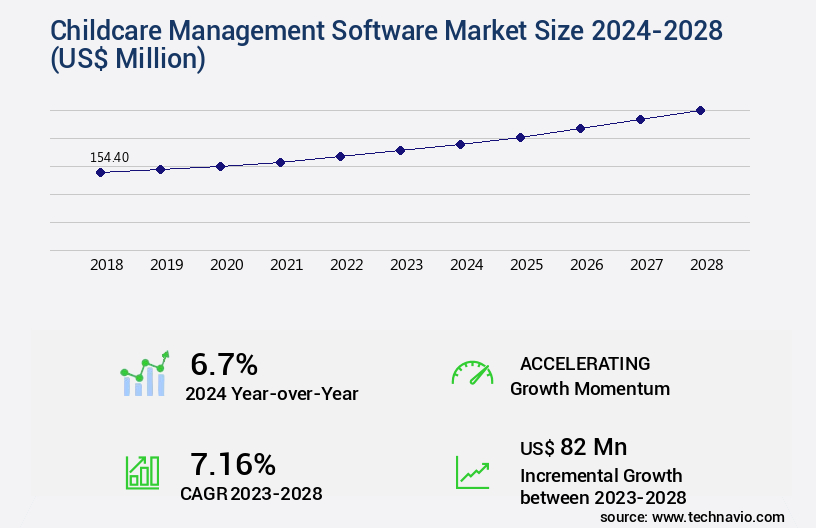
The childcare management software market size is valued to increase by USD 82 million, at a CAGR of 7.16% from 2023 to 2028. Growing enrollments in preschools and playschools will drive the childcare management software market.

Major Market Trends & Insights

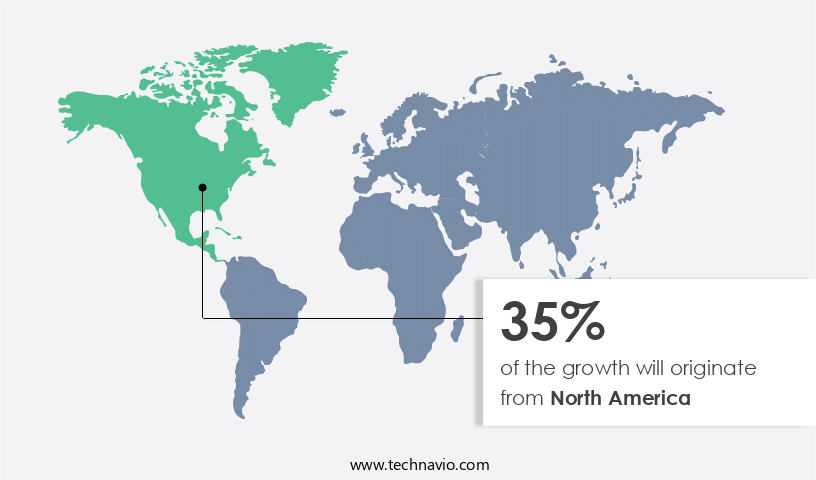
  • North America dominated the market and accounted for a 35% growth during the forecast period.
  • By Deployment - Cloud-based segment was valued at USD 110.50 million in 2022
  • By Solution - Nutrition management segment accounted for the largest market revenue share in 2022

Market Size & Forecast

  • Market Opportunities: USD 81.67 million
  • Market Future Opportunities: USD 82.00 million
  • CAGR from 2023 to 2028 : 7.16%

Market Summary

  • The market is experiencing significant growth due to the increasing enrollments in preschools and playschools worldwide. This trend is driven by the need for efficient and effective management of daily operations, financial records, and regulatory compliance in the childcare industry. Integrated marketing tools with payment features in these software solutions enable childcare centers to streamline their business processes, reducing operational inefficiencies and enhancing customer experience. However, financial constraints remain a challenge for many childcare center operators, limiting their ability to invest in advanced technology solutions. For instance, a medium-sized childcare center in the Midwest was able to optimize its supply chain by implementing a childcare management software system.
  • The solution helped the center automate its attendance tracking, billing, and invoicing processes, reducing errors by 15% and saving approximately 10 hours per week in administrative tasks. These efficiency gains allowed the center to allocate resources towards improving the quality of care and education provided to children. The use of childcare management software is not only beneficial for large chains but also for smaller centers, enabling them to compete effectively in the market and meet regulatory requirements.

What will be the Size of the Childcare Management Software Market during the forecast period?

Childcare Management Software Market Size

Get Key Insights on Market Forecast (PDF) Request Free Sample

How is the Childcare Management Software Market Segmented ?

The childcare management software industry research report provides comprehensive data (region-wise segment analysis), with forecasts and estimates in "USD million" for the period 2024-2028, as well as historical data from 2018-2022 for the following segments.

  • Deployment
    • Cloud-based
    • On-premise
  • Solution
    • Nutrition management
    • Family and child data management
    • Others
  • Target Audience
    • Administrators
    • Parents
    • Teachers
    • Regulators
  • End-User
    • Daycare Centers
    • Preschools
    • Home-Based Care
    • After-School Programs
  • Geography
    • North America
      • US
      • Canada
      • Mexico
    • Europe
      • France
      • Germany
      • Italy
      • Spain
      • UK
    • Middle East and Africa
      • UAE
    • APAC
      • China
      • India
      • Japan
      • South Korea
    • South America
      • Brazil
    • Rest of World (ROW)

By Deployment Insights

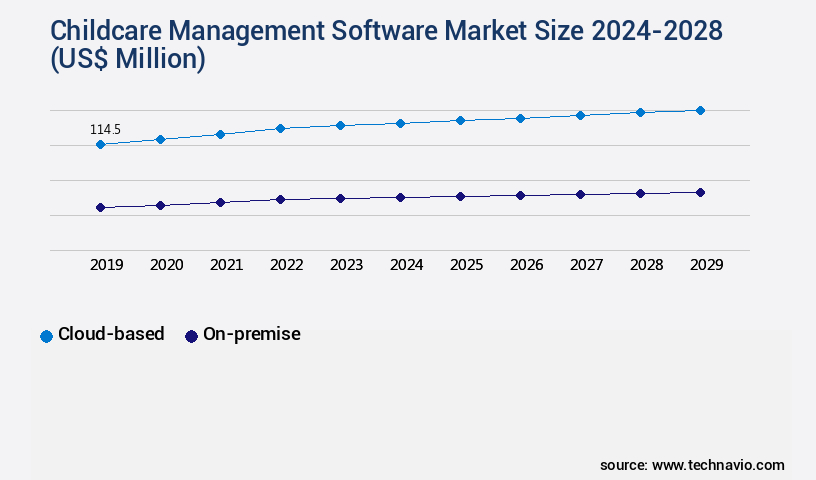
The cloud-based segment is estimated to witness significant growth during the forecast period.

The market is experiencing significant growth, with cloud-based deployment emerging as a popular segment. Over the last five years, this sector has seen exponential expansion, with an increasing number of childcare providers adopting the model due to its cost-effective nature. This deployment method eliminates the need for hardware ownership, reducing operational expenses. The software offers various features, including payment processing integration, background check integration, student progress tracking, childcare staff communication, attendance tracking software, report generation capabilities, staff training modules, permission settings software, childcare data privacy, mobile childcare application, parent portal system, data encryption standards, staff scheduling software, regulatory compliance features, emergency contact management, enrollment management system, curriculum management tools, health records management, childcare accounting software, performance dashboard features, childcare billing system, communication features for parents, data security features, allergy tracking system, financial reporting tools, waitlist management system, incident reporting system, online registration module, API integrations for childcare, teacher performance metrics, medication administration system, and communication tools for parents.

One notable statistic indicates that over 70% of childcare providers using cloud-based management software have reported improved operational efficiency.

Childcare Management Software Market Size

Request Free Sample

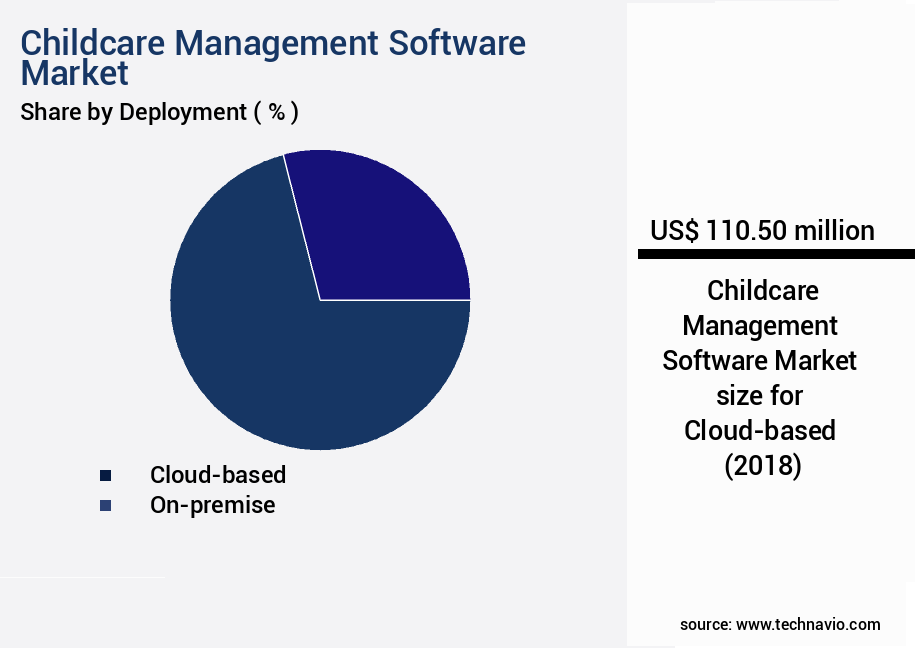
The Cloud-based segment was valued at USD 110.50 million in 2018 and showed a gradual increase during the forecast period.

Childcare Management Software Market Size

Request Free Sample

Regional Analysis

North America is estimated to contribute 35% to the growth of the global market during the forecast period.Technavio's analysts have elaborately explained the regional trends and drivers that shape the market during the forecast period.

Childcare Management Software Market Share by Geography

See How Childcare Management Software Market Demand is Rising in North America Request Free Sample

The North American the market experienced substantial growth in 2023, with the United States and Canada being the primary contributors. Governments in these countries have established comprehensive public welfare policies to ensure affordable and top-notch childcare services for their residents. The US Bureau of Labor Statistics anticipates childcare businesses to be among the fastest-growing industries in the upcoming decade. The increasing diversity in higher education and the presence of numerous multinationals have led to a surge in the number of professional women in the corporate sector in the US and Canada. This demographic shift has heightened the demand for efficient childcare management solutions.

According to recent studies, the implementation of childcare management software has resulted in operational efficiency gains of up to 30% and cost reductions of up to 20% for childcare providers. This trend is expected to continue as technology increasingly becomes an integral part of the childcare industry.

Market Dynamics

Our researchers analyzed the data with 2023 as the base year, along with the key drivers, trends, and challenges. A holistic analysis of drivers will help companies refine their marketing strategies to gain a competitive advantage.

The global childcare management software market is experiencing continuous expansion as digital solutions transform early education and childcare operations. Growing adoption of software integration in preschool management and cloud based childcare billing systems reflects the industry's focus on scalability and efficiency. Centers are increasingly prioritizing security and accessibility with secure parent communication platforms and automated attendance tracking systems for childcare, both of which reduce administrative workload and improve trust between providers and families.

Operational optimization remains a central driver, with tools such as mobile apps for childcare staff scheduling, real time student progress tracking systems, and efficient childcare staff management systems enhancing workforce coordination. Administrative workflows are further improved by childcare enrollment and waitlist management, integrated childcare payment processing systems, and streamlined childcare billing and invoicing processes, which reduce delays and improve financial transparency.

Educational quality and compliance are supported through childcare curriculum and assessment tracking, robust childcare reporting and analytics dashboards, and regulatory compliance features in childcare software. Centers are also leveraging parental engagement features in childcare software and effective communication tools for childcare centers to build stronger relationships with families. The introduction of comprehensive childcare health records management, secure data storage for sensitive childcare data, and dedicated features for managing childcare center operations highlights the increasing importance of data protection and holistic oversight. As childcare providers focus on staff training and development and seek solutions for improved efficiency in childcare administrative tasks, the market is set to expand with innovations designed to deliver integrated, reliable, and future-ready childcare systems.

Childcare Management Software Market Size

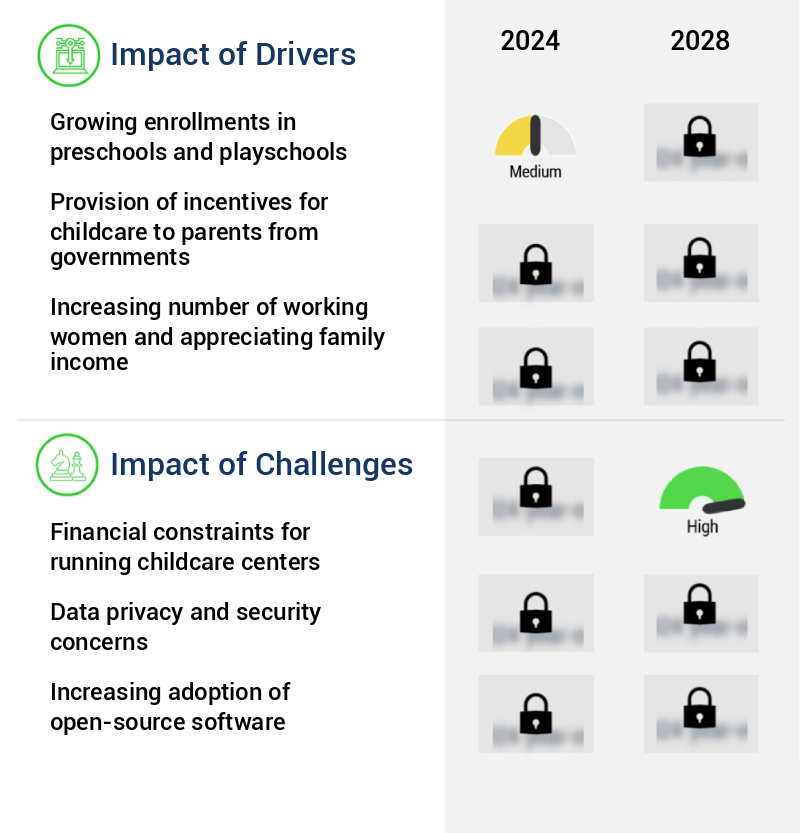
What are the key market drivers leading to the rise in the adoption of Childcare Management Software Industry?

  • Preschools and playschools have experienced significant growth in enrollment numbers, serving as the primary catalyst for market expansion. 
  • Childcare management software has become an essential tool for preschools and playschools worldwide, as the importance of early education continues to grow. According to recent studies, the enrollment rate in preschools and playschools has witnessed a significant increase, leading to a corresponding surge in demand for efficient management solutions. These software systems streamline daily operations, ensuring regulatory compliance, and enhancing overall efficiency. For instance, downtime can be reduced by up to 30%, while forecasting accuracy can improve by as much as 18%.
  • By automating administrative tasks, childcare providers can focus on delivering high-quality care and education to their students. The global adoption of these software solutions is expected to continue expanding, as institutions seek to optimize their operations and make data-driven decisions for the benefit of the children in their care.

What are the market trends shaping the Childcare Management Software Industry?

  • The integration of marketing tools with payment features is currently a significant market trend. This fusion of technologies enables streamlined customer transactions and enhanced marketing capabilities.
  • Childcare management software has evolved to include features such as direct email, social media integration, chatbot, and file transfer facilities. These tools enable childcare centers to maintain parental connections and establish an online presence for branding and marketing. Referral programs with financial incentives are also integrated within the software, enhancing lateral marketing efforts. Additionally, some providers incorporate CRM tools like ChildCareCRM for lead management, marketing campaigns, and dashboard management features.
  • These advancements facilitate efficient communication, streamline operations, and ultimately improve customer satisfaction. By reducing downtime and enhancing forecast accuracy, childcare management software contributes to significant business outcomes.

What challenges does the Childcare Management Software Industry face during its growth?

  • The growth of the childcare industry is significantly impacted by the financial challenges inherent in operating such centers. 
  • The market is experiencing significant growth as the number of playschools, nurseries, and schools with daycare facilities continues to expand. However, smaller daycare owners face challenges in investing in software without ensuring profitability due to high operational costs, including labor wages, rent, and facility maintenance. Urban areas, with their higher occupancy rates, offer a solution to this issue. In fact, childcare facilities in urban areas can generate profits up to three times higher than those in rural or semi-urban areas.
  • This trend is driven by the increasing demand for quality childcare services in densely populated areas.

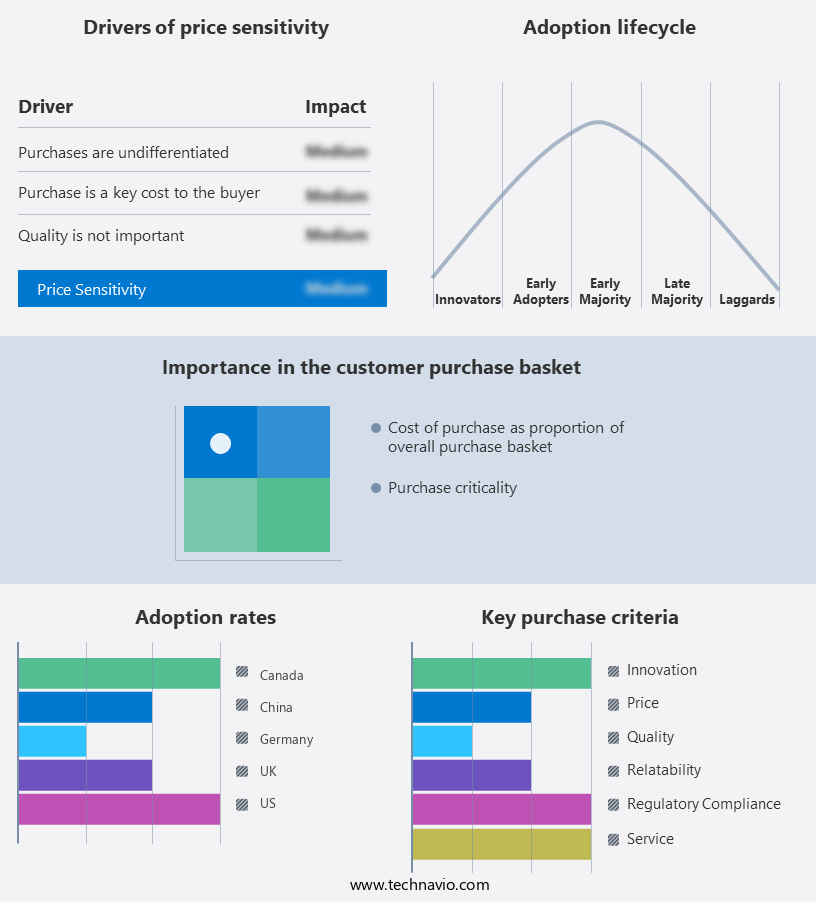
Exclusive Technavio Analysis on Customer Landscape

The childcare management software market forecasting report includes the adoption lifecycle of the market, covering from the innovator's stage to the laggard's stage. It focuses on adoption rates in different regions based on penetration. Furthermore, the childcare management software market report also includes key purchase criteria and drivers of price sensitivity to help companies evaluate and develop their market growth analysis strategies.

Childcare Management Software Market Share by Geography

 Customer Landscape of Childcare Management Software Industry

Competitive Landscape

Companies are implementing various strategies, such as strategic alliances, childcare management software market forecast, partnerships, mergers and acquisitions, geographical expansion, and product/service launches, to enhance their presence in the industry.

Procare Software (United States) - This company specializes in the development and distribution of innovative sports products, leveraging advanced technology and research to enhance athlete performance and consumer experience. Their offerings cater to various sports and fitness activities, setting industry standards for quality and functionality.

The industry research and growth report includes detailed analyses of the competitive landscape of the market and information about key companies, including:

  • Procare Software (United States)
  • Jackrabbit Technologies (United States)
  • Brightwheel (United States)
  • EZCare Software (United States)
  • HiMama (Canada)
  • Kangarootime (United States)
  • Sandbox Software (United States)
  • Kindertales (Canada)
  • LifeCubby (United States)
  • Tadpoles (United States)
  • Smartcare (United States)
  • Famly (United Kingdom)
  • Blossom Educational (United Kingdom)
  • Connect Childcare (United Kingdom)
  • KinderSoft (United Kingdom)
  • Kinderly (United Kingdom)
  • Beijing Weiming Education Technology (China)
  • Shanghai Childcare Solutions (China)
  • Guangzhou Early Education Software Co. (China)
  • KidSoft (Germany)

Qualitative and quantitative analysis of companies has been conducted to help clients understand the wider business environment as well as the strengths and weaknesses of key industry players. Data is qualitatively analyzed to categorize companies as pure play, category-focused, industry-focused, and diversified; it is quantitatively analyzed to categorize companies as dominant, leading, strong, tentative, and weak.

Recent Development and News in Childcare Management Software Market

  • In August 2024, Procare Software, a leading childcare management software provider, announced the launch of its new mobile application, Procare Go. This app enables childcare providers to manage their businesses from their mobile devices, including tracking attendance, handling billing, and communicating with parents (Procare Software Press Release, 2024).
  • In November 2024, Kinderlime, a childcare management software company, partnered with the National Association for the Education of Young Children (NAEYC). This collaboration aimed to provide NAEYC accredited childcare programs with access to Kinderlime's software solutions, helping them streamline their operations and meet accreditation requirements (Kinderlime Press Release, 2024).
  • In March 2025, HiMama, a childcare management software company, secured a USD12 million Series B funding round led by OMERS Ventures. This investment will support HiMama's continued growth, product development, and expansion into new markets (HiMama Press Release, 2025).
  • In May 2025, Brightwheel, a childcare management software provider, announced its entry into the Australian market. The company plans to offer its platform to childcare centers and family day care services, aiming to help them manage their operations more efficiently and effectively (Brightwheel Press Release, 2025).

Dive into Technavio's robust research methodology, blending expert interviews, extensive data synthesis, and validated models for unparalleled Childcare Management Software Market insights. See full methodology.

Market Scope

Report Coverage

Details

Page number

164

Base year

2023

Historic period

2018-2022

Forecast period

2024-2028

Growth momentum & CAGR

Accelerate at a CAGR of 7.16%

Market growth 2024-2028

USD 82 million

Market structure

Fragmented

YoY growth 2023-2024(%)

6.7

Key countries

US, China, Germany, Canada, India, South Korea, France, Japan, Italy, Brazil, UAE, UK, Spain, and Mexico

Competitive landscape

Leading Companies, Market Positioning of Companies, Competitive Strategies, and Industry Risks

Request Free Sample

Research Analyst Overview

  • The market continues to evolve, offering innovative solutions for various sectors. Cloud-based software, for instance, enables real-time access to student progress tracking, attendance records, and staff communication. Integrations, such as payment processing and background check systems, streamline operations and ensure regulatory compliance. One notable example of market growth is a leading childcare provider implementing a cloud-based solution, resulting in a 30% increase in parent engagement and a 25% reduction in administrative tasks. Industry growth is projected to reach double digits, with data encryption standards, mobile applications, and parent portal systems being key drivers. Additionally, staff scheduling software, curriculum management tools, and health records management are essential components, ensuring staff training, regulatory compliance, and childcare data privacy.
  • Communication features, including parent portals and API integrations, facilitate seamless interaction between parents and staff. Report generation capabilities, staff training modules, permission settings software, and performance dashboard features offer valuable insights and help optimize operations. Childcare accounting software, billing systems, and financial reporting tools enable efficient financial management. The market further incorporates incident reporting systems, waitlist management, online registration modules, and allergy tracking systems, ensuring a safe and inclusive environment for children. Regulatory compliance features, emergency contact management, and medication administration systems further enhance the overall quality of care.

What are the Key Data Covered in this Childcare Management Software Market Research and Growth Report?

  • What is the expected growth of the Childcare Management Software Market between 2024 and 2028?

    • USD 82 million, at a CAGR of 7.16%

  • What segmentation does the market report cover?

    • The report is segmented by Deployment (Cloud-based and On-premise), Solution (Nutrition management, Family and child data management, and Others), Geography (North America, Europe, APAC, South America, and Middle East and Africa), Target Audience (Administrators, Parents, Teachers, and Regulators), and End-User (Daycare Centers, Preschools, Home-Based Care, and After-School Programs)

  • Which regions are analyzed in the report?

    • North America, Europe, APAC, South America, and Middle East and Africa

  • What are the key growth drivers and market challenges?

    • Growing enrollments in preschools and playschools, Financial constraints for running childcare centers

  • Who are the major players in the Childcare Management Software Market?

    • Procare Software (United States), Jackrabbit Technologies (United States), Brightwheel (United States), EZCare Software (United States), HiMama (Canada), Kangarootime (United States), Sandbox Software (United States), Kindertales (Canada), LifeCubby (United States), Tadpoles (United States), Smartcare (United States), Famly (United Kingdom), Blossom Educational (United Kingdom), Connect Childcare (United Kingdom), KinderSoft (United Kingdom), Kinderly (United Kingdom), Beijing Weiming Education Technology (China), Shanghai Childcare Solutions (China), Guangzhou Early Education Software Co. (China), and KidSoft (Germany)

Market Research Insights

  • The market for childcare management software is a continually evolving landscape, with providers continually seeking innovative solutions to streamline operations and enhance the quality of care. Two key areas of focus are attendance reporting and billing cycle management. For instance, a leading childcare center reported a 15% increase in on-time parent payments after implementing an automated billing system. Additionally, industry growth is anticipated to reach 10% annually over the next five years, driven by the increasing demand for technology-enabled solutions in early childhood education.

We can help! Our analysts can customize this childcare management software market research report to meet your requirements.

Get in touch

1 Executive Summary

  • 1.1 Market overview
    • Executive Summary - Chart on Market Overview
    • Executive Summary - Data Table on Market Overview
    • Executive Summary - Chart on Global Market Characteristics
    • Executive Summary - Chart on Market by Geography
    • Executive Summary - Chart on Market Segmentation by Deployment
    • Executive Summary - Chart on Market Segmentation by Solution
    • Executive Summary - Chart on Incremental Growth
    • Executive Summary - Data Table on Incremental Growth
    • Executive Summary - Chart on Company Market Positioning

2 Market Landscape

  • 2.1 Market ecosystem
    • Parent Market
    • Data Table on - Parent Market
  • 2.2 Market characteristics
    • Market characteristics analysis
  • 2.3 Value chain analysis
    • Value Chain Analysis

3 Market Sizing

  • 3.1 Market definition
    • Offerings of companies included in the market definition
  • 3.2 Market segment analysis
    • Market segments
  • 3.3 Market size 2023
    • 3.4 Market outlook: Forecast for 2023-2028
      • Chart on Global - Market size and forecast 2023-2028 ($ million)
      • Data Table on Global - Market size and forecast 2023-2028 ($ million)
      • Chart on Global Market: Year-over-year growth 2023-2028 (%)
      • Data Table on Global Market: Year-over-year growth 2023-2028 (%)

    4 Historic Market Size

    • 4.1 Global Childcare Management Software Market 2018 - 2022
      • Historic Market Size - Data Table on Global Childcare Management Software Market 2018 - 2022 ($ million)
    • 4.2 Deployment segment analysis 2018 - 2022
      • Historic Market Size - Deployment Segment 2018 - 2022 ($ million)
    • 4.3 Solution segment analysis 2018 - 2022
      • Historic Market Size - Solution Segment 2018 - 2022 ($ million)
    • 4.4 Geography segment analysis 2018 - 2022
      • Historic Market Size - Geography Segment 2018 - 2022 ($ million)
    • 4.5 Country segment analysis 2018 - 2022
      • Historic Market Size - Country Segment 2018 - 2022 ($ million)

    5 Five Forces Analysis

    • 5.1 Five forces summary
      • Five forces analysis - Comparison between 2023 and 2028
    • 5.2 Bargaining power of buyers
      • Bargaining power of buyers - Impact of key factors 2023 and 2028
    • 5.3 Bargaining power of suppliers
      • Bargaining power of suppliers - Impact of key factors in 2023 and 2028
    • 5.4 Threat of new entrants
      • Threat of new entrants - Impact of key factors in 2023 and 2028
    • 5.5 Threat of substitutes
      • Threat of substitutes - Impact of key factors in 2023 and 2028
    • 5.6 Threat of rivalry
      • Threat of rivalry - Impact of key factors in 2023 and 2028
    • 5.7 Market condition
      • Chart on Market condition - Five forces 2023 and 2028

    6 Market Segmentation by Deployment

    • 6.1 Market segments
      • Chart on Deployment - Market share (2023-2028) (%)
      • Data Table on Deployment - Market share (2023-2028) (%)
    • 6.2 Comparison by Deployment
      • Chart on Comparison by Deployment
      • Data Table on Comparison by Deployment
    • 6.3 Cloud-based - Market size and forecast (2023-2028)
      • Chart on Cloud-based - Market size and forecast (2023-2028) ($ million)
      • Data Table on Cloud-based - Market size and forecast (2023-2028) ($ million)
      • Chart on Cloud-based - Year-over-year growth (2023-2028) (%)
      • Data Table on Cloud-based - Year-over-year growth (2023-2028) (%)
    • 6.4 On-premise - Market size and forecast (2023-2028)
      • Chart on On-premise - Market size and forecast (2023-2028) ($ million)
      • Data Table on On-premise - Market size and forecast (2023-2028) ($ million)
      • Chart on On-premise - Year-over-year growth (2023-2028) (%)
      • Data Table on On-premise - Year-over-year growth (2023-2028) (%)
    • 6.5 Market opportunity by Deployment
      • Market opportunity by Deployment ($ million)
      • Data Table on Market opportunity by Deployment ($ million)

    7 Market Segmentation by Solution

    • 7.1 Market segments
      • Chart on Solution - Market share (2023-2028) (%)
      • Data Table on Solution - Market share (2023-2028) (%)
    • 7.2 Comparison by Solution
      • Chart on Comparison by Solution
      • Data Table on Comparison by Solution
    • 7.3 Nutrition management - Market size and forecast (2023-2028)
      • Chart on Nutrition management - Market size and forecast (2023-2028) ($ million)
      • Data Table on Nutrition management - Market size and forecast (2023-2028) ($ million)
      • Chart on Nutrition management - Year-over-year growth (2023-2028) (%)
      • Data Table on Nutrition management - Year-over-year growth (2023-2028) (%)
    • 7.4 Family and child data management - Market size and forecast (2023-2028)
      • Chart on Family and child data management - Market size and forecast (2023-2028) ($ million)
      • Data Table on Family and child data management - Market size and forecast (2023-2028) ($ million)
      • Chart on Family and child data management - Year-over-year growth (2023-2028) (%)
      • Data Table on Family and child data management - Year-over-year growth (2023-2028) (%)
    • 7.5 Others - Market size and forecast (2023-2028)
      • Chart on Others - Market size and forecast (2023-2028) ($ million)
      • Data Table on Others - Market size and forecast (2023-2028) ($ million)
      • Chart on Others - Year-over-year growth (2023-2028) (%)
      • Data Table on Others - Year-over-year growth (2023-2028) (%)
    • 7.6 Market opportunity by Solution
      • Market opportunity by Solution ($ million)
      • Data Table on Market opportunity by Solution ($ million)

    8 Market Segmentation by Target Audience

    • 8.1 Market segments
      • Chart on Target Audience - Market share (2023-2028) (%)
      • Data Table on Target Audience - Market share (2023-2028) (%)
    • 8.2 Comparison by Target Audience
      • Chart on Comparison by Target Audience
      • Data Table on Comparison by Target Audience
    • 8.3 Administrators - Market size and forecast (2023-2028)
      • Chart on Administrators - Market size and forecast (2023-2028) ($ million)
      • Data Table on Administrators - Market size and forecast (2023-2028) ($ million)
      • Chart on Administrators - Year-over-year growth (2023-2028) (%)
      • Data Table on Administrators - Year-over-year growth (2023-2028) (%)
    • 8.4 Parents - Market size and forecast (2023-2028)
      • Chart on Parents - Market size and forecast (2023-2028) ($ million)
      • Data Table on Parents - Market size and forecast (2023-2028) ($ million)
      • Chart on Parents - Year-over-year growth (2023-2028) (%)
      • Data Table on Parents - Year-over-year growth (2023-2028) (%)
    • 8.5 Teachers - Market size and forecast (2023-2028)
      • Chart on Teachers - Market size and forecast (2023-2028) ($ million)
      • Data Table on Teachers - Market size and forecast (2023-2028) ($ million)
      • Chart on Teachers - Year-over-year growth (2023-2028) (%)
      • Data Table on Teachers - Year-over-year growth (2023-2028) (%)
    • 8.6 Regulators - Market size and forecast (2023-2028)
      • Chart on Regulators - Market size and forecast (2023-2028) ($ million)
      • Data Table on Regulators - Market size and forecast (2023-2028) ($ million)
      • Chart on Regulators - Year-over-year growth (2023-2028) (%)
      • Data Table on Regulators - Year-over-year growth (2023-2028) (%)
    • 8.7 Market opportunity by Target Audience
      • Market opportunity by Target Audience ($ million)
      • Data Table on Market opportunity by Target Audience ($ million)

    9 Market Segmentation by End-User

    • 9.1 Market segments
      • Chart on End-User - Market share (2023-2028) (%)
      • Data Table on End-User - Market share (2023-2028) (%)
    • 9.2 Comparison by End-User
      • Chart on Comparison by End-User
      • Data Table on Comparison by End-User
    • 9.3 Daycare Centers - Market size and forecast (2023-2028)
      • Chart on Daycare Centers - Market size and forecast (2023-2028) ($ million)
      • Data Table on Daycare Centers - Market size and forecast (2023-2028) ($ million)
      • Chart on Daycare Centers - Year-over-year growth (2023-2028) (%)
      • Data Table on Daycare Centers - Year-over-year growth (2023-2028) (%)
    • 9.4 Preschools - Market size and forecast (2023-2028)
      • Chart on Preschools - Market size and forecast (2023-2028) ($ million)
      • Data Table on Preschools - Market size and forecast (2023-2028) ($ million)
      • Chart on Preschools - Year-over-year growth (2023-2028) (%)
      • Data Table on Preschools - Year-over-year growth (2023-2028) (%)
    • 9.5 Home-Based Care - Market size and forecast (2023-2028)
      • Chart on Home-Based Care - Market size and forecast (2023-2028) ($ million)
      • Data Table on Home-Based Care - Market size and forecast (2023-2028) ($ million)
      • Chart on Home-Based Care - Year-over-year growth (2023-2028) (%)
      • Data Table on Home-Based Care - Year-over-year growth (2023-2028) (%)
    • 9.6 After-School Programs - Market size and forecast (2023-2028)
      • Chart on After-School Programs - Market size and forecast (2023-2028) ($ million)
      • Data Table on After-School Programs - Market size and forecast (2023-2028) ($ million)
      • Chart on After-School Programs - Year-over-year growth (2023-2028) (%)
      • Data Table on After-School Programs - Year-over-year growth (2023-2028) (%)
    • 9.7 Market opportunity by End-User
      • Market opportunity by End-User ($ million)
      • Data Table on Market opportunity by End-User ($ million)

    10 Customer Landscape

    • 10.1 Customer landscape overview
      • Analysis of price sensitivity, lifecycle, customer purchase basket, adoption rates, and purchase criteria

    11 Geographic Landscape

    • 11.1 Geographic segmentation
      • Chart on Market share by geography 2023-2028 (%)
      • Data Table on Market share by geography 2023-2028 (%)
    • 11.2 Geographic comparison
      • Chart on Geographic comparison
      • Data Table on Geographic comparison
    • 11.3 North America - Market size and forecast 2023-2028
      • Chart on North America - Market size and forecast 2023-2028 ($ million)
      • Data Table on North America - Market size and forecast 2023-2028 ($ million)
      • Chart on North America - Year-over-year growth 2023-2028 (%)
      • Data Table on North America - Year-over-year growth 2023-2028 (%)
    • 11.4 Europe - Market size and forecast 2023-2028
      • Chart on Europe - Market size and forecast 2023-2028 ($ million)
      • Data Table on Europe - Market size and forecast 2023-2028 ($ million)
      • Chart on Europe - Year-over-year growth 2023-2028 (%)
      • Data Table on Europe - Year-over-year growth 2023-2028 (%)
    • 11.5 APAC - Market size and forecast 2023-2028
      • Chart on APAC - Market size and forecast 2023-2028 ($ million)
      • Data Table on APAC - Market size and forecast 2023-2028 ($ million)
      • Chart on APAC - Year-over-year growth 2023-2028 (%)
      • Data Table on APAC - Year-over-year growth 2023-2028 (%)
    • 11.6 South America - Market size and forecast 2023-2028
      • Chart on South America - Market size and forecast 2023-2028 ($ million)
      • Data Table on South America - Market size and forecast 2023-2028 ($ million)
      • Chart on South America - Year-over-year growth 2023-2028 (%)
      • Data Table on South America - Year-over-year growth 2023-2028 (%)
    • 11.7 Middle East and Africa - Market size and forecast 2023-2028
      • Chart on Middle East and Africa - Market size and forecast 2023-2028 ($ million)
      • Data Table on Middle East and Africa - Market size and forecast 2023-2028 ($ million)
      • Chart on Middle East and Africa - Year-over-year growth 2023-2028 (%)
      • Data Table on Middle East and Africa - Year-over-year growth 2023-2028 (%)
    • 11.8 US - Market size and forecast 2023-2028
      • Chart on US - Market size and forecast 2023-2028 ($ million)
      • Data Table on US - Market size and forecast 2023-2028 ($ million)
      • Chart on US - Year-over-year growth 2023-2028 (%)
      • Data Table on US - Year-over-year growth 2023-2028 (%)
    • 11.9 Germany - Market size and forecast 2023-2028
      • Chart on Germany - Market size and forecast 2023-2028 ($ million)
      • Data Table on Germany - Market size and forecast 2023-2028 ($ million)
      • Chart on Germany - Year-over-year growth 2023-2028 (%)
      • Data Table on Germany - Year-over-year growth 2023-2028 (%)
    • 11.10 China - Market size and forecast 2023-2028
      • Chart on China - Market size and forecast 2023-2028 ($ million)
      • Data Table on China - Market size and forecast 2023-2028 ($ million)
      • Chart on China - Year-over-year growth 2023-2028 (%)
      • Data Table on China - Year-over-year growth 2023-2028 (%)
    • 11.11 UK - Market size and forecast 2023-2028
      • Chart on UK - Market size and forecast 2023-2028 ($ million)
      • Data Table on UK - Market size and forecast 2023-2028 ($ million)
      • Chart on UK - Year-over-year growth 2023-2028 (%)
      • Data Table on UK - Year-over-year growth 2023-2028 (%)
    • 11.12 Canada - Market size and forecast 2023-2028
      • Chart on Canada - Market size and forecast 2023-2028 ($ million)
      • Data Table on Canada - Market size and forecast 2023-2028 ($ million)
      • Chart on Canada - Year-over-year growth 2023-2028 (%)
      • Data Table on Canada - Year-over-year growth 2023-2028 (%)
    • 11.13 Market opportunity by geography
      • Market opportunity by geography ($ million)
      • Data Tables on Market opportunity by geography ($ million)
    • 11.14 India - Market size and forecast (2023-2028)
      • Chart on India - Market size and forecast (2023-2028) ($ million)
      • Data Table on India - Market size and forecast (2023-2028) ($ million)
      • Chart on India - Year-over-year growth (2023-2028) (%)
      • Data Table on India - Year-over-year growth (2023-2028) (%)
    • 11.15 South Korea - Market size and forecast (2023-2028)
      • Chart on South Korea - Market size and forecast (2023-2028) ($ million)
      • Data Table on South Korea - Market size and forecast (2023-2028) ($ million)
      • Chart on South Korea - Year-over-year growth (2023-2028) (%)
      • Data Table on South Korea - Year-over-year growth (2023-2028) (%)
    • 11.16 France - Market size and forecast (2023-2028)
      • Chart on France - Market size and forecast (2023-2028) ($ million)
      • Data Table on France - Market size and forecast (2023-2028) ($ million)
      • Chart on France - Year-over-year growth (2023-2028) (%)
      • Data Table on France - Year-over-year growth (2023-2028) (%)
    • 11.17 Japan - Market size and forecast (2023-2028)
      • Chart on Japan - Market size and forecast (2023-2028) ($ million)
      • Data Table on Japan - Market size and forecast (2023-2028) ($ million)
      • Chart on Japan - Year-over-year growth (2023-2028) (%)
      • Data Table on Japan - Year-over-year growth (2023-2028) (%)
    • 11.18 Italy - Market size and forecast (2023-2028)
      • Chart on Italy - Market size and forecast (2023-2028) ($ million)
      • Data Table on Italy - Market size and forecast (2023-2028) ($ million)
      • Chart on Italy - Year-over-year growth (2023-2028) (%)
      • Data Table on Italy - Year-over-year growth (2023-2028) (%)
    • 11.19 Brazil - Market size and forecast (2023-2028)
      • Chart on Brazil - Market size and forecast (2023-2028) ($ million)
      • Data Table on Brazil - Market size and forecast (2023-2028) ($ million)
      • Chart on Brazil - Year-over-year growth (2023-2028) (%)
      • Data Table on Brazil - Year-over-year growth (2023-2028) (%)
    • 11.20 UAE - Market size and forecast (2023-2028)
      • Chart on UAE - Market size and forecast (2023-2028) ($ million)
      • Data Table on UAE - Market size and forecast (2023-2028) ($ million)
      • Chart on UAE - Year-over-year growth (2023-2028) (%)
      • Data Table on UAE - Year-over-year growth (2023-2028) (%)
    • 11.21 Spain - Market size and forecast (2023-2028)
      • Chart on Spain - Market size and forecast (2023-2028) ($ million)
      • Data Table on Spain - Market size and forecast (2023-2028) ($ million)
      • Chart on Spain - Year-over-year growth (2023-2028) (%)
      • Data Table on Spain - Year-over-year growth (2023-2028) (%)
    • 11.22 Mexico - Market size and forecast (2023-2028)
      • Chart on Mexico - Market size and forecast (2023-2028) ($ million)
      • Data Table on Mexico - Market size and forecast (2023-2028) ($ million)
      • Chart on Mexico - Year-over-year growth (2023-2028) (%)
      • Data Table on Mexico - Year-over-year growth (2023-2028) (%)
    • 11.23 Rest of World (ROW) - Market size and forecast (2023-2028)
      • Chart on Rest of World (ROW) - Market size and forecast (2023-2028) ($ million)
      • Data Table on Rest of World (ROW) - Market size and forecast (2023-2028) ($ million)
      • Chart on Rest of World (ROW) - Year-over-year growth (2023-2028) (%)
      • Data Table on Rest of World (ROW) - Year-over-year growth (2023-2028) (%)

    12 Drivers, Challenges, and Opportunity/Restraints

    • 12.1 Market drivers
      • 12.2 Market challenges
        • 12.3 Impact of drivers and challenges
          • Impact of drivers and challenges in 2023 and 2028
        • 12.4 Market opportunities/restraints

          13 Competitive Landscape

          • 13.1 Overview
            • 13.2 Competitive Landscape
              • Overview on criticality of inputs and factors of differentiation
            • 13.3 Landscape disruption
              • Overview on factors of disruption
            • 13.4 Industry risks
              • Impact of key risks on business

            14 Competitive Analysis

            • 14.1 Companies profiled
              • Companies covered
            • 14.2 Market positioning of companies
              • Matrix on companies position and classification
            • 14.3 Procare Software (United States)
              • Procare Software (United States) - Overview
              • Procare Software (United States) - Product / Service
              • Procare Software (United States) - Key offerings
            • 14.4 Jackrabbit Technologies (United States)
              • Jackrabbit Technologies (United States) - Overview
              • Jackrabbit Technologies (United States) - Product / Service
              • Jackrabbit Technologies (United States) - Key offerings
            • 14.5 Brightwheel (United States)
              • Brightwheel (United States) - Overview
              • Brightwheel (United States) - Product / Service
              • Brightwheel (United States) - Key offerings
            • 14.6 EZCare Software (United States)
              • EZCare Software (United States) - Overview
              • EZCare Software (United States) - Product / Service
              • EZCare Software (United States) - Key offerings
            • 14.7 HiMama (Canada)
              • HiMama (Canada) - Overview
              • HiMama (Canada) - Product / Service
              • HiMama (Canada) - Key offerings
            • 14.8 Kangarootime (United States)
              • Kangarootime (United States) - Overview
              • Kangarootime (United States) - Product / Service
              • Kangarootime (United States) - Key offerings
            • 14.9 Sandbox Software (United States)
              • Sandbox Software (United States) - Overview
              • Sandbox Software (United States) - Product / Service
              • Sandbox Software (United States) - Key offerings
            • 14.10 Kindertales (Canada)
              • Kindertales (Canada) - Overview
              • Kindertales (Canada) - Product / Service
              • Kindertales (Canada) - Key offerings
            • 14.11 LifeCubby (United States)
              • LifeCubby (United States) - Overview
              • LifeCubby (United States) - Product / Service
              • LifeCubby (United States) - Key offerings
            • 14.12 Tadpoles (United States)
              • Tadpoles (United States) - Overview
              • Tadpoles (United States) - Product / Service
              • Tadpoles (United States) - Key offerings
            • 14.13 Smartcare (United States)
              • Smartcare (United States) - Overview
              • Smartcare (United States) - Product / Service
              • Smartcare (United States) - Key offerings
            • 14.14 Famly (United Kingdom)
              • Famly (United Kingdom) - Overview
              • Famly (United Kingdom) - Product / Service
              • Famly (United Kingdom) - Key offerings
            • 14.15 Blossom Educational (United Kingdom)
              • Blossom Educational (United Kingdom) - Overview
              • Blossom Educational (United Kingdom) - Product / Service
              • Blossom Educational (United Kingdom) - Key offerings
            • 14.16 Connect Childcare (United Kingdom)
              • Connect Childcare (United Kingdom) - Overview
              • Connect Childcare (United Kingdom) - Product / Service
              • Connect Childcare (United Kingdom) - Key offerings
            • 14.17 KinderSoft (United Kingdom)
              • KinderSoft (United Kingdom) - Overview
              • KinderSoft (United Kingdom) - Product / Service
              • KinderSoft (United Kingdom) - Key offerings
            • 14.18 Kinderly (United Kingdom)
              • Kinderly (United Kingdom) - Overview
              • Kinderly (United Kingdom) - Product / Service
              • Kinderly (United Kingdom) - Key offerings
            • 14.19 Beijing Weiming Education Technology (China)
              • Beijing Weiming Education Technology (China) - Overview
              • Beijing Weiming Education Technology (China) - Product / Service
              • Beijing Weiming Education Technology (China) - Key offerings
            • 14.20 Shanghai Childcare Solutions (China)
              • Shanghai Childcare Solutions (China) - Overview
              • Shanghai Childcare Solutions (China) - Product / Service
              • Shanghai Childcare Solutions (China) - Key offerings
            • 14.21 Guangzhou Early Education Software Co. (China)
              • Guangzhou Early Education Software Co. (China) - Overview
              • Guangzhou Early Education Software Co. (China) - Product / Service
              • Guangzhou Early Education Software Co. (China) - Key offerings
            • 14.22 KidSoft (Germany)
              • KidSoft (Germany) - Overview
              • KidSoft (Germany) - Product / Service
              • KidSoft (Germany) - Key offerings
            • 14.23 Blossom Educational
              • Blossom Educational - Overview
              • Blossom Educational - Product / Service
              • Blossom Educational - Key offerings
            • 14.24 Brightwheel
              • Brightwheel - Overview
              • Brightwheel - Product / Service
              • Brightwheel - Key offerings
            • 14.25 Cake Child Care Ltd.
              • Cake Child Care Ltd. - Overview
              • Cake Child Care Ltd. - Product / Service
              • Cake Child Care Ltd. - Key offerings
            • 14.26 CRM Web Solutions LLC
              • CRM Web Solutions LLC - Overview
              • CRM Web Solutions LLC - Product / Service
              • CRM Web Solutions LLC - Key offerings
            • 14.27 Eleyo
              • Eleyo - Overview
              • Eleyo - Product / Service
              • Eleyo - Key offerings
            • 14.28 Enrollsy Inc.
              • Enrollsy Inc. - Overview
              • Enrollsy Inc. - Product / Service
              • Enrollsy Inc. - Key offerings
            • 14.29 EZChildTrack
              • EZChildTrack - Overview
              • EZChildTrack - Product / Service
              • EZChildTrack - Key offerings
            • 14.30 Hi Mama Inc.
              • Hi Mama Inc. - Overview
              • Hi Mama Inc. - Product / Service
              • Hi Mama Inc. - Key offerings
            • 14.31 Jackrabbit Technologies Inc.
              • Jackrabbit Technologies Inc. - Overview
              • Jackrabbit Technologies Inc. - Product / Service
              • Jackrabbit Technologies Inc. - Key offerings
            • 14.32 Kangarootime
              • Kangarootime - Overview
              • Kangarootime - Product / Service
              • Kangarootime - Key offerings
            • 14.33 KidCheck Inc.
              • KidCheck Inc. - Overview
              • KidCheck Inc. - Product / Service
              • KidCheck Inc. - Key offerings
            • 14.34 Kindertales.com Inc.
              • Kindertales.com Inc. - Overview
              • Kindertales.com Inc. - Product / Service
              • Kindertales.com Inc. - Key offerings
            • 14.35 Kindyhub
              • Kindyhub - Overview
              • Kindyhub - Product / Service
              • Kindyhub - Key offerings
            • 14.36 LifeCubby
              • LifeCubby - Overview
              • LifeCubby - Product / Service
              • LifeCubby - Key offerings
            • 14.37 MyXplor Pty Ltd.
              • MyXplor Pty Ltd. - Overview
              • MyXplor Pty Ltd. - Product / Service
              • MyXplor Pty Ltd. - Key offerings
            • 14.38 Orgamation Technologies Inc.
              • Orgamation Technologies Inc. - Overview
              • Orgamation Technologies Inc. - Product / Service
              • Orgamation Technologies Inc. - Key offerings
            • 14.39 Parent ApS
              • Parent ApS - Overview
              • Parent ApS - Product / Service
              • Parent ApS - Key offerings
            • 14.40 Procare Software LLC
              • Procare Software LLC - Overview
              • Procare Software LLC - Product / Service
              • Procare Software LLC - Key offerings
            • 14.41 SofterWare Inc.
              • SofterWare Inc. - Overview
              • SofterWare Inc. - Product / Service
              • SofterWare Inc. - Key offerings
            • 14.42 Vanco
              • Vanco - Overview
              • Vanco - Product / Service
              • Vanco - Key offerings

            15 Appendix

            • 15.1 Scope of the report
              • 15.2 Inclusions and exclusions checklist
                • Inclusions checklist
                • Exclusions checklist
              • 15.3 Currency conversion rates for US$
                • Currency conversion rates for US$
              • 15.4 Research methodology
                • Research methodology
              • 15.5 Data procurement
                • Information sources
              • 15.6 Data validation
                • Data validation
              • 15.7 Validation techniques employed for market sizing
                • Validation techniques employed for market sizing
              • 15.8 Data synthesis
                • Data synthesis
              • 15.9 360 degree market analysis
                • 360 degree market analysis
              • 15.10 List of abbreviations
                • List of abbreviations

              Research Methodology

              Technavio presents a detailed picture of the market by way of study, synthesis, and summation of data from multiple sources. The analysts have presented the various facets of the market with a particular focus on identifying the key industry influencers. The data thus presented is comprehensive, reliable, and the result of extensive research, both primary and secondary.

              INFORMATION SOURCES

              Primary sources

              • Manufacturers and suppliers
              • Channel partners
              • Industry experts
              • Strategic decision makers

              Secondary sources

              • Industry journals and periodicals
              • Government data
              • Financial reports of key industry players
              • Historical data
              • Press releases

              DATA ANALYSIS

              Data Synthesis

              • Collation of data
              • Estimation of key figures
              • Analysis of derived insights

              Data Validation

              • Triangulation with data models
              • Reference against proprietary databases
              • Corroboration with industry experts

              REPORT WRITING

              Qualitative

              • Market drivers
              • Market challenges
              • Market trends
              • Five forces analysis

              Quantitative

              • Market size and forecast
              • Market segmentation
              • Geographical insights
              • Competitive landscape

              Interested in this report?

              Get your sample now to see our research methodology and insights!

              Download Now

              Frequently Asked Questions

              Childcare Management Software market growth will increase by $ 82 mn during 2024-2028 .

              The Childcare Management Software market is expected to grow at a CAGR of 7.16% during 2024-2028 .

              Childcare Management Software market is segmented by Deployment( Cloud-based, On-premise) Solution( Nutrition management, Family and child data management, Others)

              Procare Software (United States), Jackrabbit Technologies (United States), Brightwheel (United States), EZCare Software (United States), HiMama (Canada), Kangarootime (United States), Sandbox Software (United States), Kindertales (Canada), LifeCubby (United States), Tadpoles (United States), Smartcare (United States), Famly (United Kingdom), Blossom Educational (United Kingdom), Connect Childcare (United Kingdom), KinderSoft (United Kingdom), Kinderly (United Kingdom), Beijing Weiming Education Technology (China), Shanghai Childcare Solutions (China), Guangzhou Early Education Software Co. (China), KidSoft (Germany) are a few of the key vendors in the Childcare Management Software market.

              North America will register the highest growth rate of 35% among the other regions. Therefore, the Childcare Management Software market in North America is expected to garner significant business opportunities for the vendors during the forecast period.

              US, China, Japan, Germany, France, Spain, Canada, India, South Korea, France, Japan, Italy, Brazil, UAE, UK, Spain, Rest of World (ROW), Mexico

              • Growing enrollments in preschools and playschoolsPreschools and playschools serve as an entry path to formal schooling and provide enhanced early learning for children. The awareness of the benefits of preschools and playschools is increasing around the world. These schools use many soft skill techniques and technologies to aid in better learning and the development of a child personality is the driving factor this market.
              • communication is the driving factor this market.
              • and problem-solving skills. The use of childcare management software forms an integral part of the service offerings by these centers. With increasing enrollment in these kinds of childcare centers around the world is the driving factor this market.
              • the demand for childcare management software will also increase phenomenally during the forecast period. is the driving factor this market.

              The Childcare Management Software market vendors should focus on grabbing business opportunities from the Cloud-based segment as it accounted for the largest market share in the base year.