Clinical Trial Decentralization Platforms Market Analysis, Size, and Forecast 2026-2030: North America (US, Canada, and Mexico), Europe (Germany, UK, and France), APAC (China, India, and Japan), South America (Brazil, Argentina, and Colombia), Middle East and Africa (South Africa, Israel, and Saudi Arabia), and Rest of World (ROW)

Clinical Trial Decentralization Platforms Market Analysis, Size, and Forecast 2026-2030:
North America (US, Canada, and Mexico), Europe (Germany, UK, and France), APAC (China, India, and Japan), South America (Brazil, Argentina, and Colombia), Middle East and Africa (South Africa, Israel, and Saudi Arabia), and Rest of World (ROW)

Published: Mar 2026 293 Pages SKU: IRTNTR81299

Market Overview at a Glance

$8.03 B
Market Opportunity
14.4%
CAGR 2025 - 2030
37.3%
North America Growth
$4.38 B
Software segment 2024

Clinical Trial Decentralization Platforms Market Size 2026-2030

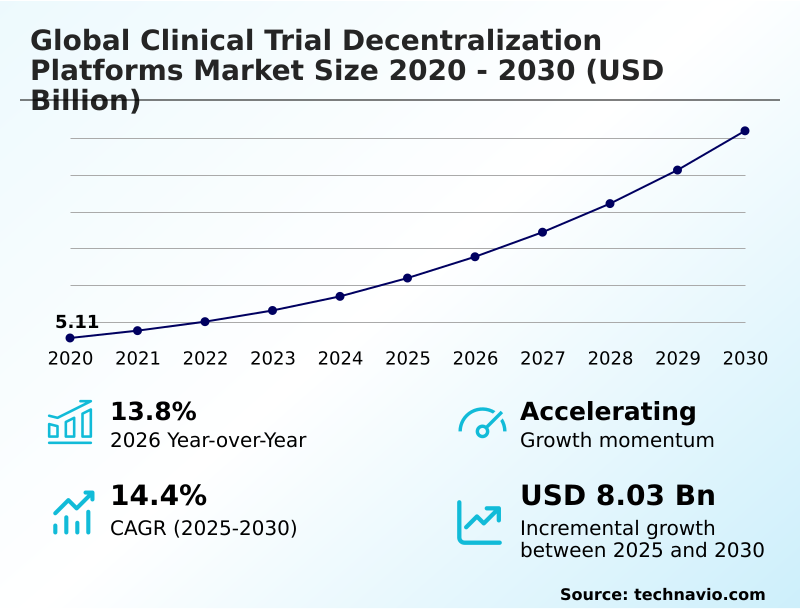
The clinical trial decentralization platforms market size is valued to increase by USD 8.03 billion, at a CAGR of 14.4% from 2025 to 2030. Enhancing patient accessibility and diversity through decentralized frameworks will drive the clinical trial decentralization platforms market.

Major Market Trends & Insights

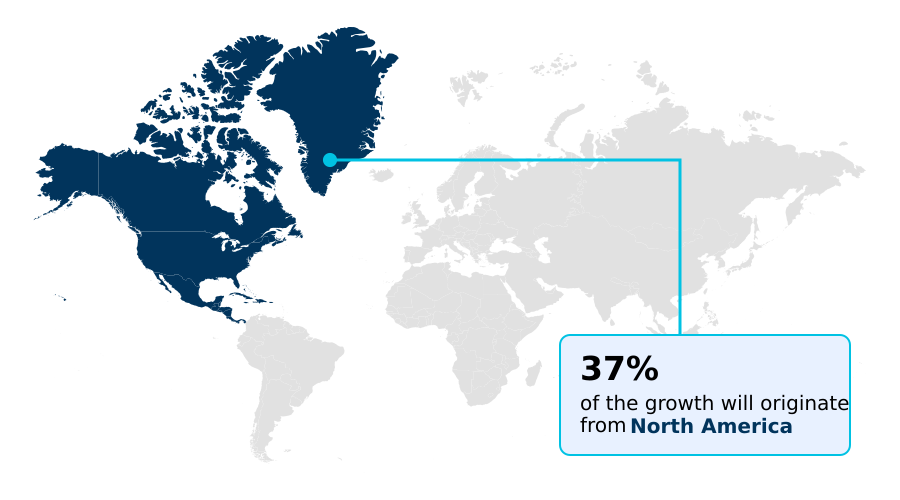
  • North America dominated the market and accounted for a 37.3% growth during the forecast period.
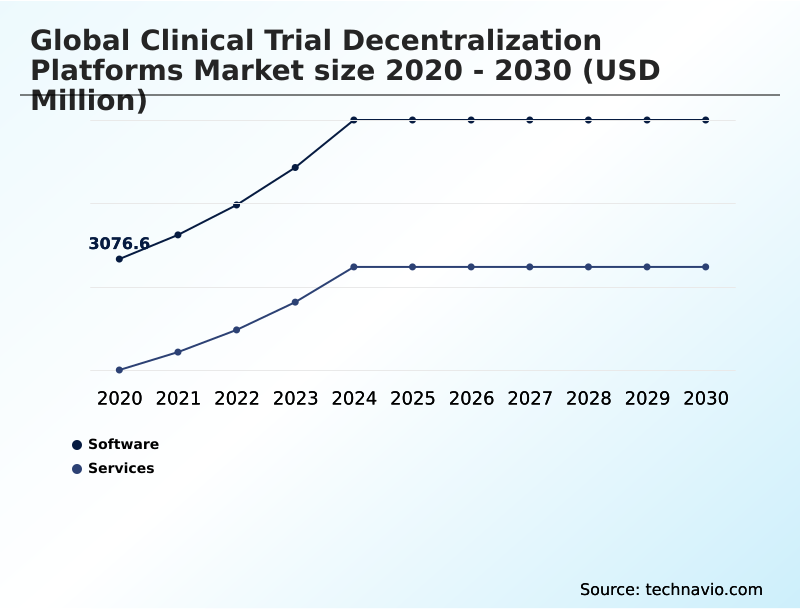
  • By Component - Software segment was valued at USD 4.38 billion in 2024
  • By End-user - Pharmaceutical companies segment accounted for the largest market revenue share in 2024

Market Size & Forecast

  • Market Opportunities: USD 11.30 billion
  • Market Future Opportunities: USD 8.03 billion
  • CAGR from 2025 to 2030 : 14.4%

Market Summary

  • The clinical trial decentralization platforms market is fundamentally reshaping pharmaceutical R&D by prioritizing patient-centric trial design and operational efficiency. This shift is enabled by a suite of digital tools, including eConsent platforms for remote consenting processes and mobile health (mHealth) applications for real-world evidence (RWE) collection.
  • By leveraging remote patient monitoring (RPM) and wearable sensor data, sponsors can implement continuous data collection, which is vital for digital biomarker validation and remote safety monitoring. For instance, a mid-sized biotech firm can now execute a complex, multi-national rare disease study using virtual trial platforms, thereby improving patient retention rates without the substantial capital investment required for physical sites.
  • This model relies on robust decentralized data management and electronic data capture (EDC) systems to ensure data integrity. The evolution toward hybrid clinical trial models, which blend remote activities with necessary in-person visits, addresses the logistical challenges of direct-to-patient (DTP) supply chains and ensures comprehensive protocol adherence monitoring, ultimately accelerating the delivery of new therapies.

What will be the Size of the Clinical Trial Decentralization Platforms Market during the forecast period?

Get Key Insights on Market Forecast (PDF) Request Free Sample

How is the Clinical Trial Decentralization Platforms Market Segmented?

The clinical trial decentralization platforms industry research report provides comprehensive data (region-wise segment analysis), with forecasts and estimates in "USD million" for the period 2026-2030, as well as historical data from 2020-2024 for the following segments.

  • Component
    • Software
    • Services
  • End-user
    • Pharmaceutical companies
    • Contract research organizations
    • Biotechnology companies
    • Academic and research institutes
  • Deployment
    • Cloud based platforms
    • Hybrid deployment
    • On premises solutions
  • Geography
    • North America
      • US
      • Canada
      • Mexico
    • Europe
      • Germany
      • UK
      • France
    • APAC
      • China
      • India
      • Japan
    • South America
      • Brazil
      • Argentina
      • Colombia
    • Middle East and Africa
      • South Africa
      • Israel
      • Saudi Arabia
    • Rest of World (ROW)

By Component Insights

The software segment is estimated to witness significant growth during the forecast period.

The software segment is central to enabling a patient-centric trial design that prioritizes patient accessibility improvement and participant diversity enhancement. Core to this are eConsent platforms and robust telehealth integration, which facilitate remote interactions while reducing participant burden.

Advanced electronic clinical outcome assessment (eCOA) solutions are crucial for continuous data collection, capturing everything from subjective feedback to objective wearable sensor data. The infrastructure supports extensive real-world evidence (RWE) collection and enables sophisticated digital biomarker validation.

These platforms improve data quality, with some achieving a 15% reduction in data entry errors compared to manual methods. This digital framework increasingly positions clinical research-as-a-care-option, capturing real-time physiological data to advance therapeutic development.

Request Free Sample

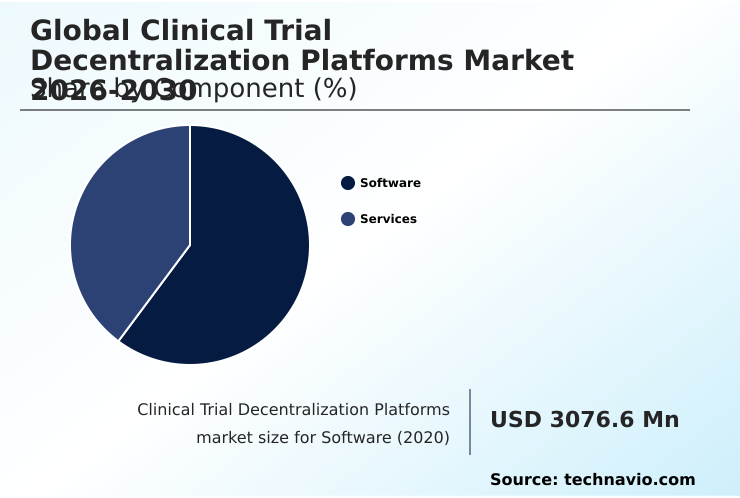
The Software segment was valued at USD 4.38 billion in 2024 and showed a gradual increase during the forecast period.

Request Free Sample

Regional Analysis

North America is estimated to contribute 37.3% to the growth of the global market during the forecast period.Technavio’s analysts have elaborately explained the regional trends and drivers that shape the market during the forecast period.

See How Clinical Trial Decentralization Platforms Market Demand is Rising in North America Request Free Sample

The geographic landscape is led by North America, where a mature regulatory environment supports the use of advanced digital endpoint measurement and patient-facing technology.

This region serves as a primary market for integrated data platforms that facilitate complex remote trial orchestration and clinical operations automation. Meanwhile, the APAC region is the fastest-growing market, driven by the adoption of study-at-home models and virtual care integration.

The implementation of site-less clinical trials in this region has shown to reduce administrative overhead by up to 35%. Across all regions, a focus on risk-based quality management (RBQM) and comprehensive remote monitoring oversight is standard.

The use of telehealth-enabled trials and remote diagnostics is becoming universal, with platforms demonstrating a 20% improvement in data consistency across geographically dispersed participant groups.

Market Dynamics

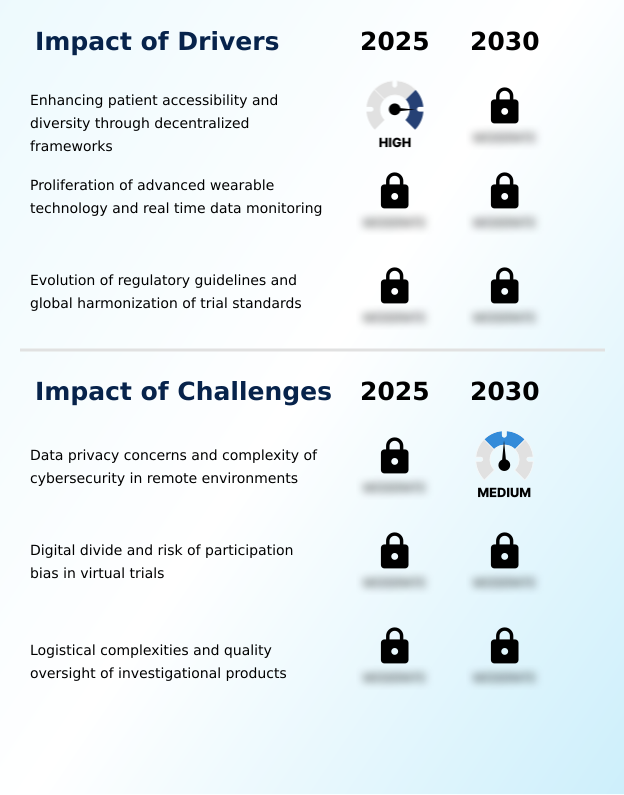
Our researchers analyzed the data with 2025 as the base year, along with the key drivers, trends, and challenges. A holistic analysis of drivers will help companies refine their marketing strategies to gain a competitive advantage.

  • Strategic implementation of decentralized clinical trial platforms is becoming a competitive differentiator. The technology for remote patient reported outcomes is a cornerstone, particularly when combined with effective eCOA and ePRO integration strategies to capture high-quality data.
  • In specialized fields, a decentralized clinical trial platform for oncology allows researchers to reach vulnerable populations, while the use of wearable sensor data for cardiovascular trials provides continuous physiological insights. Success depends on mastering operational complexities, including establishing best practices for direct-to-patient logistics and managing the investigational product in at-home trials.
  • Firms must address the challenges of data privacy in BYOD trials and ensure regulatory compliance for digital biomarkers. The adoption of hybrid trial models for rare disease studies and the use of real-world evidence collection using mHealth apps are becoming standard. Key initiatives focus on improving patient retention with digital engagement tools and integrating telehealth into clinical trial protocols.
  • Organizations performing a cost-benefit analysis of decentralized clinical trials find that integrated platforms can double data query resolution speed compared to siloed systems. Efficiently scaling virtual trials across different regions requires robust AI-powered patient recruitment for decentralized trials, diligent remote safety monitoring and adverse event reporting, and a sophisticated platform for remote monitoring of vital signs.
  • Ultimately, success hinges on seamless data harmonization for multi-source EDC and effective clinical supply chain management for remote sites.

What are the key market drivers leading to the rise in the adoption of Clinical Trial Decentralization Platforms Industry?

  • A key market driver is the enhancement of patient accessibility and diversity, which is achieved through the adoption of decentralized frameworks.

  • Market growth is significantly driven by the imperative for global trial scalability and the need to generate robust regulatory submission data.
  • The use of advanced patient recruitment algorithms has been shown to increase participant enrollment by over 30% in targeted populations.
  • Platforms offering a seamless remote consenting process via digital informed consent are critical for improving the patient journey mapping from the outset. This digital-first approach enhances clinical data interoperability between systems.
  • Mobile health (mHealth) applications are central to this paradigm, enabling remote safety monitoring and serving as a primary patient engagement platform. This facilitates better management of trial participation logistics.
  • The integration of real-time data analytics into the clinical trial management system (CTMS) allows for continuous oversight and faster decision-making, which is essential for decentralized data management.

What are the market trends shaping the Clinical Trial Decentralization Platforms Industry?

  • The integration of AI is emerging as a significant trend, aiming to enhance patient recruitment and improve retention rates in clinical trials.

  • Key market trends are converging around the adoption of hybrid clinical trial models and fully virtual trial platforms, which rely on sophisticated electronic data capture (EDC) systems. These platforms facilitate seamless data harmonization protocols, which are essential for integrating information from disparate sources and enabling remote data verification.
  • The implementation of these models has led to a 25% reduction in data cleaning timelines. Furthermore, advancements in direct-to-patient (DTP) logistics and investigational medicinal product (IMP) tracking technology are streamlining the clinical supply chain. This focus on decentralized study conduct improves patient-reported data integrity and protocol adherence monitoring.
  • As a result, organizations are achieving greater operational efficiency through remote site management and virtual investigator meetings, with eSource data capture reducing source data verification needs by up to 40%.

What challenges does the Clinical Trial Decentralization Platforms Industry face during its growth?

  • A key challenge affecting industry growth involves data privacy concerns and the complexities of ensuring robust cybersecurity in remote trial environments.

  • A primary challenge in the market is ensuring data security in remote trials, particularly with the rise of Bring Your Own Device (BYOD) strategy. Implementing robust data privacy encryption on cloud-based clinical platforms is non-negotiable to protect electronic patient-reported outcomes (ePRO) and maintain the electronic trial master file (eTMF).
  • The logistical complexities of clinical supply chain management for site-less clinical trials introduce risks that require advanced remote monitoring solutions. Moreover, ensuring successful digital health technology adoption requires comprehensive remote training and support, as poor usability can negatively impact patient-reported data integrity and efforts at improving patient retention rates.
  • In fact, studies indicate that trials with inadequate connected device integration see a 20% higher participant drop-off rate compared to those with seamless tech support.

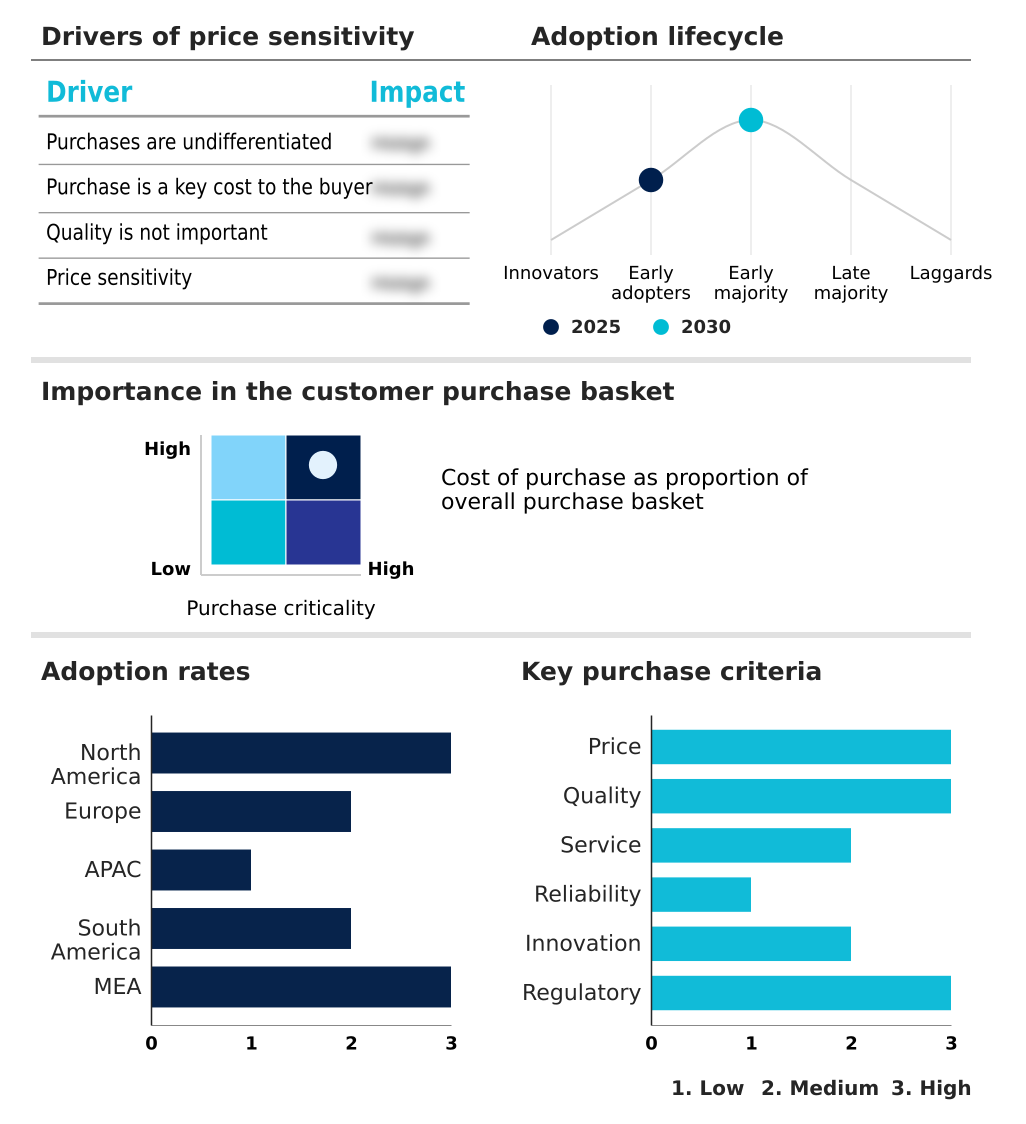
Exclusive Technavio Analysis on Customer Landscape

The clinical trial decentralization platforms market forecasting report includes the adoption lifecycle of the market, covering from the innovator’s stage to the laggard’s stage. It focuses on adoption rates in different regions based on penetration. Furthermore, the clinical trial decentralization platforms market report also includes key purchase criteria and drivers of price sensitivity to help companies evaluate and develop their market growth analysis strategies.

Customer Landscape of Clinical Trial Decentralization Platforms Industry

Competitive Landscape

Companies are implementing various strategies, such as strategic alliances, clinical trial decentralization platforms market forecast, partnerships, mergers and acquisitions, geographical expansion, and product/service launches, to enhance their presence in the industry.

Advarra Inc. - Modular software platforms are scaling remote and hybrid trials by prioritizing mobile-first patient interfaces for enhanced data collection and participant accessibility.

The industry research and growth report includes detailed analyses of the competitive landscape of the market and information about key companies, including:

  • Advarra Inc.
  • Castor Research Inc.
  • Clinical Ink Inc.
  • Crucial Data Solutions Inc.
  • Florence Healthcare.
  • ICON plc
  • IQVIA Holdings Inc.
  • KAYENTIS SAS
  • Laboratory Corp.
  • Lightship
  • Medable Inc.
  • Medidata
  • Obvio Health USA Inc.
  • Parexel International Corp.
  • Reify Health
  • Science 37 Inc.
  • Signant Health
  • Thermo Fisher Scientific Inc.
  • Veeva Systems Inc.
  • YPrime LLC

Qualitative and quantitative analysis of companies has been conducted to help clients understand the wider business environment as well as the strengths and weaknesses of key industry players. Data is qualitatively analyzed to categorize companies as pure play, category-focused, industry-focused, and diversified; it is quantitatively analyzed to categorize companies as dominant, leading, strong, tentative, and weak.

Recent Development and News in Clinical trial decentralization platforms market

  • In September 2024, Medable announced the launch of Agent Studio, an AI platform designed to enable life sciences companies to implement agentic AI in their clinical operations.
  • In December 2024, AlphaTON Capital Corp. announced plans to introduce a decentralized, AI-driven biotech platform focusing initially on rare and immunocompromised cancers.
  • In March 2025, the European Medicines Agency launched a new digital toolkit designed to assist trial sponsors in navigating the regulatory requirements for decentralized data collection across member states.
  • In April 2025, a consortium of major pharmaceutical companies and software developers finalized a new universal data standard for decentralized platforms, ensuring compatibility between remote monitoring sensors and clinical databases.

Dive into Technavio’s robust research methodology, blending expert interviews, extensive data synthesis, and validated models for unparalleled Clinical Trial Decentralization Platforms Market insights. See full methodology.

Market Scope
Page number 293
Base year 2025
Historic period 2020-2024
Forecast period 2026-2030
Growth momentum & CAGR Accelerate at a CAGR of 14.4%
Market growth 2026-2030 USD 8026.0 million
Market structure Fragmented
YoY growth 2025-2026(%) 13.8%
Key countries US, Canada, Mexico, Germany, UK, France, Italy, The Netherlands, Spain, China, India, Japan, Australia, South Korea, Indonesia, Brazil, Argentina, Colombia, South Africa, Israel, Saudi Arabia, UAE and Turkey
Competitive landscape Leading Companies, Market Positioning of Companies, Competitive Strategies, and Industry Risks

Request Free Sample

Research Analyst Overview

  • The market's evolution is defined by the convergence of sophisticated software and patient-centric services. An integrated technology stack, including eConsent platforms, remote patient monitoring (RPM), and electronic clinical outcome assessment (eCOA), is now the standard for enabling hybrid clinical trial models and full virtual trial platforms.
  • The shift toward decentralized data management, supported by robust electronic data capture (EDC) systems and eSource data capture, is driven by the need for real-time data analytics. This trend directly impacts boardroom decisions regarding capital expenditure, as investment shifts from physical site infrastructure to scalable, cloud-based clinical platforms.
  • For example, firms adopting comprehensive remote monitoring solutions have achieved a 30% reduction in site visit costs. Key components such as digital informed consent, mobile health (mHealth) applications, and patient engagement platforms are critical for a successful patient-centric trial design.
  • The entire ecosystem, from investigational medicinal product (IMP) tracking and direct-to-patient (DTP) logistics to the electronic trial master file (eTMF) and clinical trial management system (CTMS), is being optimized for remote trial orchestration and clinical operations automation.

What are the Key Data Covered in this Clinical Trial Decentralization Platforms Market Research and Growth Report?

  • What is the expected growth of the Clinical Trial Decentralization Platforms Market between 2026 and 2030?

    • USD 8.03 billion, at a CAGR of 14.4%

  • What segmentation does the market report cover?

    • The report is segmented by Component (Software, and Services), End-user (Pharmaceutical companies, Contract research organizations, Biotechnology companies, and Academic and research institutes), Deployment (Cloud based platforms, Hybrid deployment, and On premises solutions) and Geography (North America, Europe, APAC, South America, Middle East and Africa)

  • Which regions are analyzed in the report?

    • North America, Europe, APAC, South America and Middle East and Africa

  • What are the key growth drivers and market challenges?

    • Enhancing patient accessibility and diversity through decentralized frameworks, Data privacy concerns and complexity of cybersecurity in remote environments

  • Who are the major players in the Clinical Trial Decentralization Platforms Market?

    • Advarra Inc., Castor Research Inc., Clinical Ink Inc., Crucial Data Solutions Inc., Florence Healthcare., ICON plc, IQVIA Holdings Inc., KAYENTIS SAS, Laboratory Corp., Lightship, Medable Inc., Medidata, Obvio Health USA Inc., Parexel International Corp., Reify Health, Science 37 Inc., Signant Health, Thermo Fisher Scientific Inc., Veeva Systems Inc. and YPrime LLC

Market Research Insights

  • The market is defined by a strategic move toward improving patient retention rates and enhancing participant diversity, directly influencing study outcomes. The adoption of digital health technology facilitates a decentralized study conduct, with some sponsors reporting a 25% reduction in patient dropout rates compared to traditional site-based models.
  • Furthermore, the integration of remote diagnostics and telehealth-enabled trials streamlines trial participation logistics, contributing to a 15% faster recruitment timeline. This shift is not merely technological but also operational, as it enables remote site management and virtual investigator meetings, which are critical for global trial scalability.
  • The focus on a patient-centric data collection model, where the patient journey mapping is central, ensures that the remote consenting process and subsequent data submission are seamless, supporting the broader goal of making clinical research-as-a-care-option a practical reality.

We can help! Our analysts can customize this clinical trial decentralization platforms market research report to meet your requirements.

Get in touch

1. Executive Summary

1.1 Market overview

Executive Summary - Chart on Market Overview
Executive Summary - Data Table on Market Overview
Executive Summary - Chart on Global Market Characteristics
Executive Summary - Chart on Market by Geography
Executive Summary - Chart on Market Segmentation by Component
Executive Summary - Chart on Market Segmentation by End-user
Executive Summary - Chart on Market Segmentation by Deployment
Executive Summary - Chart on Incremental Growth
Executive Summary - Data Table on Incremental Growth
Executive Summary - Chart on Company Market Positioning

2. Technavio Analysis

2.1 Analysis of price sensitivity, lifecycle, customer purchase basket, adoption rates, and purchase criteria

2.2 Criticality of inputs and Factors of differentiation

Chart on Overview on criticality of inputs and factors of differentiation

2.3 Factors of disruption

Chart on Overview on factors of disruption

2.4 Impact of drivers and challenges

Chart on Impact of drivers and challenges in 2025 and 2030

3. Market Landscape

3.1 Market ecosystem

Chart on Parent Market
Data Table on - Parent Market

3.2 Market characteristics

Chart on Market characteristics analysis

3.3 Value chain analysis

Chart on Value chain analysis

4. Market Sizing

4.1 Market definition

Data Table on Offerings of companies included in the market definition

4.2 Market segment analysis

Market segments

4.3 Market size 2025

4.4 Market outlook: Forecast for 2025-2030

Chart on Global - Market size and forecast 2025-2030 ($ million)
Data Table on Global - Market size and forecast 2025-2030 ($ million)
Chart on Global Market: Year-over-year growth 2025-2030 (%)
Data Table on Global Market: Year-over-year growth 2025-2030 (%)

5. Historic Market Size

5.1 Global Clinical Trial Decentralization Platforms Market 2020 - 2024

Historic Market Size - Data Table on Global Clinical Trial Decentralization Platforms Market 2020 - 2024 ($ million)

5.2 Component segment analysis 2020 - 2024

Historic Market Size - Component Segment 2020 - 2024 ($ million)

5.3 End-user segment analysis 2020 - 2024

Historic Market Size - End-user Segment 2020 - 2024 ($ million)

5.4 Deployment segment analysis 2020 - 2024

Historic Market Size - Deployment Segment 2020 - 2024 ($ million)

5.5 Geography segment analysis 2020 - 2024

Historic Market Size - Geography Segment 2020 - 2024 ($ million)

5.6 Country segment analysis 2020 - 2024

Historic Market Size - Country Segment 2020 - 2024 ($ million)

6. Qualitative Analysis

6.1 Impact of AI on Global Clinical Trial Decentralization Platforms Market

7. Five Forces Analysis

7.1 Five forces summary

Five forces analysis - Comparison between 2025 and 2030

7.2 Bargaining power of buyers

Bargaining power of buyers - Impact of key factors 2025 and 2030

7.3 Bargaining power of suppliers

Bargaining power of suppliers - Impact of key factors in 2025 and 2030

7.4 Threat of new entrants

Threat of new entrants - Impact of key factors in 2025 and 2030

7.5 Threat of substitutes

Threat of substitutes - Impact of key factors in 2025 and 2030

7.6 Threat of rivalry

Threat of rivalry - Impact of key factors in 2025 and 2030

7.7 Market condition

Chart on Market condition - Five forces 2025 and 2030

8. Market Segmentation by Component

8.1 Market segments

Chart on Component - Market share 2025-2030 (%)
Data Table on Component - Market share 2025-2030 (%)

8.2 Comparison by Component

Chart on Comparison by Component
Data Table on Comparison by Component

8.3 Software - Market size and forecast 2025-2030

Chart on Software - Market size and forecast 2025-2030 ($ million)
Data Table on Software - Market size and forecast 2025-2030 ($ million)
Chart on Software - Year-over-year growth 2025-2030 (%)
Data Table on Software - Year-over-year growth 2025-2030 (%)

8.4 Services - Market size and forecast 2025-2030

Chart on Services - Market size and forecast 2025-2030 ($ million)
Data Table on Services - Market size and forecast 2025-2030 ($ million)
Chart on Services - Year-over-year growth 2025-2030 (%)
Data Table on Services - Year-over-year growth 2025-2030 (%)

8.5 Market opportunity by Component

Market opportunity by Component ($ million)
Data Table on Market opportunity by Component ($ million)

9. Market Segmentation by End-user

9.1 Market segments

Chart on End-user - Market share 2025-2030 (%)
Data Table on End-user - Market share 2025-2030 (%)

9.2 Comparison by End-user

Chart on Comparison by End-user
Data Table on Comparison by End-user

9.3 Pharmaceutical companies - Market size and forecast 2025-2030

Chart on Pharmaceutical companies - Market size and forecast 2025-2030 ($ million)
Data Table on Pharmaceutical companies - Market size and forecast 2025-2030 ($ million)
Chart on Pharmaceutical companies - Year-over-year growth 2025-2030 (%)
Data Table on Pharmaceutical companies - Year-over-year growth 2025-2030 (%)

9.4 Contract research organizations - Market size and forecast 2025-2030

Chart on Contract research organizations - Market size and forecast 2025-2030 ($ million)
Data Table on Contract research organizations - Market size and forecast 2025-2030 ($ million)
Chart on Contract research organizations - Year-over-year growth 2025-2030 (%)
Data Table on Contract research organizations - Year-over-year growth 2025-2030 (%)

9.5 Biotechnology companies - Market size and forecast 2025-2030

Chart on Biotechnology companies - Market size and forecast 2025-2030 ($ million)
Data Table on Biotechnology companies - Market size and forecast 2025-2030 ($ million)
Chart on Biotechnology companies - Year-over-year growth 2025-2030 (%)
Data Table on Biotechnology companies - Year-over-year growth 2025-2030 (%)

9.6 Academic and research institutes - Market size and forecast 2025-2030

Chart on Academic and research institutes - Market size and forecast 2025-2030 ($ million)
Data Table on Academic and research institutes - Market size and forecast 2025-2030 ($ million)
Chart on Academic and research institutes - Year-over-year growth 2025-2030 (%)
Data Table on Academic and research institutes - Year-over-year growth 2025-2030 (%)

9.7 Market opportunity by End-user

Market opportunity by End-user ($ million)
Data Table on Market opportunity by End-user ($ million)

10. Market Segmentation by Deployment

10.1 Market segments

Chart on Deployment - Market share 2025-2030 (%)
Data Table on Deployment - Market share 2025-2030 (%)

10.2 Comparison by Deployment

Chart on Comparison by Deployment
Data Table on Comparison by Deployment

10.3 Cloud based platforms - Market size and forecast 2025-2030

Chart on Cloud based platforms - Market size and forecast 2025-2030 ($ million)
Data Table on Cloud based platforms - Market size and forecast 2025-2030 ($ million)
Chart on Cloud based platforms - Year-over-year growth 2025-2030 (%)
Data Table on Cloud based platforms - Year-over-year growth 2025-2030 (%)

10.4 Hybrid deployment - Market size and forecast 2025-2030

Chart on Hybrid deployment - Market size and forecast 2025-2030 ($ million)
Data Table on Hybrid deployment - Market size and forecast 2025-2030 ($ million)
Chart on Hybrid deployment - Year-over-year growth 2025-2030 (%)
Data Table on Hybrid deployment - Year-over-year growth 2025-2030 (%)

10.5 On premises solutions - Market size and forecast 2025-2030

Chart on On premises solutions - Market size and forecast 2025-2030 ($ million)
Data Table on On premises solutions - Market size and forecast 2025-2030 ($ million)
Chart on On premises solutions - Year-over-year growth 2025-2030 (%)
Data Table on On premises solutions - Year-over-year growth 2025-2030 (%)

10.6 Market opportunity by Deployment

Market opportunity by Deployment ($ million)
Data Table on Market opportunity by Deployment ($ million)

11. Customer Landscape

11.1 Customer landscape overview

Analysis of price sensitivity, lifecycle, customer purchase basket, adoption rates, and purchase criteria

12. Geographic Landscape

12.1 Geographic segmentation

Chart on Market share by geography 2025-2030 (%)
Data Table on Market share by geography 2025-2030 (%)

12.2 Geographic comparison

Chart on Geographic comparison
Data Table on Geographic comparison

12.3 North America - Market size and forecast 2025-2030

Chart on North America - Market size and forecast 2025-2030 ($ million)
Data Table on North America - Market size and forecast 2025-2030 ($ million)
Chart on North America - Year-over-year growth 2025-2030 (%)
Data Table on North America - Year-over-year growth 2025-2030 (%)
Chart on Regional Comparison - North America
Data Table on Regional Comparison - North America

12.3.1 US - Market size and forecast 2025-2030

Chart on US - Market size and forecast 2025-2030 ($ million)
Data Table on US - Market size and forecast 2025-2030 ($ million)
Chart on US - Year-over-year growth 2025-2030 (%)
Data Table on US - Year-over-year growth 2025-2030 (%)

12.3.2 Canada - Market size and forecast 2025-2030

Chart on Canada - Market size and forecast 2025-2030 ($ million)
Data Table on Canada - Market size and forecast 2025-2030 ($ million)
Chart on Canada - Year-over-year growth 2025-2030 (%)
Data Table on Canada - Year-over-year growth 2025-2030 (%)

12.3.3 Mexico - Market size and forecast 2025-2030

Chart on Mexico - Market size and forecast 2025-2030 ($ million)
Data Table on Mexico - Market size and forecast 2025-2030 ($ million)
Chart on Mexico - Year-over-year growth 2025-2030 (%)
Data Table on Mexico - Year-over-year growth 2025-2030 (%)

12.4 Europe - Market size and forecast 2025-2030

Chart on Europe - Market size and forecast 2025-2030 ($ million)
Data Table on Europe - Market size and forecast 2025-2030 ($ million)
Chart on Europe - Year-over-year growth 2025-2030 (%)
Data Table on Europe - Year-over-year growth 2025-2030 (%)
Chart on Regional Comparison - Europe
Data Table on Regional Comparison - Europe

12.4.1 Germany - Market size and forecast 2025-2030

Chart on Germany - Market size and forecast 2025-2030 ($ million)
Data Table on Germany - Market size and forecast 2025-2030 ($ million)
Chart on Germany - Year-over-year growth 2025-2030 (%)
Data Table on Germany - Year-over-year growth 2025-2030 (%)

12.4.2 UK - Market size and forecast 2025-2030

Chart on UK - Market size and forecast 2025-2030 ($ million)
Data Table on UK - Market size and forecast 2025-2030 ($ million)
Chart on UK - Year-over-year growth 2025-2030 (%)
Data Table on UK - Year-over-year growth 2025-2030 (%)

12.4.3 France - Market size and forecast 2025-2030

Chart on France - Market size and forecast 2025-2030 ($ million)
Data Table on France - Market size and forecast 2025-2030 ($ million)
Chart on France - Year-over-year growth 2025-2030 (%)
Data Table on France - Year-over-year growth 2025-2030 (%)

12.4.4 Italy - Market size and forecast 2025-2030

Chart on Italy - Market size and forecast 2025-2030 ($ million)
Data Table on Italy - Market size and forecast 2025-2030 ($ million)
Chart on Italy - Year-over-year growth 2025-2030 (%)
Data Table on Italy - Year-over-year growth 2025-2030 (%)

12.4.5 The Netherlands - Market size and forecast 2025-2030

Chart on The Netherlands - Market size and forecast 2025-2030 ($ million)
Data Table on The Netherlands - Market size and forecast 2025-2030 ($ million)
Chart on The Netherlands - Year-over-year growth 2025-2030 (%)
Data Table on The Netherlands - Year-over-year growth 2025-2030 (%)

12.4.6 Spain - Market size and forecast 2025-2030

Chart on Spain - Market size and forecast 2025-2030 ($ million)
Data Table on Spain - Market size and forecast 2025-2030 ($ million)
Chart on Spain - Year-over-year growth 2025-2030 (%)
Data Table on Spain - Year-over-year growth 2025-2030 (%)

12.5 APAC - Market size and forecast 2025-2030

Chart on APAC - Market size and forecast 2025-2030 ($ million)
Data Table on APAC - Market size and forecast 2025-2030 ($ million)
Chart on APAC - Year-over-year growth 2025-2030 (%)
Data Table on APAC - Year-over-year growth 2025-2030 (%)
Chart on Regional Comparison - APAC
Data Table on Regional Comparison - APAC

12.5.1 China - Market size and forecast 2025-2030

Chart on China - Market size and forecast 2025-2030 ($ million)
Data Table on China - Market size and forecast 2025-2030 ($ million)
Chart on China - Year-over-year growth 2025-2030 (%)
Data Table on China - Year-over-year growth 2025-2030 (%)

12.5.2 India - Market size and forecast 2025-2030

Chart on India - Market size and forecast 2025-2030 ($ million)
Data Table on India - Market size and forecast 2025-2030 ($ million)
Chart on India - Year-over-year growth 2025-2030 (%)
Data Table on India - Year-over-year growth 2025-2030 (%)

12.5.3 Japan - Market size and forecast 2025-2030

Chart on Japan - Market size and forecast 2025-2030 ($ million)
Data Table on Japan - Market size and forecast 2025-2030 ($ million)
Chart on Japan - Year-over-year growth 2025-2030 (%)
Data Table on Japan - Year-over-year growth 2025-2030 (%)

12.5.4 Australia - Market size and forecast 2025-2030

Chart on Australia - Market size and forecast 2025-2030 ($ million)
Data Table on Australia - Market size and forecast 2025-2030 ($ million)
Chart on Australia - Year-over-year growth 2025-2030 (%)
Data Table on Australia - Year-over-year growth 2025-2030 (%)

12.5.5 South Korea - Market size and forecast 2025-2030

Chart on South Korea - Market size and forecast 2025-2030 ($ million)
Data Table on South Korea - Market size and forecast 2025-2030 ($ million)
Chart on South Korea - Year-over-year growth 2025-2030 (%)
Data Table on South Korea - Year-over-year growth 2025-2030 (%)

12.5.6 Indonesia - Market size and forecast 2025-2030

Chart on Indonesia - Market size and forecast 2025-2030 ($ million)
Data Table on Indonesia - Market size and forecast 2025-2030 ($ million)
Chart on Indonesia - Year-over-year growth 2025-2030 (%)
Data Table on Indonesia - Year-over-year growth 2025-2030 (%)

12.6 South America - Market size and forecast 2025-2030

Chart on South America - Market size and forecast 2025-2030 ($ million)
Data Table on South America - Market size and forecast 2025-2030 ($ million)
Chart on South America - Year-over-year growth 2025-2030 (%)
Data Table on South America - Year-over-year growth 2025-2030 (%)
Chart on Regional Comparison - South America
Data Table on Regional Comparison - South America

12.6.1 Brazil - Market size and forecast 2025-2030

Chart on Brazil - Market size and forecast 2025-2030 ($ million)
Data Table on Brazil - Market size and forecast 2025-2030 ($ million)
Chart on Brazil - Year-over-year growth 2025-2030 (%)
Data Table on Brazil - Year-over-year growth 2025-2030 (%)

12.6.2 Argentina - Market size and forecast 2025-2030

Chart on Argentina - Market size and forecast 2025-2030 ($ million)
Data Table on Argentina - Market size and forecast 2025-2030 ($ million)
Chart on Argentina - Year-over-year growth 2025-2030 (%)
Data Table on Argentina - Year-over-year growth 2025-2030 (%)

12.6.3 Colombia - Market size and forecast 2025-2030

Chart on Colombia - Market size and forecast 2025-2030 ($ million)
Data Table on Colombia - Market size and forecast 2025-2030 ($ million)
Chart on Colombia - Year-over-year growth 2025-2030 (%)
Data Table on Colombia - Year-over-year growth 2025-2030 (%)

12.7 Middle East and Africa - Market size and forecast 2025-2030

Chart on Middle East and Africa - Market size and forecast 2025-2030 ($ million)
Data Table on Middle East and Africa - Market size and forecast 2025-2030 ($ million)
Chart on Middle East and Africa - Year-over-year growth 2025-2030 (%)
Data Table on Middle East and Africa - Year-over-year growth 2025-2030 (%)
Chart on Regional Comparison - Middle East and Africa
Data Table on Regional Comparison - Middle East and Africa

12.7.1 South Africa - Market size and forecast 2025-2030

Chart on South Africa - Market size and forecast 2025-2030 ($ million)
Data Table on South Africa - Market size and forecast 2025-2030 ($ million)
Chart on South Africa - Year-over-year growth 2025-2030 (%)
Data Table on South Africa - Year-over-year growth 2025-2030 (%)

12.7.2 Israel - Market size and forecast 2025-2030

Chart on Israel - Market size and forecast 2025-2030 ($ million)
Data Table on Israel - Market size and forecast 2025-2030 ($ million)
Chart on Israel - Year-over-year growth 2025-2030 (%)
Data Table on Israel - Year-over-year growth 2025-2030 (%)

12.7.3 Saudi Arabia - Market size and forecast 2025-2030

Chart on Saudi Arabia - Market size and forecast 2025-2030 ($ million)
Data Table on Saudi Arabia - Market size and forecast 2025-2030 ($ million)
Chart on Saudi Arabia - Year-over-year growth 2025-2030 (%)
Data Table on Saudi Arabia - Year-over-year growth 2025-2030 (%)

12.7.4 UAE - Market size and forecast 2025-2030

Chart on UAE - Market size and forecast 2025-2030 ($ million)
Data Table on UAE - Market size and forecast 2025-2030 ($ million)
Chart on UAE - Year-over-year growth 2025-2030 (%)
Data Table on UAE - Year-over-year growth 2025-2030 (%)

12.7.5 Turkey - Market size and forecast 2025-2030

Chart on Turkey - Market size and forecast 2025-2030 ($ million)
Data Table on Turkey - Market size and forecast 2025-2030 ($ million)
Chart on Turkey - Year-over-year growth 2025-2030 (%)
Data Table on Turkey - Year-over-year growth 2025-2030 (%)

12.8 Market opportunity by geography

Market opportunity by geography ($ million)
Data Tables on Market opportunity by geography ($ million)

13. Drivers, Challenges, and Opportunity

13.1 Market drivers

Enhancing patient accessibility and diversity through decentralized frameworks
Proliferation of advanced wearable technology and real time data monitoring
Evolution of regulatory guidelines and global harmonization of trial standards

13.2 Market challenges

Data privacy concerns and complexity of cybersecurity in remote environments
Digital divide and risk of participation bias in virtual trials
Logistical complexities and quality oversight of investigational products

13.3 Impact of drivers and challenges

Impact of drivers and challenges in 2025 and 2030

13.4 Market opportunities

Integration of AI for enhanced patient recruitment and retention
Expansion of hybrid trial models and standardized data harmonization
Implementation of high fidelity remote patient monitoring and wearable technology

14. Competitive Landscape

14.1 Overview

14.2

Overview on criticality of inputs and factors of differentiation

14.3 Landscape disruption

Overview on factors of disruption

14.4 Industry risks

Impact of key risks on business

15. Competitive Analysis

15.1 Companies profiled

Companies covered

15.2 Company ranking index

15.3 Market positioning of companies

Matrix on companies position and classification

15.4 Advarra Inc.

Advarra Inc. - Overview
Advarra Inc. - Product / Service
Advarra Inc. - Key offerings
SWOT

15.5 Castor Research Inc.

Castor Research Inc. - Overview
Castor Research Inc. - Product / Service
Castor Research Inc. - Key offerings
SWOT

15.6 Clinical Ink Inc.

Clinical Ink Inc. - Overview
Clinical Ink Inc. - Product / Service
Clinical Ink Inc. - Key offerings
SWOT

15.7 Florence Healthcare.

Florence Healthcare. - Overview
Florence Healthcare. - Product / Service
Florence Healthcare. - Key offerings
SWOT

15.8 ICON plc

ICON plc - Overview
ICON plc - Product / Service
ICON plc - Key offerings
SWOT

15.9 IQVIA Holdings Inc.

IQVIA Holdings Inc. - Overview
IQVIA Holdings Inc. - Business segments
IQVIA Holdings Inc. - Key offerings
IQVIA Holdings Inc. - Segment focus
SWOT

15.10 Medable Inc.

Medable Inc. - Overview
Medable Inc. - Product / Service
Medable Inc. - Key offerings
SWOT

15.11 Medidata

Medidata - Overview
Medidata - Product / Service
Medidata - Key offerings
SWOT

15.12 Obvio Health USA Inc.

Obvio Health USA Inc. - Overview
Obvio Health USA Inc. - Product / Service
Obvio Health USA Inc. - Key offerings
SWOT

15.13 Parexel International Corp.

Parexel International Corp. - Overview
Parexel International Corp. - Product / Service
Parexel International Corp. - Key offerings
SWOT

15.14 Science 37 Inc.

Science 37 Inc. - Overview
Science 37 Inc. - Product / Service
Science 37 Inc. - Key offerings
SWOT

15.15 Signant Health

Signant Health - Overview
Signant Health - Product / Service
Signant Health - Key offerings
SWOT

15.16 Thermo Fisher Scientific Inc.

Thermo Fisher Scientific Inc. - Overview
Thermo Fisher Scientific Inc. - Business segments
Thermo Fisher Scientific Inc. - Key news
Thermo Fisher Scientific Inc. - Key offerings
Thermo Fisher Scientific Inc. - Segment focus
SWOT

15.17 Veeva Systems Inc.

Veeva Systems Inc. - Overview
Veeva Systems Inc. - Business segments
Veeva Systems Inc. - Key offerings
Veeva Systems Inc. - Segment focus
SWOT

15.18 YPrime LLC

YPrime LLC - Overview
YPrime LLC - Product / Service
YPrime LLC - Key offerings
SWOT

16. Appendix

16.1 Scope of the report

Market definition
Objectives
Notes and caveats

16.2 Inclusions and exclusions checklist

Inclusions checklist
Exclusions checklist

16.3 Currency conversion rates for US$

16.4 Research methodology

16.5 Data procurement

Information sources

16.6 Data validation

16.7 Validation techniques employed for market sizing

16.8 Data synthesis

16.9 360 degree market analysis

16.10 List of abbreviations

Research Methodology

Technavio presents a detailed picture of the market by way of study, synthesis, and summation of data from multiple sources. The analysts have presented the various facets of the market with a particular focus on identifying the key industry influencers. The data thus presented is comprehensive, reliable, and the result of extensive research, both primary and secondary.

INFORMATION SOURCES

Primary sources

  • Manufacturers and suppliers
  • Channel partners
  • Industry experts
  • Strategic decision makers

Secondary sources

  • Industry journals and periodicals
  • Government data
  • Financial reports of key industry players
  • Historical data
  • Press releases

DATA ANALYSIS

Data Synthesis

  • Collation of data
  • Estimation of key figures
  • Analysis of derived insights

Data Validation

  • Triangulation with data models
  • Reference against proprietary databases
  • Corroboration with industry experts

REPORT WRITING

Qualitative

  • Market drivers
  • Market challenges
  • Market trends
  • Five forces analysis

Quantitative

  • Market size and forecast
  • Market segmentation
  • Geographical insights
  • Competitive landscape

Interested in this report?

Get your sample now to see our research methodology and insights!

Download Now

Frequently Asked Questions

Clinical Trial Decentralization Platforms market growth will increase by USD 8026.0 million during 2026-2030.

The Clinical Trial Decentralization Platforms market is expected to grow at a CAGR of 14.4% during 2026-2030.

Clinical Trial Decentralization Platforms market is segmented by Component (Software, Services) End-user (Pharmaceutical companies, Contract research organizations, Biotechnology companies, Academic and research institutes) Deployment (Cloud based platforms, Hybrid deployment, On premises solutions)

Advarra Inc., Castor Research Inc., Clinical Ink Inc., Crucial Data Solutions Inc., Florence Healthcare., ICON plc, IQVIA Holdings Inc., KAYENTIS SAS, Laboratory Corp., Lightship, Medable Inc., Medidata, Obvio Health USA Inc., Parexel International Corp., Reify Health, Science 37 Inc., Signant Health, Thermo Fisher Scientific Inc., Veeva Systems Inc., YPrime LLC are a few of the key vendors in the Clinical Trial Decentralization Platforms market.

North America will register the highest growth rate of 37.3% among the other regions. Therefore, the Clinical Trial Decentralization Platforms market in North America is expected to garner significant business opportunities for the vendors during the forecast period.

US, Canada, Mexico, Germany, UK, France, Italy, The Netherlands, Spain, China, India, Japan, Australia, South Korea, Indonesia, Brazil, Argentina, Colombia, South Africa, Israel, Saudi Arabia, UAE, Turkey

  • Enhancing patient accessibility and diversity through decentralized frameworks is the driving factor this market.

The Clinical Trial Decentralization Platforms market vendors should focus on grabbing business opportunities from the Component segment as it accounted for the largest market share in the base year.
RIA - Research AI Assistant
Ask RIA