Clinical Trial Supplies Market Analysis, Size, and Forecast 2024-2028: North America (US, Canada), Europe (Germany, UK, Italy, France), APAC (China, India, Japan), South America (Brazil), Middle East & Africa

Clinical Trial Supplies Market Analysis, Size, and Forecast 2024-2028:
North America (US, Canada), Europe (Germany, UK, Italy, France), APAC (China, India, Japan), South America (Brazil), Middle East & Africa

Published: May 2024 175 Pages SKU: IRTNTR44034

Market Overview at a Glance

$1.31 B
Market Opportunity
8.65%
CAGR
7.78
YoY growth 2023-2024(%)

Clinical Trial Supplies Market Size 2024-2028

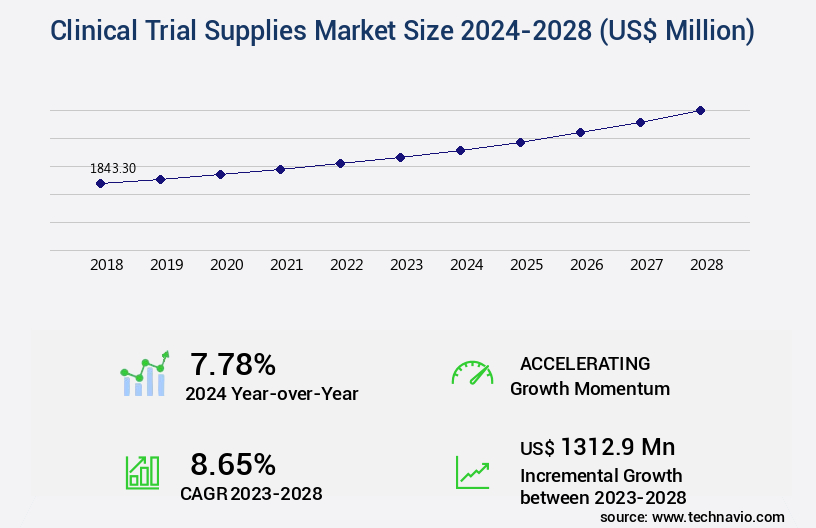
The clinical trial supplies market size is valued to increase USD 1.31 billion, at a CAGR of 8.65% from 2023 to 2028. Growth of biopharmaceutical industry will drive the clinical trial supplies market.

Major Market Trends & Insights

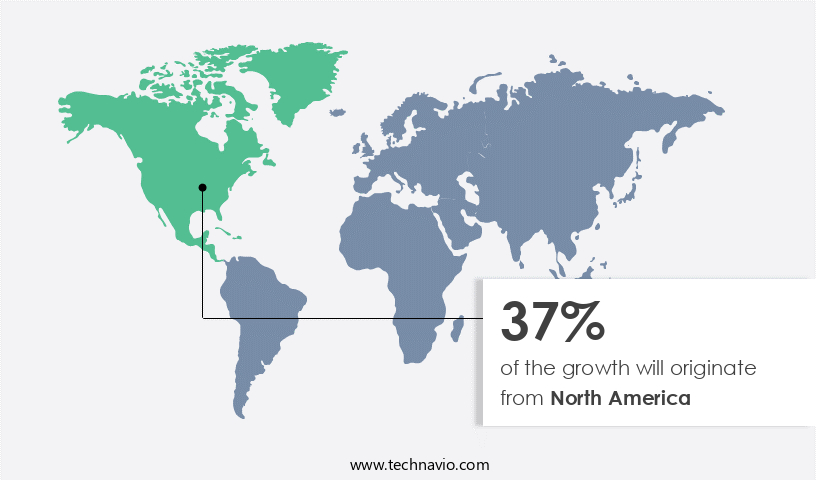
  • North America dominated the market and accounted for a 37% growth during the forecast period.
  • By End-user - Pharmaceutical industry segment was valued at USD 907.30 billion in 2022
  • By Type - Phase III segment accounted for the largest market revenue share in 2022

Market Size & Forecast

  • Market Opportunities: USD 109.77 million
  • Market Future Opportunities: USD 1312.90 million
  • CAGR : 8.65%
  • North America: Largest market in 2022

Market Summary

  • The market encompasses a dynamic and continually evolving landscape, driven by the expanding biopharmaceutical industry and increasing demand for Contract Research Organizations (CROs) to manage clinical trials. With the global biopharmaceutical market projected to reach a value of USD765.6 billion by 2025, the need for reliable clinical trial supplies has become increasingly crucial. However, the high cost of clinical trials remains a significant challenge, with some estimating the average cost of bringing a new drug to market reaching USD2.6 billion.
  • Despite this, the market continues to grow, fueled by advancements in core technologies such as electronic data capture and remote monitoring systems, which streamline trial processes and improve data accuracy. Additionally, stringent regulations, including those set by the FDA and EMA, ensure the highest standards of safety and efficacy for clinical trial participants.

What will be the Size of the Clinical Trial Supplies Market during the forecast period?

Clinical Trial Supplies Market Size

Get Key Insights on Market Forecast (PDF) Request Free Sample

How is the Clinical Trial Supplies Market Segmented and what are the key trends of market segmentation?

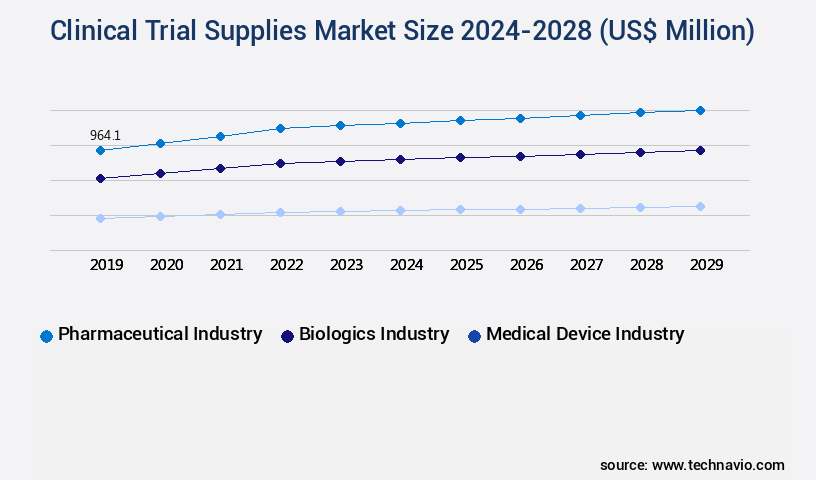
The clinical trial supplies industry research report provides comprehensive data (region-wise segment analysis), with forecasts and estimates in "USD million" for the period 2024-2028, as well as historical data from 2018-2022 for the following segments.

  • End-user
    • Pharmaceutical industry
    • Biologics industry
    • Medical device industry
  • Type
    • Phase III
    • Phase II
    • Phase IV and BE/BA studies
    • Phase I
  • Service
    • Manufacturing
    • Packaging and Labeling
    • Storage and Distribution
    • Comparator Sourcing
    • Ancillary Supplies
    • Others
  • Therapeutic Area
    • Oncology
    • Cardiovascular Diseases
    • Neurology
    • Infectious Diseases
    • Metabolic Disorders
    • Others
  • Distribution Channel
    • Direct-to-Site
    • Depot-to-Site
    • Others
  • Geography
    • North America
      • US
    • Europe
      • Germany
      • UK
    • APAC
      • China
      • Japan
    • Rest of World (ROW)

By End-user Insights

The pharmaceutical industry segment is estimated to witness significant growth during the forecast period.

The market is a significant segment within the life sciences industry, primarily driven by the pharmaceutical sector. With the continuous development of new drugs and the increasing prevalence of chronic and epidemic diseases, the demand for clinical trials is on the rise. According to recent reports, the pharmaceutical industry holds the largest market share in clinical trial supplies, accounting for approximately 60% of the total market. Clinical trials are a crucial step in the drug development process, ensuring the safety, efficacy, and performance of new drugs before they reach the market. The regulatory landscape, particularly the FDA, plays a pivotal role in this process by enforcing stringent guidelines to ensure the safety and efficacy of new drugs and personalized medicine.

As a result, the demand for clinical trial materials, such as biospecimen management, clinical trial documentation, data management systems, patient recruitment, packaging materials, adverse event reporting, storage and handling, drug product labeling, supply chain traceability, and medical device supplies, is growing. Furthermore, the market is expected to expand at a steady pace, with forecasts indicating a potential increase of around 15% in the next three years. This growth can be attributed to the continuous development of new drugs, the increasing prevalence of chronic and epidemic diseases, and the growing trend towards personalized medicine. Additionally, advancements in technology, such as temperature-controlled shipping, inventory tracking systems, and real-time tracking, are revolutionizing the market, making it more efficient and effective.

Moreover, the market is witnessing significant developments in various sectors, including pharmaceutical logistics, protocol adherence, kitting and assembly, warehouse management, and order fulfillment. For instance, the use of investigational medicinal products in clinical trials is increasing, driving the demand for clinical trial packaging and labeling accuracy. Similarly, the importance of supply chain management, demand planning, product lifecycle management, quality control procedures, trial supply forecasting, study medication management, and inventory management systems is becoming increasingly apparent. In conclusion, the market is a dynamic and evolving industry, with the pharmaceutical sector leading the charge. The continuous demand for new drug development, stringent regulations, and technological advancements are driving the growth of this market, making it a vital component of the life sciences industry.

Clinical Trial Supplies Market Size

Request Free Sample

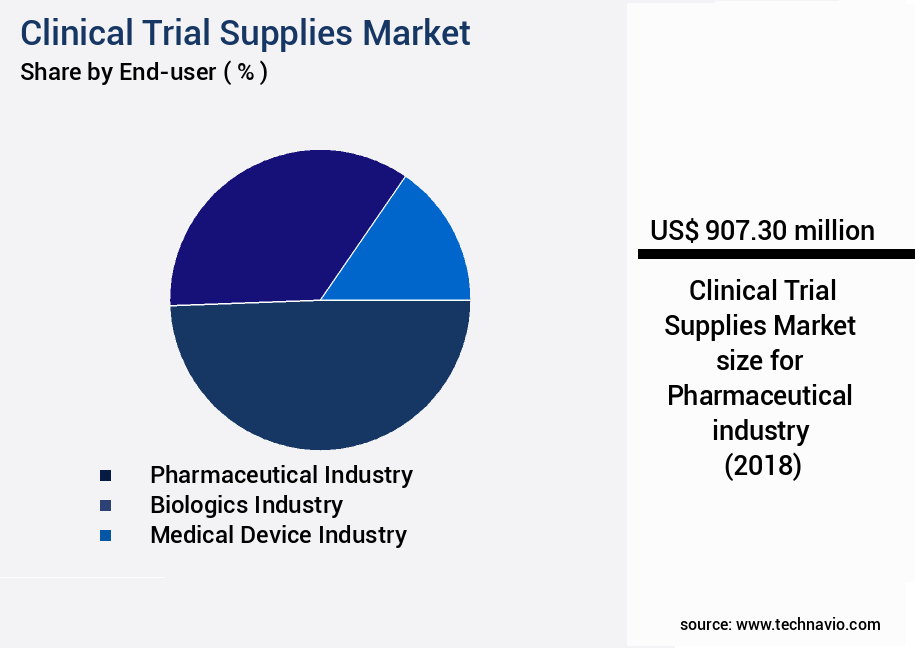
The Pharmaceutical industry segment was valued at USD 907.30 billion in 2018 and showed a gradual increase during the forecast period.

Clinical Trial Supplies Market Size

Request Free Sample

Regional Analysis

North America is estimated to contribute 37% to the growth of the global market during the forecast period.Technavio's analysts have elaborately explained the regional trends and drivers that shape the market during the forecast period.

Clinical Trial Supplies Market Share by Geography

See How Clinical Trial Supplies Market Demand is Rising in North America Request Free Sample

The market in North America is experiencing significant growth, driven by the increasing prevalence of chronic diseases and the rising number of clinical trials. With a high demand from pharmaceutical, biologics, and medical device end-users, North America holds the largest market share. The US, in particular, is a significant contributor due to its large pharmaceutical market and numerous life science research activities.

Market Dynamics

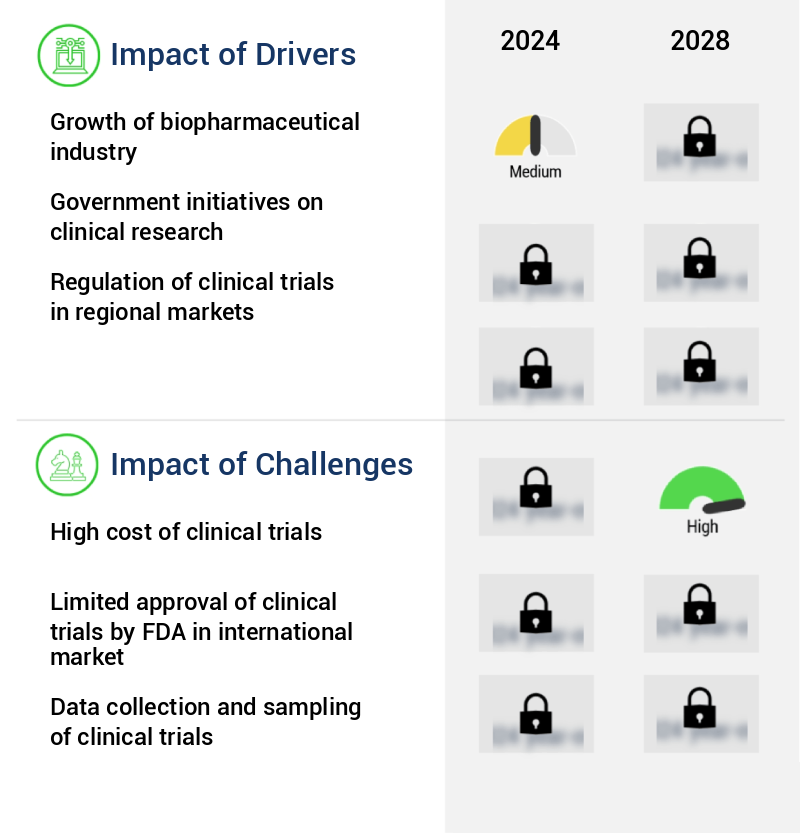
Our researchers analyzed the data with 2023 as the base year, along with the key drivers, trends, and challenges. A holistic analysis of drivers will help companies refine their marketing strategies to gain a competitive advantage.

The market encompasses a complex web of activities, from effective inventory management and temperature-sensitive drug product distribution to regulatory compliance and quality control procedures. This market is characterized by the increasing adoption of advanced clinical trial supply chain visibility solutions, which enable real-time tracking of clinical trial materials and ensure pharmaceutical logistics cold chain compliance. The importance of supply chain traceability in investigational medicines is paramount, with chain of custody documentation best practices playing a crucial role in mitigating risks and ensuring data integrity management in clinical trials. Moreover, clinical trial packaging design and validation, international shipping of temperature-sensitive materials, and adherence to good distribution practices (GMP compliance) are essential components of an efficient global clinical trial supply chain management strategy.

Demand planning algorithms for clinical trial supplies are becoming increasingly sophisticated, enabling better anticipation of requirements and minimizing potential disruptions. Adverse event reporting and product recall management are also critical aspects of clinical trial operations, with the impact on the supply chain being a significant concern. Compared to traditional methods, the implementation of technology-driven solutions has led to substantial improvements in clinical trial supply chain efficiency. For instance, more than 80% of pharmaceutical companies have reported increased efficiency in their clinical trial supply chains due to the adoption of these advanced technologies. This shift towards technology-driven solutions underscores the market's potential for continued growth and innovation.

Clinical Trial Supplies Market Size

What are the key market drivers leading to the rise in the adoption of Clinical Trial Supplies Industry?

  • The biopharmaceutical industry's expansion serves as the primary catalyst for market growth. 
  • The biopharmaceutical industry continues to expand, driven by the discovery and development of innovative biologics and pharmaceutical products. This sector, comprising manufacturers, suppliers, and investors, is characterized by a steady growth trajectory, with a significant focus on addressing previously untreatable conditions in areas such as cancer, neurology, diabetes, and immunology. Approximately 70% of potential medicines in development represent novel approaches to disease treatment. The biopharmaceutical industry's dynamics are shaped by the pharmaceutical industry's shift towards biologics and biosimilars. Global participation in the market is increasing, leading to a diverse range of new drug introductions. This evolution underscores the industry's potential to deliver significant advancements in healthcare. 

What are the market trends shaping the Clinical Trial Supplies Industry?

  • The growing demand for Contract Research Organizations (CROs) represents a significant market trend in the pharmaceutical industry. CROs are increasingly being sought after for their expertise and efficiency in conducting clinical trials and research studies.
  • Pharmaceutical product manufacturers often outsource their clinical trial processes to Contract Research Organizations (CROs) to focus on research and development and reduce operational costs. The growing preference for outsourcing has resulted in an increase in the number of CROs, a trend that is expected to persist. In developed countries, high operational costs have deterred some companies from investing in research facilities due to substantial capital requirements. By outsourcing research and testing to CROs, these companies can optimize their costs and drive innovation. The shift towards outsourcing is a response to the rising complexity of clinical trials and the need for specialized expertise.
  • CROs offer advantages such as cost savings, time efficiency, and access to cutting-edge technologies. This trend is particularly significant in the pharmaceutical industry, where the success of new drugs hinges on rigorous clinical testing. The outsourcing of clinical trials to CROs has become an essential strategy for companies seeking to bring new drugs to market in a cost-effective and efficient manner.

What challenges does the Clinical Trial Supplies Industry face during its growth?

  • The escalating costs of clinical trials represent a significant challenge that impedes the growth of the industry. 
  • The complexity and cost of clinical trials have been a significant concern in the pharmaceutical industry, with expenses escalating due to intricate patient enrollment processes and stringent regulatory requirements. Patient attrition remains a persistent challenge, with an estimated 30% of trial participants dropping out before completion. Furthermore, the demand for extensive clinical data has intensified, necessitating prolonged safety testing and rigorous evaluation. Regulations mandate comprehensive data collection to ensure drug efficacy and safety, particularly for treatments of chronic diseases.

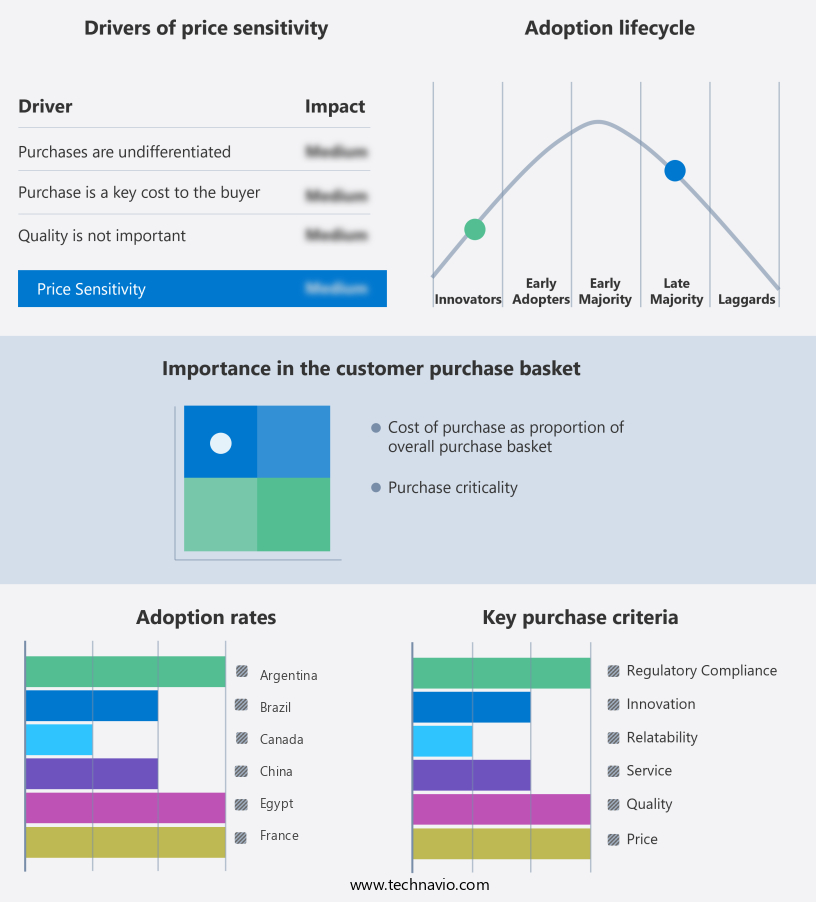
Exclusive Customer Landscape

The clinical trial supplies market forecasting report includes the adoption lifecycle of the market, covering from the innovator's stage to the laggard's stage. It focuses on adoption rates in different regions based on penetration. Furthermore, the clinical trial supplies market report also includes key purchase criteria and drivers of price sensitivity to help companies evaluate and develop their market growth analysis strategies.

Clinical Trial Supplies Market Share by Geography

 Customer Landscape of Clinical Trial Supplies Industry

Competitive Landscape & Market Insights

Companies are implementing various strategies, such as strategic alliances, clinical trial supplies market forecast, partnerships, mergers and acquisitions, geographical expansion, and product/service launches, to enhance their presence in the industry.

Ancillare LP - This company specializes in the development and distribution of innovative sports products, catering to various markets and consumer needs. Through rigorous research and analysis, I identify emerging trends and key players, providing valuable insights to investors and industry professionals.

The industry research and growth report includes detailed analyses of the competitive landscape of the market and information about key companies, including:

  • Ancillare LP
  • Avantor Inc.
  • Bionical Emas Group
  • Bushu Pharmaceuticals Ltd.
  • Catalent Inc.
  • Clinical Services International Ltd.
  • Clinigen Group Plc
  • Deutsche Bahn AG
  • Emsere B.V
  • GNH India Pharmaceuticals Ltd.
  • International Bonded Couriers Inc.
  • Nuvisan GmbH
  • Obvio Health USA Inc.
  • Parexel International Corp.
  • PCI Pharma Services
  • PHOENIX Pharmahandel GmbH and Co KG
  • Piramal Enterprises Ltd.
  • Precision Medicine Group LLC
  • Thermo Fisher Scientific Inc.
  • Vertical Pharma Resources Ltd.

Qualitative and quantitative analysis of companies has been conducted to help clients understand the wider business environment as well as the strengths and weaknesses of key industry players. Data is qualitatively analyzed to categorize companies as pure play, category-focused, industry-focused, and diversified; it is quantitatively analyzed to categorize companies as dominant, leading, strong, tentative, and weak.

Recent Development and News in Clinical Trial Supplies Market

  • In January 2024, Thermo Fisher Scientific, a leading life sciences solutions provider, announced the launch of its new Clinical Trial Materials Management Software, designed to streamline the clinical trial supply chain process (Thermo Fisher Scientific Press Release). This software aims to improve efficiency and reduce errors in managing clinical trial supplies.
  • In March 2024, PPD and IQVIA, two major clinical research organizations, entered into a strategic collaboration to offer integrated clinical trial supply solutions, combining PPD's clinical trial supply services with IQVIA's technology and analytics capabilities (PPD Press Release). This partnership aims to enhance the overall clinical trial process by improving supply chain visibility and efficiency.
  • In May 2025, ICON plc, a global provider of outsourced development and commercialization services to the pharmaceutical, biotechnology, and medical device industries, announced the acquisition of Clinical Trial Logistics, a leading provider of clinical trial logistics services (ICON Press Release). This acquisition will strengthen ICON's position in the market and expand its service offerings.
  • In the same month, the European Medicines Agency (EMA) approved the use of electronic source data in clinical trials, marking a significant regulatory approval for the adoption of technology in clinical trials (EMA Press Release). This decision is expected to accelerate the digital transformation of clinical trials and improve data quality and efficiency.

Dive into Technavio's robust research methodology, blending expert interviews, extensive data synthesis, and validated models for unparalleled Clinical Trial Supplies Market insights. See full methodology.

Market Scope

Report Coverage

Details

Page number

175

Base year

2023

Historic period

2018-2022

Forecast period

2024-2028

Growth momentum & CAGR

Accelerate at a CAGR of 8.65%

Market growth 2024-2028

USD 1312.9 million

Market structure

Fragmented

YoY growth 2023-2024(%)

7.78

Key countries

US, UK, Germany, China, and Japan

Competitive landscape

Leading Companies, Market Positioning of Companies, Competitive Strategies, and Industry Risks

Request Free Sample

Research Analyst Overview

  • In the dynamic and intricate landscape of clinical trials, several key areas have emerged as critical components to ensure successful execution. Among these are biospecimen management, clinical trial documentation, data management systems, patient recruitment, and packaging materials. Biospecimen management involves the collection, handling, and storage of biological samples, ensuring their integrity and availability for analysis. Clinical trial documentation, meanwhile, encompasses the meticulous recording and maintenance of trial-related data, adhering to regulatory requirements. Data management systems facilitate the collection, validation, and analysis of clinical trial data, enabling real-time tracking and reporting. Patient recruitment strategies have evolved to incorporate advanced technologies, streamlining the process and enhancing trial efficiency.
  • Packaging materials play a crucial role in protecting and preserving clinical trial supplies during transportation and storage. Adverse event reporting and storage and handling procedures are essential for maintaining participant safety and ensuring regulatory compliance. Drug product labeling, supply chain traceability, and inventory management systems are integral to ensuring the accuracy and availability of clinical trial materials. Quality control procedures, trial supply forecasting, and study medication management are vital components of effective clinical trial operations. Inventory tracking systems, temperature-controlled shipping, and specimen handling procedures are essential for maintaining the integrity of clinical trial supplies.
  • Pharmaceutical logistics and protocol adherence are crucial elements of successful clinical trial execution. Kitting and assembly, warehouse management, medical device supplies, distribution networks, and order fulfillment are all interconnected aspects of clinical trial supply chain management. The continuous evolution of these areas is driven by the increasing complexity of clinical trials and the need for more efficient, cost-effective, and compliant solutions.

What are the Key Data Covered in this Clinical Trial Supplies Market Research and Growth Report?

  • What is the expected growth of the Clinical Trial Supplies Market between 2024 and 2028?

    • USD 1.31 billion, at a CAGR of 8.65%

  • What segmentation does the market report cover?

    • The report segmented by End-user (Pharmaceutical industry, Biologics industry, and Medical device industry), Type (Phase III, Phase II, Phase IV and BE/BA studies, and Phase I), Geography (North America, Europe, Asia, and Rest of World (ROW)), Service (Manufacturing, Packaging and Labeling, Storage and Distribution, Comparator Sourcing, Ancillary Supplies, Others, Manufacturing, Packaging and Labeling, Storage and Distribution, Comparator Sourcing, Ancillary Supplies, and Others), Therapeutic Area (Oncology, Cardiovascular Diseases, Neurology, Infectious Diseases, Metabolic Disorders, Others, Oncology, Cardiovascular Diseases, Neurology, Infectious Diseases, Metabolic Disorders, and Others), and Distribution Channel (Direct-to-Site, Depot-to-Site, Others, Direct-to-Site, Depot-to-Site, and Others)

  • Which regions are analyzed in the report?

    • North America, Europe, Asia, and Rest of World (ROW)

  • What are the key growth drivers and market challenges?

    • Growth of biopharmaceutical industry, High cost of clinical trials

  • Who are the major players in the Clinical Trial Supplies Market?

    • Key Companies Ancillare LP, Avantor Inc., Bionical Emas Group, Bushu Pharmaceuticals Ltd., Catalent Inc., Clinical Services International Ltd., Clinigen Group Plc, Deutsche Bahn AG, Emsere B.V, GNH India Pharmaceuticals Ltd., International Bonded Couriers Inc., Nuvisan GmbH, Obvio Health USA Inc., Parexel International Corp., PCI Pharma Services, PHOENIX Pharmahandel GmbH and Co KG, Piramal Enterprises Ltd., Precision Medicine Group LLC, Thermo Fisher Scientific Inc., and Vertical Pharma Resources Ltd.


We can help! Our analysts can customize this clinical trial supplies market research report to meet your requirements.

Get in touch

1 Executive Summary

  • 1.1 Market overview
    • Executive Summary - Chart on Market Overview
    • Executive Summary - Data Table on Market Overview
    • Executive Summary - Chart on Global Market Characteristics
    • Executive Summary - Chart on Market by Geography
    • Executive Summary - Chart on Market Segmentation by End-user
    • Executive Summary - Chart on Market Segmentation by Type
    • Executive Summary - Chart on Incremental Growth
    • Executive Summary - Data Table on Incremental Growth
    • Executive Summary - Chart on Company Market Positioning

2 Market Landscape

  • 2.1 Market ecosystem
    • Parent Market
    • Data Table on - Parent Market
  • 2.2 Market characteristics
    • Market characteristics analysis
  • 2.3 Value chain analysis
    • Value Chain Analysis

3 Market Sizing

  • 3.1 Market definition
    • Offerings of companies included in the market definition
  • 3.2 Market segment analysis
    • Market segments
  • 3.3 Market size 2023
    • 3.4 Market outlook: Forecast for 2023-2028
      • Chart on Global - Market size and forecast 2023-2028 ($ million)
      • Data Table on Global - Market size and forecast 2023-2028 ($ million)
      • Chart on Global Market: Year-over-year growth 2023-2028 (%)
      • Data Table on Global Market: Year-over-year growth 2023-2028 (%)

    4 Historic Market Size

    • 4.1 Global Clinical Trial Supplies Market 2018 - 2022
      • Historic Market Size - Data Table on Global Clinical Trial Supplies Market 2018 - 2022 ($ million)
    • 4.2 End-user segment analysis 2018 - 2022
      • Historic Market Size - End-user Segment 2018 - 2022 ($ million)
    • 4.3 Type segment analysis 2018 - 2022
      • Historic Market Size - Type Segment 2018 - 2022 ($ million)
    • 4.4 Geography segment analysis 2018 - 2022
      • Historic Market Size - Geography Segment 2018 - 2022 ($ million)
    • 4.5 Country segment analysis 2018 - 2022
      • Historic Market Size - Country Segment 2018 - 2022 ($ million)

    5 Five Forces Analysis

    • 5.1 Five forces summary
      • Five forces analysis - Comparison between 2023 and 2028
    • 5.2 Bargaining power of buyers
      • Bargaining power of buyers - Impact of key factors 2023 and 2028
    • 5.3 Bargaining power of suppliers
      • Bargaining power of suppliers - Impact of key factors in 2023 and 2028
    • 5.4 Threat of new entrants
      • Threat of new entrants - Impact of key factors in 2023 and 2028
    • 5.5 Threat of substitutes
      • Threat of substitutes - Impact of key factors in 2023 and 2028
    • 5.6 Threat of rivalry
      • Threat of rivalry - Impact of key factors in 2023 and 2028
    • 5.7 Market condition
      • Chart on Market condition - Five forces 2023 and 2028

    6 Market Segmentation by End-user

    • 6.1 Market segments
      • Chart on End-user - Market share 2023-2028 (%)
      • Data Table on End-user - Market share 2023-2028 (%)
    • 6.2 Comparison by End-user
      • Chart on Comparison by End-user
      • Data Table on Comparison by End-user
    • 6.3 Pharmaceutical industry - Market size and forecast 2023-2028
      • Chart on Pharmaceutical industry - Market size and forecast 2023-2028 ($ million)
      • Data Table on Pharmaceutical industry - Market size and forecast 2023-2028 ($ million)
      • Chart on Pharmaceutical industry - Year-over-year growth 2023-2028 (%)
      • Data Table on Pharmaceutical industry - Year-over-year growth 2023-2028 (%)
    • 6.4 Biologics industry - Market size and forecast 2023-2028
      • Chart on Biologics industry - Market size and forecast 2023-2028 ($ million)
      • Data Table on Biologics industry - Market size and forecast 2023-2028 ($ million)
      • Chart on Biologics industry - Year-over-year growth 2023-2028 (%)
      • Data Table on Biologics industry - Year-over-year growth 2023-2028 (%)
    • 6.5 Medical device industry - Market size and forecast 2023-2028
      • Chart on Medical device industry - Market size and forecast 2023-2028 ($ million)
      • Data Table on Medical device industry - Market size and forecast 2023-2028 ($ million)
      • Chart on Medical device industry - Year-over-year growth 2023-2028 (%)
      • Data Table on Medical device industry - Year-over-year growth 2023-2028 (%)
    • 6.6 Market opportunity by End-user
      • Market opportunity by End-user ($ million)
      • Data Table on Market opportunity by End-user ($ million)

    7 Market Segmentation by Type

    • 7.1 Market segments
      • Chart on Type - Market share 2023-2028 (%)
      • Data Table on Type - Market share 2023-2028 (%)
    • 7.2 Comparison by Type
      • Chart on Comparison by Type
      • Data Table on Comparison by Type
    • 7.3 Phase III - Market size and forecast 2023-2028
      • Chart on Phase III - Market size and forecast 2023-2028 ($ million)
      • Data Table on Phase III - Market size and forecast 2023-2028 ($ million)
      • Chart on Phase III - Year-over-year growth 2023-2028 (%)
      • Data Table on Phase III - Year-over-year growth 2023-2028 (%)
    • 7.4 Phase II - Market size and forecast 2023-2028
      • Chart on Phase II - Market size and forecast 2023-2028 ($ million)
      • Data Table on Phase II - Market size and forecast 2023-2028 ($ million)
      • Chart on Phase II - Year-over-year growth 2023-2028 (%)
      • Data Table on Phase II - Year-over-year growth 2023-2028 (%)
    • 7.5 Phase IV and BE/BA studies - Market size and forecast 2023-2028
      • Chart on Phase IV and BE/BA studies - Market size and forecast 2023-2028 ($ million)
      • Data Table on Phase IV and BE/BA studies - Market size and forecast 2023-2028 ($ million)
      • Chart on Phase IV and BE/BA studies - Year-over-year growth 2023-2028 (%)
      • Data Table on Phase IV and BE/BA studies - Year-over-year growth 2023-2028 (%)
    • 7.6 Phase I - Market size and forecast 2023-2028
      • Chart on Phase I - Market size and forecast 2023-2028 ($ million)
      • Data Table on Phase I - Market size and forecast 2023-2028 ($ million)
      • Chart on Phase I - Year-over-year growth 2023-2028 (%)
      • Data Table on Phase I - Year-over-year growth 2023-2028 (%)
    • 7.7 Market opportunity by Type
      • Market opportunity by Type ($ million)
      • Data Table on Market opportunity by Type ($ million)

    8 Market Segmentation by Service

    • 8.1 Market segments
      • Chart on Service - Market share (2023-2028) (%)
      • Data Table on Service - Market share (2023-2028) (%)
    • 8.2 Comparison by Service
      • Chart on Comparison by Service
      • Data Table on Comparison by Service
    • 8.3 Manufacturing - Market size and forecast (2023-2028)
      • Chart on Manufacturing - Market size and forecast (2023-2028) ($ million)
      • Data Table on Manufacturing - Market size and forecast (2023-2028) ($ million)
      • Chart on Manufacturing - Year-over-year growth (2023-2028) (%)
      • Data Table on Manufacturing - Year-over-year growth (2023-2028) (%)
    • 8.4 Packaging and Labeling - Market size and forecast (2023-2028)
      • Chart on Packaging and Labeling - Market size and forecast (2023-2028) ($ million)
      • Data Table on Packaging and Labeling - Market size and forecast (2023-2028) ($ million)
      • Chart on Packaging and Labeling - Year-over-year growth (2023-2028) (%)
      • Data Table on Packaging and Labeling - Year-over-year growth (2023-2028) (%)
    • 8.5 Storage and Distribution - Market size and forecast (2023-2028)
      • Chart on Storage and Distribution - Market size and forecast (2023-2028) ($ million)
      • Data Table on Storage and Distribution - Market size and forecast (2023-2028) ($ million)
      • Chart on Storage and Distribution - Year-over-year growth (2023-2028) (%)
      • Data Table on Storage and Distribution - Year-over-year growth (2023-2028) (%)
    • 8.6 Comparator Sourcing - Market size and forecast (2023-2028)
      • Chart on Comparator Sourcing - Market size and forecast (2023-2028) ($ million)
      • Data Table on Comparator Sourcing - Market size and forecast (2023-2028) ($ million)
      • Chart on Comparator Sourcing - Year-over-year growth (2023-2028) (%)
      • Data Table on Comparator Sourcing - Year-over-year growth (2023-2028) (%)
    • 8.7 Ancillary Supplies - Market size and forecast (2023-2028)
      • Chart on Ancillary Supplies - Market size and forecast (2023-2028) ($ million)
      • Data Table on Ancillary Supplies - Market size and forecast (2023-2028) ($ million)
      • Chart on Ancillary Supplies - Year-over-year growth (2023-2028) (%)
      • Data Table on Ancillary Supplies - Year-over-year growth (2023-2028) (%)
    • 8.8 Others - Market size and forecast (2023-2028)
      • Chart on Others - Market size and forecast (2023-2028) ($ million)
      • Data Table on Others - Market size and forecast (2023-2028) ($ million)
      • Chart on Others - Year-over-year growth (2023-2028) (%)
      • Data Table on Others - Year-over-year growth (2023-2028) (%)
    • 8.9 Market opportunity by Service
      • Market opportunity by $segment_name ($ million)
      • Data Table on Market opportunity by $segment_name ($ million)

    9 Market Segmentation by Therapeutic Area

    • 9.1 Market segments
      • Chart on Therapeutic Area - Market share (2023-2028) (%)
      • Data Table on Therapeutic Area - Market share (2023-2028) (%)
    • 9.2 Comparison by Therapeutic Area
      • Chart on Comparison by Therapeutic Area
      • Data Table on Comparison by Therapeutic Area
    • 9.3 Oncology - Market size and forecast (2023-2028)
      • Chart on Oncology - Market size and forecast (2023-2028) ($ million)
      • Data Table on Oncology - Market size and forecast (2023-2028) ($ million)
      • Chart on Oncology - Year-over-year growth (2023-2028) (%)
      • Data Table on Oncology - Year-over-year growth (2023-2028) (%)
    • 9.4 Cardiovascular Diseases - Market size and forecast (2023-2028)
      • Chart on Cardiovascular Diseases - Market size and forecast (2023-2028) ($ million)
      • Data Table on Cardiovascular Diseases - Market size and forecast (2023-2028) ($ million)
      • Chart on Cardiovascular Diseases - Year-over-year growth (2023-2028) (%)
      • Data Table on Cardiovascular Diseases - Year-over-year growth (2023-2028) (%)
    • 9.5 Neurology - Market size and forecast (2023-2028)
      • Chart on Neurology - Market size and forecast (2023-2028) ($ million)
      • Data Table on Neurology - Market size and forecast (2023-2028) ($ million)
      • Chart on Neurology - Year-over-year growth (2023-2028) (%)
      • Data Table on Neurology - Year-over-year growth (2023-2028) (%)
    • 9.6 Infectious Diseases - Market size and forecast (2023-2028)
      • Chart on Infectious Diseases - Market size and forecast (2023-2028) ($ million)
      • Data Table on Infectious Diseases - Market size and forecast (2023-2028) ($ million)
      • Chart on Infectious Diseases - Year-over-year growth (2023-2028) (%)
      • Data Table on Infectious Diseases - Year-over-year growth (2023-2028) (%)
    • 9.7 Metabolic Disorders - Market size and forecast (2023-2028)
      • Chart on Metabolic Disorders - Market size and forecast (2023-2028) ($ million)
      • Data Table on Metabolic Disorders - Market size and forecast (2023-2028) ($ million)
      • Chart on Metabolic Disorders - Year-over-year growth (2023-2028) (%)
      • Data Table on Metabolic Disorders - Year-over-year growth (2023-2028) (%)
    • 9.8 Others - Market size and forecast (2023-2028)
      • Chart on Others - Market size and forecast (2023-2028) ($ million)
      • Data Table on Others - Market size and forecast (2023-2028) ($ million)
      • Chart on Others - Year-over-year growth (2023-2028) (%)
      • Data Table on Others - Year-over-year growth (2023-2028) (%)
    • 9.9 Market opportunity by Therapeutic Area
      • Market opportunity by $segment_name ($ million)
      • Data Table on Market opportunity by $segment_name ($ million)

    10 Market Segmentation by Distribution Channel

    • 10.1 Market segments
      • Chart on Distribution Channel - Market share (2023-2028) (%)
      • Data Table on Distribution Channel - Market share (2023-2028) (%)
    • 10.2 Comparison by Distribution Channel
      • Chart on Comparison by Distribution Channel
      • Data Table on Comparison by Distribution Channel
    • 10.3 Direct-to-Site - Market size and forecast (2023-2028)
      • Chart on Direct-to-Site - Market size and forecast (2023-2028) ($ million)
      • Data Table on Direct-to-Site - Market size and forecast (2023-2028) ($ million)
      • Chart on Direct-to-Site - Year-over-year growth (2023-2028) (%)
      • Data Table on Direct-to-Site - Year-over-year growth (2023-2028) (%)
    • 10.4 Depot-to-Site - Market size and forecast (2023-2028)
      • Chart on Depot-to-Site - Market size and forecast (2023-2028) ($ million)
      • Data Table on Depot-to-Site - Market size and forecast (2023-2028) ($ million)
      • Chart on Depot-to-Site - Year-over-year growth (2023-2028) (%)
      • Data Table on Depot-to-Site - Year-over-year growth (2023-2028) (%)
    • 10.5 Others - Market size and forecast (2023-2028)
      • Chart on Others - Market size and forecast (2023-2028) ($ million)
      • Data Table on Others - Market size and forecast (2023-2028) ($ million)
      • Chart on Others - Year-over-year growth (2023-2028) (%)
      • Data Table on Others - Year-over-year growth (2023-2028) (%)
    • 10.6 Market opportunity by Distribution Channel
      • Market opportunity by $segment_name ($ million)
      • Data Table on Market opportunity by $segment_name ($ million)

    11 Customer Landscape

    • 11.1 Customer landscape overview
      • Analysis of price sensitivity, lifecycle, customer purchase basket, adoption rates, and purchase criteria

    12 Geographic Landscape

    • 12.1 Geographic segmentation
      • Chart on Market share by geography 2023-2028 (%)
      • Data Table on Market share by geography 2023-2028 (%)
    • 12.2 Geographic comparison
      • Chart on Geographic comparison
      • Data Table on Geographic comparison
    • 12.3 North America - Market size and forecast 2023-2028
      • Chart on North America - Market size and forecast 2023-2028 ($ million)
      • Data Table on North America - Market size and forecast 2023-2028 ($ million)
      • Chart on North America - Year-over-year growth 2023-2028 (%)
      • Data Table on North America - Year-over-year growth 2023-2028 (%)
    • 12.4 Europe - Market size and forecast 2023-2028
      • Chart on Europe - Market size and forecast 2023-2028 ($ million)
      • Data Table on Europe - Market size and forecast 2023-2028 ($ million)
      • Chart on Europe - Year-over-year growth 2023-2028 (%)
      • Data Table on Europe - Year-over-year growth 2023-2028 (%)
    • 12.5 Asia - Market size and forecast 2023-2028
      • Chart on Asia - Market size and forecast 2023-2028 ($ million)
      • Data Table on Asia - Market size and forecast 2023-2028 ($ million)
      • Chart on Asia - Year-over-year growth 2023-2028 (%)
      • Data Table on Asia - Year-over-year growth 2023-2028 (%)
    • 12.6 Rest of World (ROW) - Market size and forecast 2023-2028
      • Chart on Rest of World (ROW) - Market size and forecast 2023-2028 ($ million)
      • Data Table on Rest of World (ROW) - Market size and forecast 2023-2028 ($ million)
      • Chart on Rest of World (ROW) - Year-over-year growth 2023-2028 (%)
      • Data Table on Rest of World (ROW) - Year-over-year growth 2023-2028 (%)
    • 12.7 US - Market size and forecast 2023-2028
      • Chart on US - Market size and forecast 2023-2028 ($ million)
      • Data Table on US - Market size and forecast 2023-2028 ($ million)
      • Chart on US - Year-over-year growth 2023-2028 (%)
      • Data Table on US - Year-over-year growth 2023-2028 (%)
    • 12.8 UK - Market size and forecast 2023-2028
      • Chart on UK - Market size and forecast 2023-2028 ($ million)
      • Data Table on UK - Market size and forecast 2023-2028 ($ million)
      • Chart on UK - Year-over-year growth 2023-2028 (%)
      • Data Table on UK - Year-over-year growth 2023-2028 (%)
    • 12.9 Germany - Market size and forecast 2023-2028
      • Chart on Germany - Market size and forecast 2023-2028 ($ million)
      • Data Table on Germany - Market size and forecast 2023-2028 ($ million)
      • Chart on Germany - Year-over-year growth 2023-2028 (%)
      • Data Table on Germany - Year-over-year growth 2023-2028 (%)
    • 12.10 China - Market size and forecast 2023-2028
      • Chart on China - Market size and forecast 2023-2028 ($ million)
      • Data Table on China - Market size and forecast 2023-2028 ($ million)
      • Chart on China - Year-over-year growth 2023-2028 (%)
      • Data Table on China - Year-over-year growth 2023-2028 (%)
    • 12.11 Japan - Market size and forecast 2023-2028
      • Chart on Japan - Market size and forecast 2023-2028 ($ million)
      • Data Table on Japan - Market size and forecast 2023-2028 ($ million)
      • Chart on Japan - Year-over-year growth 2023-2028 (%)
      • Data Table on Japan - Year-over-year growth 2023-2028 (%)
    • 12.12 Market opportunity by geography
      • Market opportunity by geography ($ million)
      • Data Tables on Market opportunity by geography ($ million)

    13 Drivers, Challenges, and Opportunity/Restraints

    • 13.1 Market drivers
      • 13.2 Market challenges
        • 13.3 Impact of drivers and challenges
          • Impact of drivers and challenges in 2023 and 2028
        • 13.4 Market opportunities/restraints

          14 Competitive Landscape

          • 14.1 Overview
            • 14.2 Competitive Landscape
              • Overview on criticality of inputs and factors of differentiation
            • 14.3 Landscape disruption
              • Overview on factors of disruption
            • 14.4 Industry risks
              • Impact of key risks on business

            15 Competitive Analysis

            • 15.1 Companies profiled
              • Companies covered
            • 15.2 Market positioning of companies
              • Matrix on companies position and classification
            • 15.3 Ancillare LP
              • Ancillare LP - Overview
              • Ancillare LP - Product / Service
              • Ancillare LP - Key offerings
            • 15.4 Avantor Inc.
              • Avantor Inc. - Overview
              • Avantor Inc. - Business segments
              • Avantor Inc. - Key news
              • Avantor Inc. - Key offerings
              • Avantor Inc. - Segment focus
            • 15.5 Bushu Pharmaceuticals Ltd.
              • Bushu Pharmaceuticals Ltd. - Overview
              • Bushu Pharmaceuticals Ltd. - Product / Service
              • Bushu Pharmaceuticals Ltd. - Key offerings
            • 15.6 Clinigen Group Plc
              • Clinigen Group Plc - Overview
              • Clinigen Group Plc - Product / Service
              • Clinigen Group Plc - Key offerings
            • 15.7 Deutsche Bahn AG
              • Deutsche Bahn AG - Overview
              • Deutsche Bahn AG - Product / Service
              • Deutsche Bahn AG - Key offerings
            • 15.8 Emsere B.V
              • Emsere B.V - Overview
              • Emsere B.V - Product / Service
              • Emsere B.V - Key offerings
            • 15.9 International Bonded Couriers Inc.
              • International Bonded Couriers Inc. - Overview
              • International Bonded Couriers Inc. - Product / Service
              • International Bonded Couriers Inc. - Key offerings
            • 15.10 Nuvisan GmbH
              • Nuvisan GmbH - Overview
              • Nuvisan GmbH - Product / Service
              • Nuvisan GmbH - Key offerings
            • 15.11 Obvio Health USA Inc.
              • Obvio Health USA Inc. - Overview
              • Obvio Health USA Inc. - Product / Service
              • Obvio Health USA Inc. - Key offerings
            • 15.12 Parexel International Corp.
              • Parexel International Corp. - Overview
              • Parexel International Corp. - Product / Service
              • Parexel International Corp. - Key offerings
            • 15.13 PCI Pharma Services
              • PCI Pharma Services - Overview
              • PCI Pharma Services - Product / Service
              • PCI Pharma Services - Key offerings
            • 15.14 PHOENIX Pharmahandel GmbH and Co KG
              • PHOENIX Pharmahandel GmbH and Co KG - Overview
              • PHOENIX Pharmahandel GmbH and Co KG - Product / Service
              • PHOENIX Pharmahandel GmbH and Co KG - Key news
              • PHOENIX Pharmahandel GmbH and Co KG - Key offerings
            • 15.15 Piramal Enterprises Ltd.
              • Piramal Enterprises Ltd. - Overview
              • Piramal Enterprises Ltd. - Product / Service
              • Piramal Enterprises Ltd. - Key offerings
            • 15.16 Precision Medicine Group LLC
              • Precision Medicine Group LLC - Overview
              • Precision Medicine Group LLC - Product / Service
              • Precision Medicine Group LLC - Key offerings
            • 15.17 Vertical Pharma Resources Ltd.
              • Vertical Pharma Resources Ltd. - Overview
              • Vertical Pharma Resources Ltd. - Product / Service
              • Vertical Pharma Resources Ltd. - Key offerings

            16 Appendix

            • 16.1 Scope of the report
              • 16.2 Inclusions and exclusions checklist
                • Inclusions checklist
                • Exclusions checklist
              • 16.3 Currency conversion rates for US$
                • Currency conversion rates for US$
              • 16.4 Research methodology
                • Research methodology
              • 16.5 Data procurement
                • Information sources
              • 16.6 Data validation
                • Data validation
              • 16.7 Validation techniques employed for market sizing
                • Validation techniques employed for market sizing
              • 16.8 Data synthesis
                • Data synthesis
              • 16.9 360 degree market analysis
                • 360 degree market analysis
              • 16.10 List of abbreviations
                • List of abbreviations

              Research Methodology

              Technavio presents a detailed picture of the market by way of study, synthesis, and summation of data from multiple sources. The analysts have presented the various facets of the market with a particular focus on identifying the key industry influencers. The data thus presented is comprehensive, reliable, and the result of extensive research, both primary and secondary.

              INFORMATION SOURCES

              Primary sources

              • Manufacturers and suppliers
              • Channel partners
              • Industry experts
              • Strategic decision makers

              Secondary sources

              • Industry journals and periodicals
              • Government data
              • Financial reports of key industry players
              • Historical data
              • Press releases

              DATA ANALYSIS

              Data Synthesis

              • Collation of data
              • Estimation of key figures
              • Analysis of derived insights

              Data Validation

              • Triangulation with data models
              • Reference against proprietary databases
              • Corroboration with industry experts

              REPORT WRITING

              Qualitative

              • Market drivers
              • Market challenges
              • Market trends
              • Five forces analysis

              Quantitative

              • Market size and forecast
              • Market segmentation
              • Geographical insights
              • Competitive landscape

              Interested in this report?

              Get your sample now to see our research methodology and insights!

              Download Now

              Frequently Asked Questions

              Clinical Trial Supplies market growth will increase by $ 1312.9 mn during 2024-2028.

              The Clinical Trial Supplies market is expected to grow at a CAGR of 8.65% during 2024-2028.

              Clinical Trial Supplies market is segmented by End-user( Pharmaceutical industry, Biologics industry, Medical device industry) Type( Phase III, Phase II, Phase IV and BE/BA studies, Phase I, MEA)

              Ancillare LP, Avantor Inc., Bionical Emas Group, Bushu Pharmaceuticals Ltd., Catalent Inc., Clinical Services International Ltd., Clinigen Group Plc, Deutsche Bahn AG, Emsere B.V, GNH India Pharmaceuticals Ltd., International Bonded Couriers Inc., Nuvisan GmbH, Obvio Health USA Inc., Parexel International Corp., PCI Pharma Services, PHOENIX Pharmahandel GmbH and Co KG, Piramal Enterprises Ltd., Precision Medicine Group LLC, Thermo Fisher Scientific Inc., Vertical Pharma Resources Ltd. are a few of the key vendors in the Clinical Trial Supplies market.

              North America will register the highest growth rate of 37% among the other regions. Therefore, the Clinical Trial Supplies market in North America is expected to garner significant business opportunities for the vendors during the forecast period.

              US, UK, Germany, China, Japan

              • Growth of biopharmaceutical industryThe biopharmaceutical industry comprises biologics and pharmaceutical products is the driving factor this market.
              • manufacturers is the driving factor this market.
              • and suppliers growing at a steady pace. Biologics innovators is the driving factor this market.
              • suppliers is the driving factor this market.
              • and investors are excited about the growing and profitable industry. The dynamics of the biopharmaceutical industry evolve as the pharmaceutical industry shifts toward the biopharmaceutical industry for the discovery of new drugs and biosimilars that are introduced to the market by new global participants. The ability of biopharmaceutical products to address previously untreatable conditions has introduced innovative drugs into the market. Approximately 70% of potential medicines in development represent novel approaches to addressing diseases in areas such as cancer is the driving factor this market.
              • neurology is the driving factor this market.
              • diabetes is the driving factor this market.
              • and immunology. Biopharmaceuticals witnessed reducing the number of deaths due to cancer and HIV/AIDS in the past decade is the driving factor this market.
              • which led to an increase in the adoption of biopharmaceuticals in the global market. Geographically is the driving factor this market.
              • the biopharmaceutical industry is expanding to developing countries such as India and China. Developed countries such as the US is the driving factor this market.
              • Canada is the driving factor this market.
              • and the UK are setting up facilities or partnering with regional market players in these countries to meet the global demand for products. As the global demand for various biologics and pharmaceuticals is growing at a steady rate is the driving factor this market.
              • partnerships between developing and developed countries are rising to increase the development and production of biologics. India is focusing on the development of biosimilars for the regional and international markets. To meet the regional demand for biopharmaceuticals and to optimize the costs of production of biosimilars is the driving factor this market.
              • India is focusing on high-quality is the driving factor this market.
              • innovative biopharmaceuticals. The favorable regulations and less stringent policies support the growth and development of biopharmaceuticals in India. However is the driving factor this market.
              • from a Western perspective is the driving factor this market.
              • the biopharmaceutical industry is the driving factor this market.
              • the pharmaceutical sector is the driving factor this market.
              • and the government of India are yet to adopt and enforce high standards of regulations. Comparing the Indian biopharmaceutical industry with its Chinese counterpart reveals that China has fewer infrastructure issues like access to land is the driving factor this market.
              • electricity is the driving factor this market.
              • power is the driving factor this market.
              • and wastewater processing. China also has high government coordination with industry subsidies. Therefore is the driving factor this market.
              • the Chinese biopharmaceutical industry has the potential to grow faster than its Indian counterpart. This significant expansion of the global biopharmaceutical market has led to the growth of many other industries is the driving factor this market.
              • such as contract research is the driving factor this market.
              • contract-based manufacturing is the driving factor this market.
              • biologics and pharmaceutical consumables is the driving factor this market.
              • and clinical trials. Research and manufacturing drugs and biologics involve clinical trials to ensure the safety is the driving factor this market.
              • efficacy is the driving factor this market.
              • and minimal side effects of products. Thus is the driving factor this market.
              • the growth in the biopharmaceutical industry is driving the growth of the clinical trials market and the demand for clinical trial supplies. To meet the growing demand for clinical trials is the driving factor this market.
              • vendors of clinical trial supplies are enhancing products and services such as cold chain storage and distribution is the driving factor this market.
              • warehousing is the driving factor this market.
              • and logistics for temperature-sensitive products. This expansion is driving the growth of the global clinical trial supplies market. is the driving factor this market.

              The Clinical Trial Supplies market vendors should focus on grabbing business opportunities from the Pharmaceutical industry segment as it accounted for the largest market share in the base year.
              RIA - Research AI Assistant
              Ask RIA