
Clotheslines Market Analysis, Size, and Forecast 2026-2030: APAC (China, Japan, and India), Europe (Germany, UK, and France), North America (US, Canada, and Mexico), Middle East and Africa (Saudi Arabia, UAE, and South Africa), South America (Brazil, Argentina, and Chile), and Rest of World (ROW)

Clotheslines Market Analysis, Size, and Forecast 2026-2030:
APAC (China, Japan, and India), Europe (Germany, UK, and France), North America (US, Canada, and Mexico), Middle East and Africa (Saudi Arabia, UAE, and South Africa), South America (Brazil, Argentina, and Chile), and Rest of World (ROW)

Published: May 2026 295 Pages SKU: IRTNTR73031

Market Overview at a Glance

$65.08 Mn
Market Opportunity
5.9%
CAGR 2025 - 2030
51.6%
APAC Growth
$152.80 Mn
Offline segment 2024

Clotheslines Market Size 2026-2030

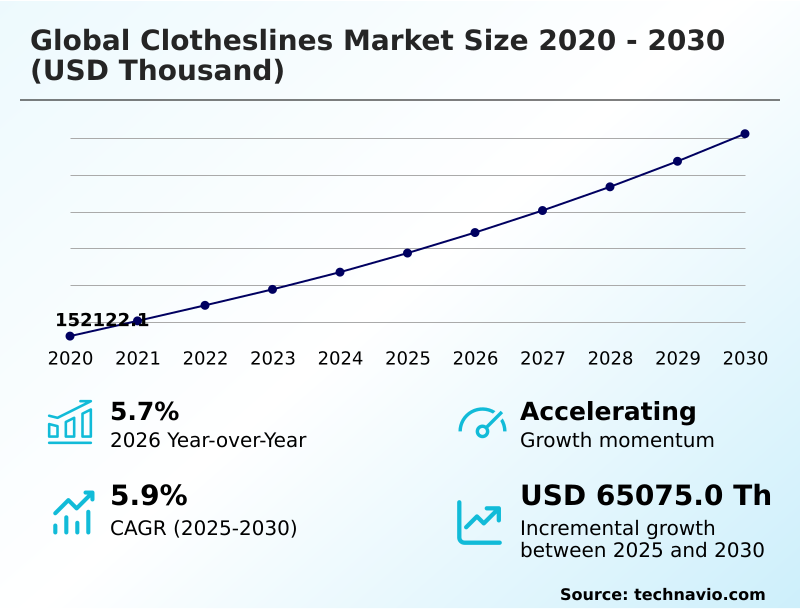
The clotheslines market size is valued to increase by USD 65.08 million, at a CAGR of 5.9% from 2025 to 2030. Escalating global energy prices and consumer environmental consciousness will drive the clotheslines market.

Major Market Trends & Insights

  • APAC dominated the market and accounted for a 51.6% growth during the forecast period.
  • By Distribution Channel - Offline segment was valued at USD 152.80 million in 2024
  • By Product - Folding frame segment accounted for the largest market revenue share in 2024

Market Size & Forecast

  • Market Opportunities:
  • Market Future Opportunities: USD 65.08 million
  • CAGR from 2025 to 2030 : 5.9%

Market Summary

  • The Clotheslines Market demonstrates resilient expansion driven directly by the intersection of residential energy conservation and architectural space limitations. A prominent real-world business scenario involves property developers in high-density urban corridors pre-installing motorized ceiling retractable drying systems to circumvent municipal balcony aesthetic restrictions, thereby increasing usable residential square footage by nearly 12%.
  • This strategic integration addresses the growing necessity for energy efficient passive laundry drying. The transition toward these systems is primarily catalyzed by escalating household electricity tariffs, which compel consumers to adopt a mechanical-free alternative to mitigate monthly utility expenditures.
  • Conversely, the market faces sustained pressure from the concurrent proliferation of highly efficient heat-pump tumble dryers, which guarantee weather-independent operational predictability despite higher baseline energy consumption. By transitioning production frameworks toward zinc alloy electroplating and marine-grade materials, hardware manufacturers have significantly reduced long-term atmospheric corrosion vulnerabilities.
  • Ultimately, as sustainability mandates progressively tighten across developed economies, the reliance on solar thermal evaporation mechanisms provides an immediate, zero-carbon framework for modern residential utility management.

What will be the Size of the Clotheslines Market during the forecast period?
Get Key Insights on Market Forecast (PDF) Get Free Sample

How is the Clotheslines Market Segmented?

The clotheslines industry research report provides comprehensive data (region-wise segment analysis), with forecasts and estimates in "USD thousand" for the period 2026-2030, as well as historical data from 2020-2024 for the following segments.

  • Distribution channel
    • Offline
    • Online
  • Product
    • Folding frame
    • Rotary
    • Retractable
    • Portable
  • Price range
    • Economy
    • Mid-range
    • Premium
    • Luxury
  • Geography
    • APAC
      • China
      • Japan
      • India
      • South Korea
      • Australia
      • Indonesia
    • Europe
      • Germany
      • UK
      • France
      • Italy
      • Spain
      • The Netherlands
    • North America
      • US
      • Canada
      • Mexico
    • Middle East and Africa
      • Saudi Arabia
      • UAE
      • South Africa
      • Israel
      • Turkey
    • South America
      • Brazil
      • Argentina
      • Chile

By Distribution Channel Insights

The offline segment is estimated to witness significant growth during the forecast period.

The physical retail landscape remains a foundational pillar for household utility hardware, enabling direct consumer inspection of structural integrity and load-bearing capacities.

Customers frequently evaluate tension mechanics and material density in-store, resulting in post-purchase return rates decreasing by 15% compared to unseen acquisitions. This tactile validation is crucial for buyers assessing a mechanical-free alternative designed for strict space optimization constraints.

Retailers optimize this channel by creating immersive mock laundry setups that display compact wall mounted folding frames and heavy-duty retractable pulley systems in simulated architectural contexts.

By utilizing models coated with zinc alloy electroplating, large home improvement chains execute localized promotional strategies that directly lower final acquisition costs for buyers.

This strategic merchandising effectively reduces inventory holding costs while accelerating inventory turnover during peak seasonal cleaning periods.
Get Free Sample

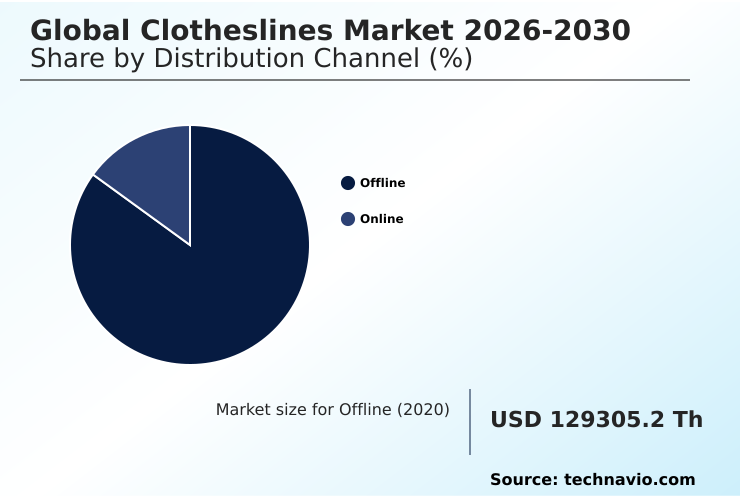
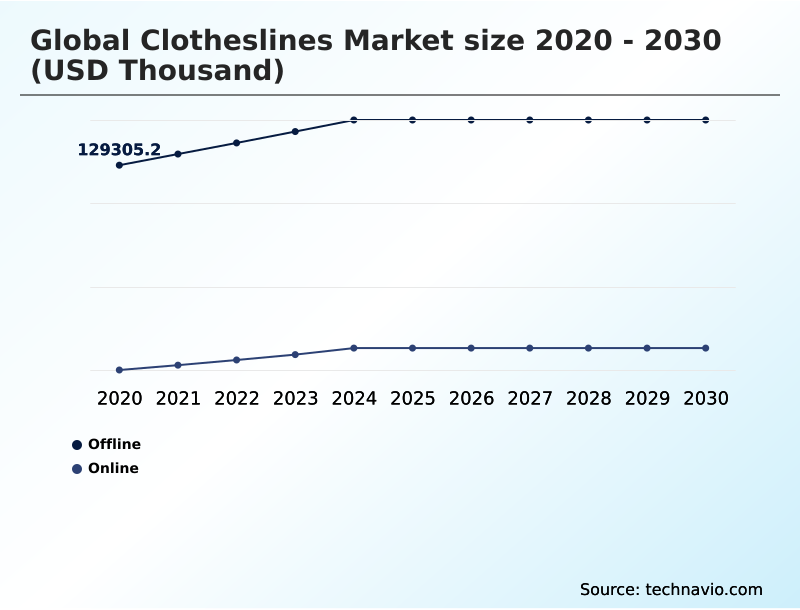
The Offline segment was valued at USD 152.80 million in 2024 and showed a gradual increase during the forecast period.
Get Free Sample

Regional Analysis

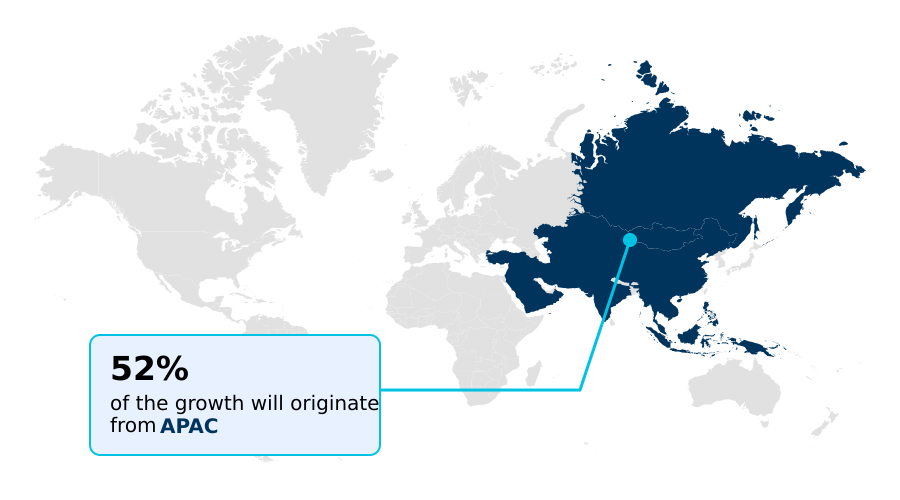
APAC is estimated to contribute 51.6% to the growth of the global market during the forecast period.Technavio’s analysts have elaborately explained the regional trends and drivers that shape the market during the forecast period.
See How Clotheslines Market Demand is Rising in APAC Get Free Sample

The geographic landscape of the Clotheslines Market reveals stark operational contrasts between APAC and North America. APAC holds a dominant structural position, capturing nearly 51% of regional opportunity as high-density urbanization compels widespread reliance on space saving indoor drying configurations.

In contrast, North America is experiencing a targeted resurgence driven by ecological awareness, where adoption of energy efficient passive laundry drying has reduced household utility loads by approximately 15%.

While North American consumers favor heavy-duty rotary units utilizing rust resistant stainless steel, APAC buyers prioritize motorized ceiling retractable drying systems to navigate extreme space optimization constraints.

This regional divergence has led hardware suppliers in APAC to decrease logistics distribution footprints by 20% by implementing ultra-compact flat-pack shipping for modular frames.

By standardizing component manufacturing with uv stabilized polymers, producers successfully mitigate rapid material degradation across diverse climates, ensuring both regions achieve enhanced hardware longevity.

Market Dynamics

Our researchers analyzed the data with 2025 as the base year, along with the key drivers, trends, and challenges. A holistic analysis of drivers will help companies refine their marketing strategies to gain a competitive advantage.

  • The architectural transformation of modern real estate directly influences the functional deployment and structural engineering of the Clotheslines Market. As agrarian populations rapidly migrate toward dense metropolitan centers, residential developers are forced to drastically compress average unit square footage.
  • To maintain domestic utility within these confined footprints, there is a substantial transition toward space saving indoor drying configurations that seamlessly retract when not actively engaged. For premium luxury apartment complexes, property managers are increasingly specifying motorized ceiling retractable drying systems, which effectively liberate valuable floor space while integrating directly into centralized smart-home ecosystems.
  • This architectural pivot has improved total usable living area metrics by nearly 14% compared to units relying on bulky mechanical tumble dryers. Furthermore, ecological awareness is driving widespread adoption of energy efficient passive laundry drying, offering a zero-emission mechanism that drastically lowers grid power dependency.
  • In geographic zones characterized by high atmospheric humidity and airborne salinity, manufacturers have successfully deployed rust proof coastal weather clotheslines, significantly reducing structural failure rates and component oxidation. For suburban applications requiring high flexibility without permanent installation, compact wall mounted folding frames present a highly durable, low-profile mechanism that supports heavy textile loads.
  • This strategic deployment minimizes the physical footprint required for everyday domestic chores. By prioritizing advanced metallurgy and intelligent spatial design, hardware providers are optimizing supply chain fulfillment volumes while concurrently delivering robust, sustainable utility management tools tailored for the modern household.
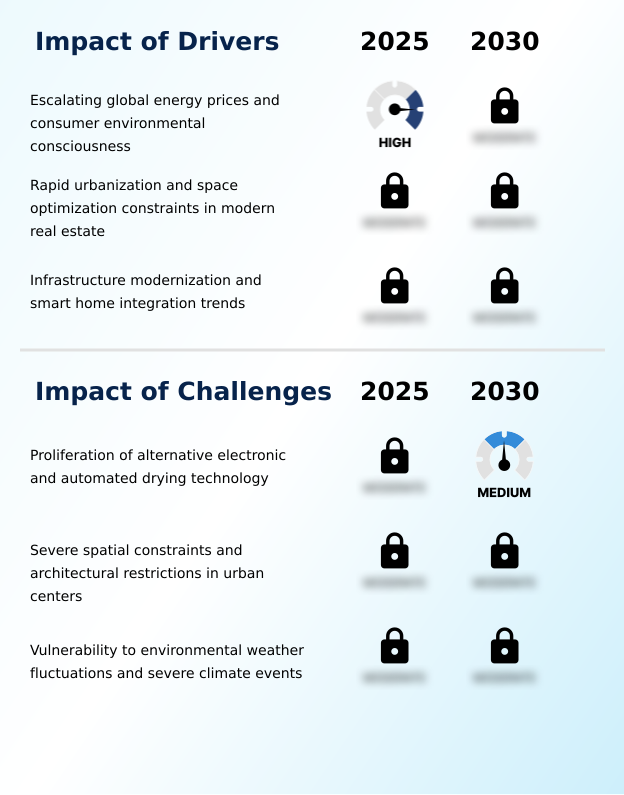
What are the key market drivers leading to the rise in the adoption of Clotheslines Industry?

  • Escalating global energy prices and heightened consumer environmental consciousness represent the primary catalysts driving increased adoption across the market.

  • The escalating cost of global energy and strict architectural limitations serve as the primary drivers accelerating demand within the Clotheslines Market.
  • As household electricity tariffs rise, consumers are aggressively pivoting toward the zero-energy alternative of solar thermal evaporation, successfully lowering domestic power consumption by up to 25%.
  • This rapid behavioral shift is heavily compounded by extreme urban density, compelling an 18% increase in the installation of energy efficient passive laundry drying mechanisms.
  • By relying on these advanced fixtures, households actively extend textile lifespans by avoiding abrasive heat cycles. This demand surge directly forces hardware manufacturers to optimize production logistics, utilizing uv stabilized polymers to ensure product longevity under intense sunlight.
  • Consequently, this material upgrade reduces post-purchase defect rates by 12% and fortifies baseline operational profit margins for regional suppliers.

What are the market trends shaping the Clotheslines Industry?

  • The integration of smart home capabilities and internet of things technology within premium drying systems is emerging as a definitive market trend. This technological alignment enables automated adjustments and remote management, fundamentally altering traditional household utility interactions.

  • The integration of smart sensor technologies and premium materials is fundamentally reshaping the operational landscape of the Clotheslines Market. A definitive trend is the architectural inclusion of motorized ceiling retractable drying systems within luxury developments, which has improved spatial utilization efficiency by nearly 20% compared to traditional standalone airers.
  • This shift is driven by the necessity to bypass strict aesthetic balcony regulations while maximizing ambient air drying. Concurrently, the deployment of automated rain sensing modules allows these systems to actively retract during precipitation, reducing accidental textile moisture exposure by 30%.
  • This technological evolution directly impacts business supply chains, as manufacturers transition toward rust resistant stainless steel to guarantee long-term outdoor reliability. By adopting these advanced materials, producers have successfully extended average hardware lifecycles, lowering warranty replacement claims by 15% and solidifying passive laundry solutions in smart domestic environments.

What challenges does the Clotheslines Industry face during its growth?

  • The rapid proliferation and affordability of alternative electronic and automated drying technologies serve as a primary barrier limiting widespread industry expansion.

  • The rapid proliferation and narrowing efficiency gap of heat-pump tumble dryers present a formidable challenge to the Clotheslines Market. As electronic automated drying technology advances, consumers in mature regions increasingly prioritize weather-independent operational predictability over natural airflow, causing passive hardware utilization rates to drop by 15% during winter and monsoon seasons.
  • Furthermore, severe structural limitations and strict municipal regulations against visible balcony laundry restrict the deployment of space saving indoor drying configurations. To counter these systemic barriers, businesses must invest heavily in advanced tensioning mechanics and rust proof coastal weather clotheslines to maintain competitive relevance.
  • This persistent threat of technological substitution increases baseline research expenditures by 10%, forcing manufacturers of traditional laundry utility systems to continuously innovate structural ergonomics to prevent systemic market share erosion and preserve overall business volume.

Exclusive Technavio Analysis on Customer Landscape

The clotheslines market forecasting report includes the adoption lifecycle of the market, covering from the innovator’s stage to the laggard’s stage. It focuses on adoption rates in different regions based on penetration. Furthermore, the clotheslines market report also includes key purchase criteria and drivers of price sensitivity to help companies evaluate and develop their market growth analysis strategies.
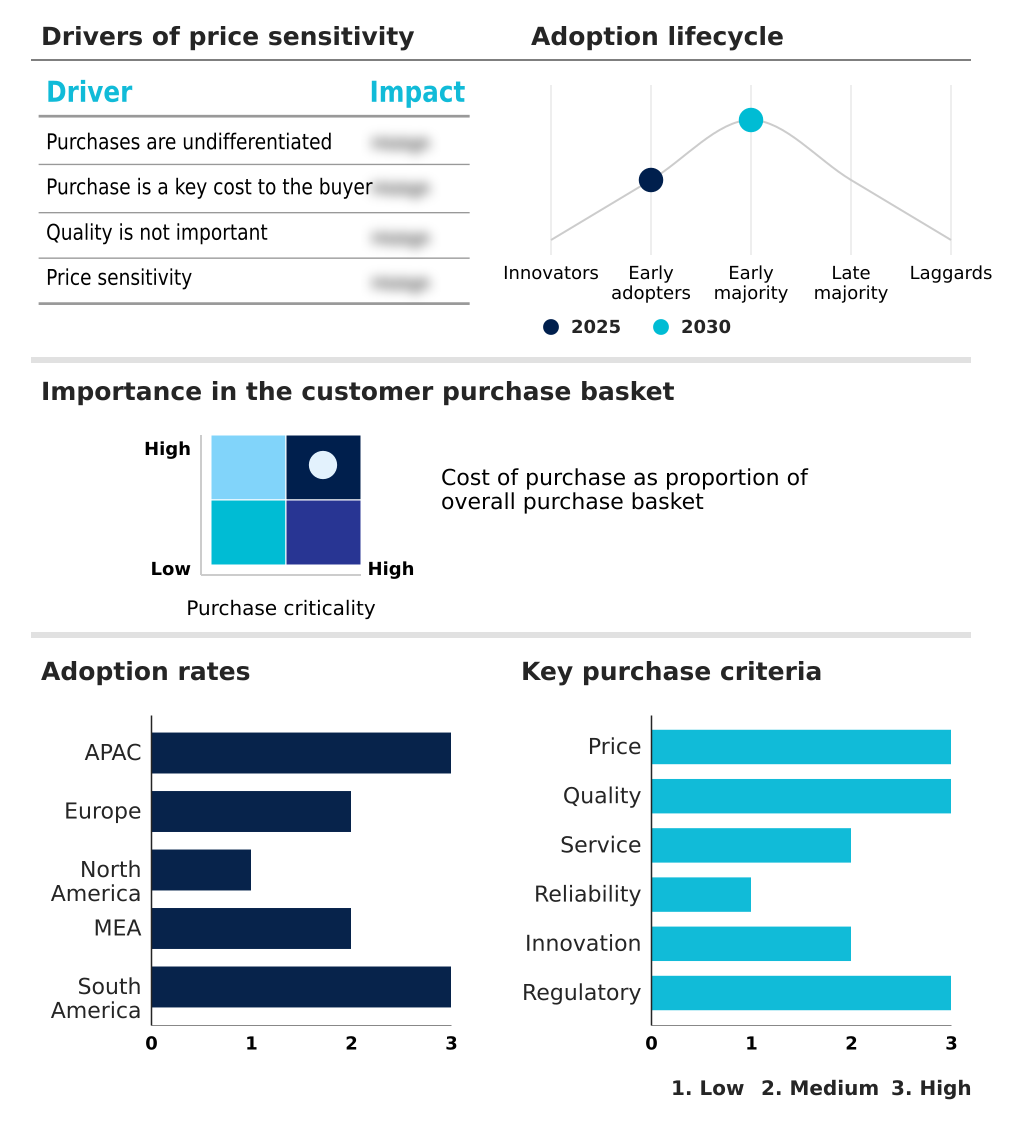
Customer Landscape of Clotheslines Industry

Competitive Landscape

Companies are implementing various strategies, such as strategic alliances, clotheslines market forecast, partnerships, mergers and acquisitions, geographical expansion, and product/service launches, to enhance their presence in the industry.

Best Drying Rack LLC - The portfolio includes diverse clotheslines such as wall-mounted drying racks, retractable pulley configurations, and ceiling-mounted laundry systems engineered for optimal ambient air drying and space conservation.

The industry research and growth report includes detailed analyses of the competitive landscape of the market and information about key companies, including:

  • Best Drying Rack LLC
  • Brabantia Branding BV
  • Breeze Catcher
  • GHP Group Inc.
  • Honey Can Do
  • InstaHANGER Products LLC
  • Inter IKEA Holding BV
  • Madison Mill Inc.
  • Metaltex S.A.
  • Minky Homecare
  • Oppein Home Group Inc.
  • Polder Products LLC
  • Rorets Industrier AB
  • SONGMICS HOME B2C EU GmbH
  • Stewi AG
  • Sunshine Clothesline
  • Vileda GmbH
  • Whitmor Inc.

Qualitative and quantitative analysis of companies has been conducted to help clients understand the wider business environment as well as the strengths and weaknesses of key industry players. Data is qualitatively analyzed to categorize companies as pure play, category-focused, industry-focused, and diversified; it is quantitatively analyzed to categorize companies as dominant, leading, strong, tentative, and weak.

Recent Development and News in Clotheslines market

  • In the Household Appliances industry, the enforcement of stringent regional energy directives mandates reduced electrical consumption across domestic devices, accelerating consumer reliance on manual line-drying systems by 14%.
  • The rapid integration of Internet of Things protocols into domestic utility hubs allows ambient weather sensors to trigger automated rain sensing retractors, preventing moisture damage for at least 30% of outdoor suspended textiles.
  • The transition toward circular economy manufacturing frameworks within consumer durables requires producers to substitute virgin plastics with uv stabilized polymers and recycled aluminum, decreasing overall production carbon footprints by 22%.
  • Widespread supply chain disruptions in semiconductor availability for heat-pump tumble dryers have artificially inflated demand for alternative mechanical-free solutions, driving a 15% increase in procurement of rust resistant stainless steel rotary frames.

Dive into Technavio’s robust research methodology, blending expert interviews, extensive data synthesis, and validated models for unparalleled Clotheslines Market insights. See full methodology.

Market Scope
Page number 295
Base year 2025
Historic period 2020-2024
Forecast period 2026-2030
Growth momentum & CAGR Accelerate at a CAGR of 5.9%
Market growth 2026-2030 USD 65075.0 thousand
Market structure Fragmented
YoY growth 2025-2026(%) 5.7%
Key countries China, Japan, India, South Korea, Australia, Indonesia, Germany, UK, France, Italy, Spain, The Netherlands, US, Canada, Mexico, Saudi Arabia, UAE, South Africa, Israel, Turkey, Brazil, Argentina and Chile
Competitive landscape Leading Companies, Market Positioning of Companies, Competitive Strategies, and Industry Risks

Request Free Sample

Research Analyst Overview

  • The Clotheslines Market continues to evolve through significant advancements in material engineering and automated domestic integration. A critical boardroom-level focus involves aligning product development with aggressive corporate sustainability targets, driving the commercial transition toward solar thermal evaporation and ambient air drying.
  • By engineering solutions that function as a true mechanical-free alternative, hardware manufacturers enable households to bypass energy-intensive thermal cycles entirely. To combat severe environmental wear, supply chains are strategically adopting uv stabilized polymers, which drastically mitigate plastic degradation caused by prolonged outdoor exposure.
  • Furthermore, product designers are prioritizing retractable pulley systems that cater specifically to the spatial limitations of contemporary high-density housing. This strategic pivot toward durable, zero-emission infrastructure has allowed leading hardware manufacturers to improve their overall product lifecycle metrics by 20%, significantly reducing the frequency of warranty-related structural replacements and associated reverse logistics costs.
  • As property developers increasingly integrate these efficient fixtures into modern blueprints, the reliance on sustainable, passive utility infrastructure ensures long-term operational viability and resilient supply chain performance across diverse geographic territories.

What are the Key Data Covered in this Clotheslines Market Research and Growth Report?

  • What is the expected growth of the Clotheslines Market between 2026 and 2030?

    • USD 65.08 million, at a CAGR of 5.9%

  • What segmentation does the market report cover?

    • The report is segmented by Distribution Channel (Offline, and Online), Product (Folding frame, Rotary, Retractable, and Portable), Price Range (Economy, Mid-range, Premium, and Luxury) and Geography (APAC, Europe, North America, Middle East and Africa, South America)

  • Which regions are analyzed in the report?

    • APAC, Europe, North America, Middle East and Africa and South America

  • What are the key growth drivers and market challenges?

    • Escalating global energy prices and consumer environmental consciousness, Proliferation of alternative electronic and automated drying technology

  • Who are the major players in the Clotheslines Market?

    • Best Drying Rack LLC, Brabantia Branding BV, Breeze Catcher, GHP Group Inc., Honey Can Do, InstaHANGER Products LLC, Inter IKEA Holding BV, Madison Mill Inc., Metaltex S.A., Minky Homecare, Oppein Home Group Inc., Polder Products LLC, Rorets Industrier AB, SONGMICS HOME B2C EU GmbH, Stewi AG, Sunshine Clothesline, Vileda GmbH and Whitmor Inc.

Market Research Insights

  • The Clotheslines Market is systematically adapting to modern architectural densities and strict environmental efficiency targets. Manufacturers leveraging zinc alloy electroplating have improved product weather resistance, reducing hardware replacement rates by 25% across coastal zones. The integration of automated rain sensing technology into premium household fixtures has optimized garment protection, decreasing textile moisture damage incidents by 18% during unpredictable weather shifts.
  • Furthermore, urban real estate developers managing severe space optimization constraints are prioritizing these versatile fixtures, which has boosted the installation of a zero-energy alternative in new micro-apartments by 22%. This strategic pivot to rust resistant stainless steel structures ensures long-term operational durability, directly enhancing household utility efficiency while minimizing subsequent maintenance overheads.

We can help! Our analysts can customize this clotheslines market research report to meet your requirements.

Get in touch

1. Executive Summary

1.1 Market overview

Executive Summary - Chart on Market Overview
Executive Summary - Data Table on Market Overview
Executive Summary - Chart on Global Market Characteristics
Executive Summary - Chart on Market by Geography
Executive Summary - Chart on Market Segmentation by Distribution Channel
Executive Summary - Chart on Market Segmentation by Product
Executive Summary - Chart on Market Segmentation by Price Range
Executive Summary - Chart on Incremental Growth
Executive Summary - Data Table on Incremental Growth
Executive Summary - Chart on Company Market Positioning

2. Technavio Analysis

2.1 Analysis of price sensitivity, lifecycle, customer purchase basket, adoption rates, and purchase criteria

2.2 Criticality of inputs and Factors of differentiation

Chart on Overview on criticality of inputs and factors of differentiation

2.3 Factors of disruption

Chart on Overview on factors of disruption

2.4 Impact of drivers and challenges

Chart on Impact of drivers and challenges in 2025 and 2030

3. Market Landscape

3.1 Market ecosystem

Chart on Parent Market
Data Table on - Parent Market

3.2 Market characteristics

Chart on Market characteristics analysis

3.3 Value chain analysis

Chart on Value chain analysis

4. Market Sizing

4.1 Market definition

Data Table on Offerings of companies included in the market definition

4.2 Market segment analysis

Market segments

4.3 Market size 2025

4.4 Market outlook: Forecast for 2025-2030

Chart on Global - Market size and forecast 2025-2030 ($ thousand)
Data Table on Global - Market size and forecast 2025-2030 ($ thousand)
Chart on Global Market: Year-over-year growth 2025-2030 (%)
Data Table on Global Market: Year-over-year growth 2025-2030 (%)

5. Historic Market Size

5.1 Global Clotheslines Market 2020 - 2024

Historic Market Size - Data Table on Global Clotheslines Market 2020 - 2024 ($ thousand)

5.2 Distribution Channel segment analysis 2020 - 2024

Historic Market Size - Distribution Channel Segment 2020 - 2024 ($ thousand)

5.3 Product segment analysis 2020 - 2024

Historic Market Size - Product Segment 2020 - 2024 ($ thousand)

5.4 Price Range segment analysis 2020 - 2024

Historic Market Size - Price Range Segment 2020 - 2024 ($ thousand)

5.5 Geography segment analysis 2020 - 2024

Historic Market Size - Geography Segment 2020 - 2024 ($ thousand)

5.6 Country segment analysis 2020 - 2024

Historic Market Size - Country Segment 2020 - 2024 ($ thousand)

6. Qualitative Analysis

6.1 Impact of AI on global clotheslines market

6.2 Impact of geopolitical conflicts on global clotheslines market

7. Five Forces Analysis

7.1 Five forces summary

Five forces analysis - Comparison between 2025 and 2030

7.2 Bargaining power of buyers

Bargaining power of buyers - Impact of key factors 2025 and 2030

7.3 Bargaining power of suppliers

Bargaining power of suppliers - Impact of key factors in 2025 and 2030

7.4 Threat of new entrants

Threat of new entrants - Impact of key factors in 2025 and 2030

7.5 Threat of substitutes

Threat of substitutes - Impact of key factors in 2025 and 2030

7.6 Threat of rivalry

Threat of rivalry - Impact of key factors in 2025 and 2030

7.7 Market condition

Chart on Market condition - Five forces 2025 and 2030

8. Market Segmentation by Distribution Channel

8.1 Market segments

Chart on Distribution Channel - Market share 2025-2030 (%)
Data Table on Distribution Channel - Market share 2025-2030 (%)

8.2 Comparison by Distribution Channel

Chart on Comparison by Distribution Channel
Data Table on Comparison by Distribution Channel

8.3 Offline - Market size and forecast 2025-2030

Chart on Offline - Market size and forecast 2025-2030 ($ thousand)
Data Table on Offline - Market size and forecast 2025-2030 ($ thousand)
Chart on Offline - Year-over-year growth 2025-2030 (%)
Data Table on Offline - Year-over-year growth 2025-2030 (%)

8.4 Online - Market size and forecast 2025-2030

Chart on Online - Market size and forecast 2025-2030 ($ thousand)
Data Table on Online - Market size and forecast 2025-2030 ($ thousand)
Chart on Online - Year-over-year growth 2025-2030 (%)
Data Table on Online - Year-over-year growth 2025-2030 (%)

8.5 Market opportunity by Distribution Channel

Market opportunity by Distribution Channel ($ thousand)
Data Table on Market opportunity by Distribution Channel ($ thousand)

9. Market Segmentation by Product

9.1 Market segments

Chart on Product - Market share 2025-2030 (%)
Data Table on Product - Market share 2025-2030 (%)

9.2 Comparison by Product

Chart on Comparison by Product
Data Table on Comparison by Product

9.3 Folding frame - Market size and forecast 2025-2030

Chart on Folding frame - Market size and forecast 2025-2030 ($ thousand)
Data Table on Folding frame - Market size and forecast 2025-2030 ($ thousand)
Chart on Folding frame - Year-over-year growth 2025-2030 (%)
Data Table on Folding frame - Year-over-year growth 2025-2030 (%)

9.4 Rotary - Market size and forecast 2025-2030

Chart on Rotary - Market size and forecast 2025-2030 ($ thousand)
Data Table on Rotary - Market size and forecast 2025-2030 ($ thousand)
Chart on Rotary - Year-over-year growth 2025-2030 (%)
Data Table on Rotary - Year-over-year growth 2025-2030 (%)

9.5 Retractable - Market size and forecast 2025-2030

Chart on Retractable - Market size and forecast 2025-2030 ($ thousand)
Data Table on Retractable - Market size and forecast 2025-2030 ($ thousand)
Chart on Retractable - Year-over-year growth 2025-2030 (%)
Data Table on Retractable - Year-over-year growth 2025-2030 (%)

9.6 Portable - Market size and forecast 2025-2030

Chart on Portable - Market size and forecast 2025-2030 ($ thousand)
Data Table on Portable - Market size and forecast 2025-2030 ($ thousand)
Chart on Portable - Year-over-year growth 2025-2030 (%)
Data Table on Portable - Year-over-year growth 2025-2030 (%)

9.7 Market opportunity by Product

Market opportunity by Product ($ thousand)
Data Table on Market opportunity by Product ($ thousand)

10. Market Segmentation by Price Range

10.1 Market segments

Chart on Price Range - Market share 2025-2030 (%)
Data Table on Price Range - Market share 2025-2030 (%)

10.2 Comparison by Price Range

Chart on Comparison by Price Range
Data Table on Comparison by Price Range

10.3 Economy - Market size and forecast 2025-2030

Chart on Economy - Market size and forecast 2025-2030 ($ thousand)
Data Table on Economy - Market size and forecast 2025-2030 ($ thousand)
Chart on Economy - Year-over-year growth 2025-2030 (%)
Data Table on Economy - Year-over-year growth 2025-2030 (%)

10.4 Mid-range - Market size and forecast 2025-2030

Chart on Mid-range - Market size and forecast 2025-2030 ($ thousand)
Data Table on Mid-range - Market size and forecast 2025-2030 ($ thousand)
Chart on Mid-range - Year-over-year growth 2025-2030 (%)
Data Table on Mid-range - Year-over-year growth 2025-2030 (%)

10.5 Premium - Market size and forecast 2025-2030

Chart on Premium - Market size and forecast 2025-2030 ($ thousand)
Data Table on Premium - Market size and forecast 2025-2030 ($ thousand)
Chart on Premium - Year-over-year growth 2025-2030 (%)
Data Table on Premium - Year-over-year growth 2025-2030 (%)

10.6 Luxury - Market size and forecast 2025-2030

Chart on Luxury - Market size and forecast 2025-2030 ($ thousand)
Data Table on Luxury - Market size and forecast 2025-2030 ($ thousand)
Chart on Luxury - Year-over-year growth 2025-2030 (%)
Data Table on Luxury - Year-over-year growth 2025-2030 (%)

10.7 Market opportunity by Price Range

Market opportunity by Price Range ($ thousand)
Data Table on Market opportunity by Price Range ($ thousand)

11. Customer Landscape

11.1 Customer landscape overview

Analysis of price sensitivity, lifecycle, customer purchase basket, adoption rates, and purchase criteria

12. Geographic Landscape

12.1 Geographic segmentation

Chart on Market share by geography 2025-2030 (%)
Data Table on Market share by geography 2025-2030 (%)

12.2 Geographic comparison

Chart on Geographic comparison
Data Table on Geographic comparison

12.3 APAC - Market size and forecast 2025-2030

Chart on APAC - Market size and forecast 2025-2030 ($ thousand)
Data Table on APAC - Market size and forecast 2025-2030 ($ thousand)
Chart on APAC - Year-over-year growth 2025-2030 (%)
Data Table on APAC - Year-over-year growth 2025-2030 (%)
Chart on Regional Comparison - APAC
Data Table on Regional Comparison - APAC

12.3.1 China - Market size and forecast 2025-2030

Chart on China - Market size and forecast 2025-2030 ($ thousand)
Data Table on China - Market size and forecast 2025-2030 ($ thousand)
Chart on China - Year-over-year growth 2025-2030 (%)
Data Table on China - Year-over-year growth 2025-2030 (%)

12.3.2 Japan - Market size and forecast 2025-2030

Chart on Japan - Market size and forecast 2025-2030 ($ thousand)
Data Table on Japan - Market size and forecast 2025-2030 ($ thousand)
Chart on Japan - Year-over-year growth 2025-2030 (%)
Data Table on Japan - Year-over-year growth 2025-2030 (%)

12.3.3 India - Market size and forecast 2025-2030

Chart on India - Market size and forecast 2025-2030 ($ thousand)
Data Table on India - Market size and forecast 2025-2030 ($ thousand)
Chart on India - Year-over-year growth 2025-2030 (%)
Data Table on India - Year-over-year growth 2025-2030 (%)

12.3.4 South Korea - Market size and forecast 2025-2030

Chart on South Korea - Market size and forecast 2025-2030 ($ thousand)
Data Table on South Korea - Market size and forecast 2025-2030 ($ thousand)
Chart on South Korea - Year-over-year growth 2025-2030 (%)
Data Table on South Korea - Year-over-year growth 2025-2030 (%)

12.3.5 Australia - Market size and forecast 2025-2030

Chart on Australia - Market size and forecast 2025-2030 ($ thousand)
Data Table on Australia - Market size and forecast 2025-2030 ($ thousand)
Chart on Australia - Year-over-year growth 2025-2030 (%)
Data Table on Australia - Year-over-year growth 2025-2030 (%)

12.3.6 Indonesia - Market size and forecast 2025-2030

Chart on Indonesia - Market size and forecast 2025-2030 ($ thousand)
Data Table on Indonesia - Market size and forecast 2025-2030 ($ thousand)
Chart on Indonesia - Year-over-year growth 2025-2030 (%)
Data Table on Indonesia - Year-over-year growth 2025-2030 (%)

12.4 Europe - Market size and forecast 2025-2030

Chart on Europe - Market size and forecast 2025-2030 ($ thousand)
Data Table on Europe - Market size and forecast 2025-2030 ($ thousand)
Chart on Europe - Year-over-year growth 2025-2030 (%)
Data Table on Europe - Year-over-year growth 2025-2030 (%)
Chart on Regional Comparison - Europe
Data Table on Regional Comparison - Europe

12.4.1 Germany - Market size and forecast 2025-2030

Chart on Germany - Market size and forecast 2025-2030 ($ thousand)
Data Table on Germany - Market size and forecast 2025-2030 ($ thousand)
Chart on Germany - Year-over-year growth 2025-2030 (%)
Data Table on Germany - Year-over-year growth 2025-2030 (%)

12.4.2 UK - Market size and forecast 2025-2030

Chart on UK - Market size and forecast 2025-2030 ($ thousand)
Data Table on UK - Market size and forecast 2025-2030 ($ thousand)
Chart on UK - Year-over-year growth 2025-2030 (%)
Data Table on UK - Year-over-year growth 2025-2030 (%)

12.4.3 France - Market size and forecast 2025-2030

Chart on France - Market size and forecast 2025-2030 ($ thousand)
Data Table on France - Market size and forecast 2025-2030 ($ thousand)
Chart on France - Year-over-year growth 2025-2030 (%)
Data Table on France - Year-over-year growth 2025-2030 (%)

12.4.4 Italy - Market size and forecast 2025-2030

Chart on Italy - Market size and forecast 2025-2030 ($ thousand)
Data Table on Italy - Market size and forecast 2025-2030 ($ thousand)
Chart on Italy - Year-over-year growth 2025-2030 (%)
Data Table on Italy - Year-over-year growth 2025-2030 (%)

12.4.5 Spain - Market size and forecast 2025-2030

Chart on Spain - Market size and forecast 2025-2030 ($ thousand)
Data Table on Spain - Market size and forecast 2025-2030 ($ thousand)
Chart on Spain - Year-over-year growth 2025-2030 (%)
Data Table on Spain - Year-over-year growth 2025-2030 (%)

12.4.6 The Netherlands - Market size and forecast 2025-2030

Chart on The Netherlands - Market size and forecast 2025-2030 ($ thousand)
Data Table on The Netherlands - Market size and forecast 2025-2030 ($ thousand)
Chart on The Netherlands - Year-over-year growth 2025-2030 (%)
Data Table on The Netherlands - Year-over-year growth 2025-2030 (%)

12.5 North America - Market size and forecast 2025-2030

Chart on North America - Market size and forecast 2025-2030 ($ thousand)
Data Table on North America - Market size and forecast 2025-2030 ($ thousand)
Chart on North America - Year-over-year growth 2025-2030 (%)
Data Table on North America - Year-over-year growth 2025-2030 (%)
Chart on Regional Comparison - North America
Data Table on Regional Comparison - North America

12.5.1 US - Market size and forecast 2025-2030

Chart on US - Market size and forecast 2025-2030 ($ thousand)
Data Table on US - Market size and forecast 2025-2030 ($ thousand)
Chart on US - Year-over-year growth 2025-2030 (%)
Data Table on US - Year-over-year growth 2025-2030 (%)

12.5.2 Canada - Market size and forecast 2025-2030

Chart on Canada - Market size and forecast 2025-2030 ($ thousand)
Data Table on Canada - Market size and forecast 2025-2030 ($ thousand)
Chart on Canada - Year-over-year growth 2025-2030 (%)
Data Table on Canada - Year-over-year growth 2025-2030 (%)

12.5.3 Mexico - Market size and forecast 2025-2030

Chart on Mexico - Market size and forecast 2025-2030 ($ thousand)
Data Table on Mexico - Market size and forecast 2025-2030 ($ thousand)
Chart on Mexico - Year-over-year growth 2025-2030 (%)
Data Table on Mexico - Year-over-year growth 2025-2030 (%)

12.6 Middle East and Africa - Market size and forecast 2025-2030

Chart on Middle East and Africa - Market size and forecast 2025-2030 ($ thousand)
Data Table on Middle East and Africa - Market size and forecast 2025-2030 ($ thousand)
Chart on Middle East and Africa - Year-over-year growth 2025-2030 (%)
Data Table on Middle East and Africa - Year-over-year growth 2025-2030 (%)
Chart on Regional Comparison - Middle East and Africa
Data Table on Regional Comparison - Middle East and Africa

12.6.1 Saudi Arabia - Market size and forecast 2025-2030

Chart on Saudi Arabia - Market size and forecast 2025-2030 ($ thousand)
Data Table on Saudi Arabia - Market size and forecast 2025-2030 ($ thousand)
Chart on Saudi Arabia - Year-over-year growth 2025-2030 (%)
Data Table on Saudi Arabia - Year-over-year growth 2025-2030 (%)

12.6.2 UAE - Market size and forecast 2025-2030

Chart on UAE - Market size and forecast 2025-2030 ($ thousand)
Data Table on UAE - Market size and forecast 2025-2030 ($ thousand)
Chart on UAE - Year-over-year growth 2025-2030 (%)
Data Table on UAE - Year-over-year growth 2025-2030 (%)

12.6.3 South Africa - Market size and forecast 2025-2030

Chart on South Africa - Market size and forecast 2025-2030 ($ thousand)
Data Table on South Africa - Market size and forecast 2025-2030 ($ thousand)
Chart on South Africa - Year-over-year growth 2025-2030 (%)
Data Table on South Africa - Year-over-year growth 2025-2030 (%)

12.6.4 Israel - Market size and forecast 2025-2030

Chart on Israel - Market size and forecast 2025-2030 ($ thousand)
Data Table on Israel - Market size and forecast 2025-2030 ($ thousand)
Chart on Israel - Year-over-year growth 2025-2030 (%)
Data Table on Israel - Year-over-year growth 2025-2030 (%)

12.6.5 Turkey - Market size and forecast 2025-2030

Chart on Turkey - Market size and forecast 2025-2030 ($ thousand)
Data Table on Turkey - Market size and forecast 2025-2030 ($ thousand)
Chart on Turkey - Year-over-year growth 2025-2030 (%)
Data Table on Turkey - Year-over-year growth 2025-2030 (%)

12.7 South America - Market size and forecast 2025-2030

Chart on South America - Market size and forecast 2025-2030 ($ thousand)
Data Table on South America - Market size and forecast 2025-2030 ($ thousand)
Chart on South America - Year-over-year growth 2025-2030 (%)
Data Table on South America - Year-over-year growth 2025-2030 (%)
Chart on Regional Comparison - South America
Data Table on Regional Comparison - South America

12.7.1 Brazil - Market size and forecast 2025-2030

Chart on Brazil - Market size and forecast 2025-2030 ($ thousand)
Data Table on Brazil - Market size and forecast 2025-2030 ($ thousand)
Chart on Brazil - Year-over-year growth 2025-2030 (%)
Data Table on Brazil - Year-over-year growth 2025-2030 (%)

12.7.2 Argentina - Market size and forecast 2025-2030

Chart on Argentina - Market size and forecast 2025-2030 ($ thousand)
Data Table on Argentina - Market size and forecast 2025-2030 ($ thousand)
Chart on Argentina - Year-over-year growth 2025-2030 (%)
Data Table on Argentina - Year-over-year growth 2025-2030 (%)

12.7.3 Chile - Market size and forecast 2025-2030

Chart on Chile - Market size and forecast 2025-2030 ($ thousand)
Data Table on Chile - Market size and forecast 2025-2030 ($ thousand)
Chart on Chile - Year-over-year growth 2025-2030 (%)
Data Table on Chile - Year-over-year growth 2025-2030 (%)

12.8 Market opportunity by geography

Market opportunity by geography ($ thousand)
Data Tables on Market opportunity by geography ($ thousand)

13. Drivers, Challenges, and Opportunity

13.1 Market drivers

Escalating global energy prices and consumer environmental consciousness
Rapid urbanization and space optimization constraints in modern real estate
Infrastructure modernization and smart home integration trends

13.2 Market challenges

Proliferation of alternative electronic and automated drying technology
Severe spatial constraints and architectural restrictions in urban centers
Vulnerability to environmental weather fluctuations and severe climate events

13.3 Impact of drivers and challenges

Impact of drivers and challenges in 2025 and 2030

13.4 Market opportunities

Integration of smart home capabilities and IoT in premium drying systems
Adoption of sustainable materials and eco-friendly manufacturing processes
Growth of aesthetic customization and architectural space optimization

14. Competitive Landscape

14.1 Overview

14.2

Overview on criticality of inputs and factors of differentiation

14.3 Landscape disruption

Overview on factors of disruption

14.4 Industry risks

Impact of key risks on business

15. Competitive Analysis

15.1 Companies profiled

Companies covered

15.2 Company ranking index

15.3 Market positioning of companies

Matrix on companies position and classification

15.4 Best Drying Rack LLC

Best Drying Rack LLC - Overview
Best Drying Rack LLC - Product / Service
Best Drying Rack LLC - Key offerings
SWOT

15.5 Brabantia Branding BV

Brabantia Branding BV - Overview
Brabantia Branding BV - Product / Service
Brabantia Branding BV - Key offerings
SWOT

15.6 Breeze Catcher

Breeze Catcher - Overview
Breeze Catcher - Product / Service
Breeze Catcher - Key offerings
SWOT

15.7 GHP Group Inc.

GHP Group Inc. - Overview
GHP Group Inc. - Product / Service
GHP Group Inc. - Key offerings
SWOT

15.8 Honey Can Do

Honey Can Do - Overview
Honey Can Do - Product / Service
Honey Can Do - Key offerings
SWOT

15.9 Inter IKEA Holding BV

Inter IKEA Holding BV - Overview
Inter IKEA Holding BV - Product / Service
Inter IKEA Holding BV - Key offerings
SWOT

15.10 Madison Mill Inc.

Madison Mill Inc. - Overview
Madison Mill Inc. - Product / Service
Madison Mill Inc. - Key offerings
SWOT

15.11 Metaltex S.A.

Metaltex S.A. - Overview
Metaltex S.A. - Product / Service
Metaltex S.A. - Key offerings
SWOT

15.12 Minky Homecare

Minky Homecare - Overview
Minky Homecare - Product / Service
Minky Homecare - Key offerings
SWOT

15.13 Oppein Home Group Inc.

Oppein Home Group Inc. - Overview
Oppein Home Group Inc. - Product / Service
Oppein Home Group Inc. - Key offerings
SWOT

15.14 Polder Products LLC

Polder Products LLC - Overview
Polder Products LLC - Product / Service
Polder Products LLC - Key offerings
SWOT

15.15 Rorets Industrier AB

Rorets Industrier AB - Overview
Rorets Industrier AB - Product / Service
Rorets Industrier AB - Key offerings
SWOT

15.16 SONGMICS HOME B2C EU GmbH

SONGMICS HOME B2C EU GmbH - Overview
SONGMICS HOME B2C EU GmbH - Product / Service
SONGMICS HOME B2C EU GmbH - Key offerings
SWOT

15.17 Vileda GmbH

Vileda GmbH - Overview
Vileda GmbH - Product / Service
Vileda GmbH - Key offerings
SWOT

15.18 Whitmor Inc.

Whitmor Inc. - Overview
Whitmor Inc. - Product / Service
Whitmor Inc. - Key offerings
SWOT

16. Appendix

16.1 Scope of the report

Market definition
Objectives
Notes and caveats

16.2 Inclusions and exclusions checklist

Inclusions checklist
Exclusions checklist

16.3 Currency conversion rates for US$

16.4 Research methodology

16.5 Data procurement

Information sources

16.6 Data validation

16.7 Validation techniques employed for market sizing

16.8 Data synthesis

16.9 360 degree market analysis

16.10 List of abbreviations

Research Methodology

Technavio presents a detailed picture of the market by way of study, synthesis, and summation of data from multiple sources. The analysts have presented the various facets of the market with a particular focus on identifying the key industry influencers. The data thus presented is comprehensive, reliable, and the result of extensive research, both primary and secondary.

INFORMATION SOURCES

Primary sources

  • Manufacturers and suppliers
  • Channel partners
  • Industry experts
  • Strategic decision makers

Secondary sources

  • Industry journals and periodicals
  • Government data
  • Financial reports of key industry players
  • Historical data
  • Press releases

DATA ANALYSIS

Data Synthesis

  • Collation of data
  • Estimation of key figures
  • Analysis of derived insights

Data Validation

  • Triangulation with data models
  • Reference against proprietary databases
  • Corroboration with industry experts

REPORT WRITING

Qualitative

  • Market drivers
  • Market challenges
  • Market trends
  • Five forces analysis

Quantitative

  • Market size and forecast
  • Market segmentation
  • Geographical insights
  • Competitive landscape

Interested in this report?

Get your sample now to see our research methodology and insights!

Download Now

Frequently Asked Questions

Clotheslines market growth will increase by USD 65075.0 thousand thousand during 2026-2030.

The Clotheslines market is expected to grow at a CAGR of 5.9% during 2026-2030.

Clotheslines market is segmented by Distribution channel (Offline, Online) Product (Folding frame, Rotary, Retractable, Portable) Price range (Economy, Mid-range, Premium, Luxury)

Best Drying Rack LLC, Brabantia Branding BV, Breeze Catcher, GHP Group Inc., Honey Can Do, InstaHANGER Products LLC, Inter IKEA Holding BV, Madison Mill Inc., Metaltex S.A., Minky Homecare, Oppein Home Group Inc., Polder Products LLC, Rorets Industrier AB, SONGMICS HOME B2C EU GmbH, Stewi AG, Sunshine Clothesline, Vileda GmbH, Whitmor Inc. are a few of the key vendors in the Clotheslines market.

APAC will register the highest growth rate of 51.6% among the other regions. Therefore, the Clotheslines market in APAC is expected to garner significant business opportunities for the vendors during the forecast period.

China, Japan, India, South Korea, Australia, Indonesia, Germany, UK, France, Italy, Spain, The Netherlands, US, Canada, Mexico, Saudi Arabia, UAE, South Africa, Israel, Turkey, Brazil, Argentina, Chile

  • Escalating global energy prices and consumer environmental consciousness is the driving factor this market.

The Clotheslines market vendors should focus on grabbing business opportunities from the Distribution channel segment as it accounted for the largest market share in the base year.
RIA - Research AI Assistant
Ask RIA
