US Household Appliances Market Size 2026-2030
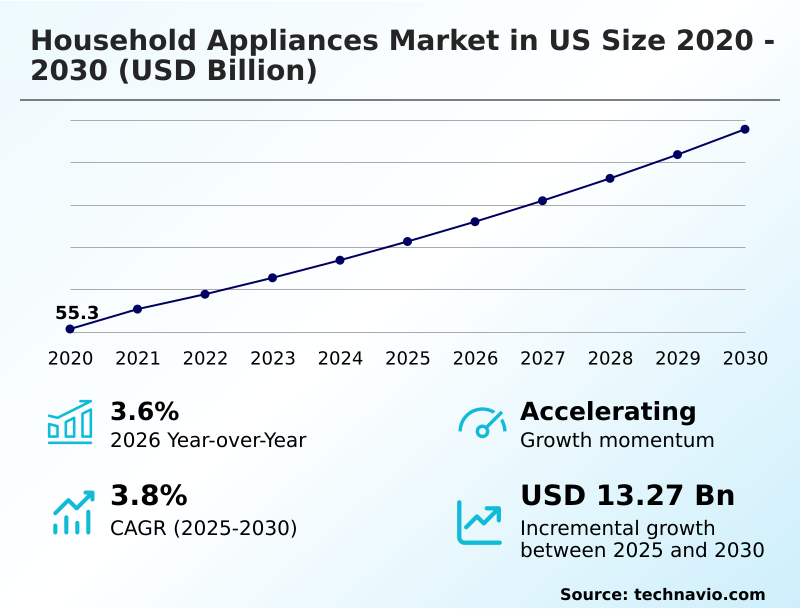
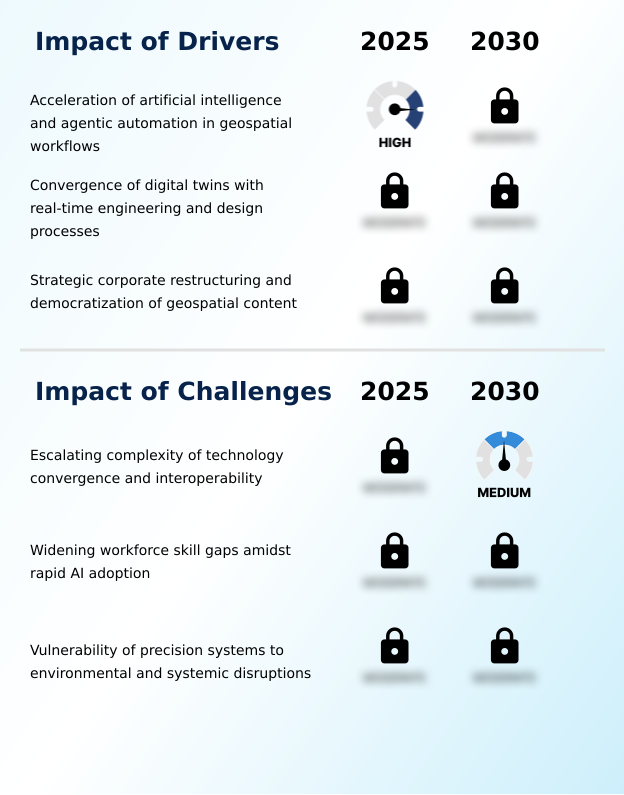
The us household appliances market size is valued to increase by USD 13.27 billion, at a CAGR of 3.8% from 2025 to 2030. Acceleration of artificial intelligence and agentic automation in geospatial workflows will drive the us household appliances market.
Major Market Trends & Insights
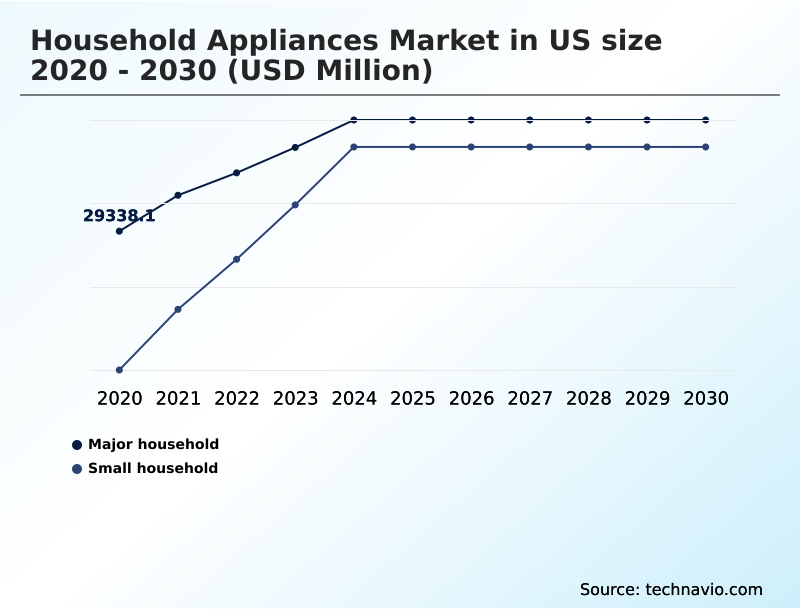
- By Product - Major household segment was valued at USD 32.04 billion in 2024
- By Distribution Channel - Offline segment accounted for the largest market revenue share in 2024
Market Size & Forecast
- Market Opportunities: USD 23.61 billion
- Market Future Opportunities: USD 13.27 billion
- CAGR from 2025 to 2030 : 3.8%
Market Summary
- The household appliances market in US is characterized by rapid technological evolution, where the focus is shifting from standalone devices to an integrated smart home ecosystem. Key drivers include the consumer demand for convenience, energy efficiency, and enhanced hygiene, spurring innovations in agentic artificial intelligence and connected appliances.
- This trend is creating a new replacement cycle based on technological obsolescence rather than mechanical failure. However, the industry faces significant hurdles from supply chain logistics volatility and unpredictable regulatory shifts, such as fluctuating energy efficiency mandates.
- For instance, a manufacturer may invest heavily in developing a new line of high-efficiency tankless water heaters to meet upcoming standards, only for those standards to be suspended, stranding R&D capital and forcing a strategic pivot. This dynamic environment compels companies to balance long-term innovation in areas like induction cooktops and ventless dryers with the need for operational agility.
- Success depends on creating a resilient value chain that can adapt to both technological opportunities and external market pressures, turning challenges into a competitive advantage through strategic foresight and flexible production capabilities.
What will be the Size of the US Household Appliances Market during the forecast period?
Get Key Insights on Market Forecast (PDF) Get Free Sample
How is the US Household Appliances Market Segmented?
The us household appliances industry research report provides comprehensive data (region-wise segment analysis), with forecasts and estimates in "USD million" for the period 2026-2030, as well as historical data from 2020-2024 for the following segments.
- Product
- Small household
- Major household
- Distribution channel
- Offline
- Online
- Price
- Mid-range
- Value-based
- Premium
- Geography
- North America
- US
- North America
By Product Insights
The small household segment is estimated to witness significant growth during the forecast period.
The small household appliances segment is undergoing a significant transformation, driven by advancements in robotic automation and a push toward premium, design-forward culinary tools.
Innovations in autonomous navigation systems and debris-compacting systems are enhancing user convenience in floor care, with proactive customer support becoming a key differentiator.
For instance, the latest robotic vacuums feature AI-driven diagnostics that can identify and resolve issues with minimal user input.
This trend extends to kitchenware, where the focus is on both performance and aesthetics, exemplified by the rise of multi-functional kitchen appliances. The integration of advanced features, such as precise temperature controls in espresso machines, reflects a broader market shift.
This evolution is supported by the diy appliance repair movement and a growing interest in the appliance-as-a-service model, reshaping consumer expectations and creating new revenue streams for manufacturers.
The emphasis on both advanced filtration systems and hvac systems highlights a holistic approach to home environment management.
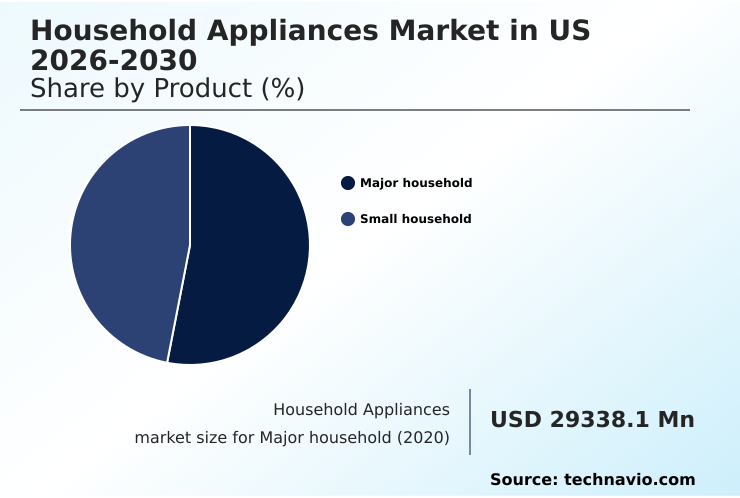
The Small household segment was valued at USD 32.04 billion in 2024 and showed a gradual increase during the forecast period.
Market Dynamics
Our researchers analyzed the data with 2025 as the base year, along with the key drivers, trends, and challenges. A holistic analysis of drivers will help companies refine their marketing strategies to gain a competitive advantage.
- The household appliances market in US is evolving beyond simple hardware sales into a complex ecosystem of interconnected services and intelligent devices. A central theme is the comparison of core technologies, such as evaluating bldc motor efficiency vs inverter performance in refrigeration and laundry units, or the tangible benefits of heat pump vs condenser dryer energy usage.
- These technical considerations are now intertwined with software capabilities, including the effectiveness of ai food recognition for meal planning, which directly impacts consumer engagement. The integration of a refrigerator with an integrated family hub screen transforms a kitchen appliance into a central command center for the household.
- As devices become more sophisticated, so do consumer concerns, bringing issues like smart refrigerator privacy concerns to the forefront. This has led manufacturers to offer enhanced subscription models for premium appliances, providing ongoing software updates and support.
- The market is also seeing a diversification of form factors, with the air fryer toaster oven combo features appealing to consumers seeking multi-functionality in smaller spaces. Similarly, the growing demand for robotic vacuums with self-emptying docks underscores the desire for automation.
- This shift is mirrored in the retail and support sectors, where appliance supply chain disruption solutions are becoming critical, with some logistics providers improving on-time delivery rates by over 10% compared to previous benchmarks.
What are the key market drivers leading to the rise in the adoption of US Household Appliances Industry?
- The acceleration of artificial intelligence and agentic automation in household appliances is a key driver for market growth.
- Market growth is significantly propelled by the dual drivers of sustainability and advanced technological integration.
- The consumer demand for resource efficiency is accelerating the adoption of heat pump technology and closed-loop water systems, with new high-efficiency washer-dryer combos reducing energy consumption by over 40%.
- This aligns with broader circular economy principles and a focus on product lifecycle management.
- Concurrently, the integration of ai vision inside technology and other forms of generative ai is transforming appliances into proactive home assistants, capable of tasks like automated food inventory management. This functionality can decrease household food waste by up to 15%.
- This smart home ecosystem is further supported by demand response programs and enhanced by features like steam sanitization and voice-activated appliance control, which address growing consumer priorities for both convenience and wellness.
- These drivers are compelling manufacturers to innovate rapidly, creating a market where software and hardware advancements are equally critical.
What are the market trends shaping the US Household Appliances Industry?
- A key market trend is the integration of agentic artificial intelligence and autonomous systems. This development is transforming device functionality and user interaction within the home environment.
- Key trends are reshaping the market, driven by the convergence of AI, design, and user-centric functionality. The move toward on-device intelligence is paramount, with appliances featuring embedded neural processing units to deliver hyper-personalized experiences, a significant leap from basic IoT platform connectivity. This trend manifests in features like ai-powered recipe generation, which can improve user engagement by 25%.
- Simultaneously, there's a strong push for seamless architectural integration, with innovations like zero clearance hinge technology reducing installation gaps by over 90% compared to traditional designs. This focus on built-in appliance aesthetics is critical in modern home design. Furthermore, the rise of customizable appliance panels allows for personalization previously available only through high-end custom work.
- This combination of smart home security integration, sophisticated iot platform capabilities, and aesthetic flexibility is creating a new paradigm for product development.
What challenges does the US Household Appliances Industry face during its growth?
- The escalating complexity of technology convergence and interoperability presents a key challenge affecting industry growth.
- The market faces considerable challenges from supply chain fragility and regulatory uncertainty, which disrupt strategic planning. The reliance on global logistics makes the industry vulnerable to sudden cost escalations, such as a 50% tariff on essential components, which directly impacts last-mile delivery economics. In response, some firms are investing in reshoring production, though this presents its own hurdles.
- The need for remote diagnostics and robust appliance cybersecurity is becoming more critical as connectivity deepens, yet right-to-repair legislation impact creates complexity for service models. Furthermore, the retail landscape is contracting, with stricter policies like 48-hour return windows shifting risk to manufacturers and potentially increasing warranty claims by over 10%.
- These pressures are compounded by the technical demands of creating seamless smart appliance interoperability and managing data privacy in smart homes, making operational agility a key survival factor.
Exclusive Technavio Analysis on Customer Landscape
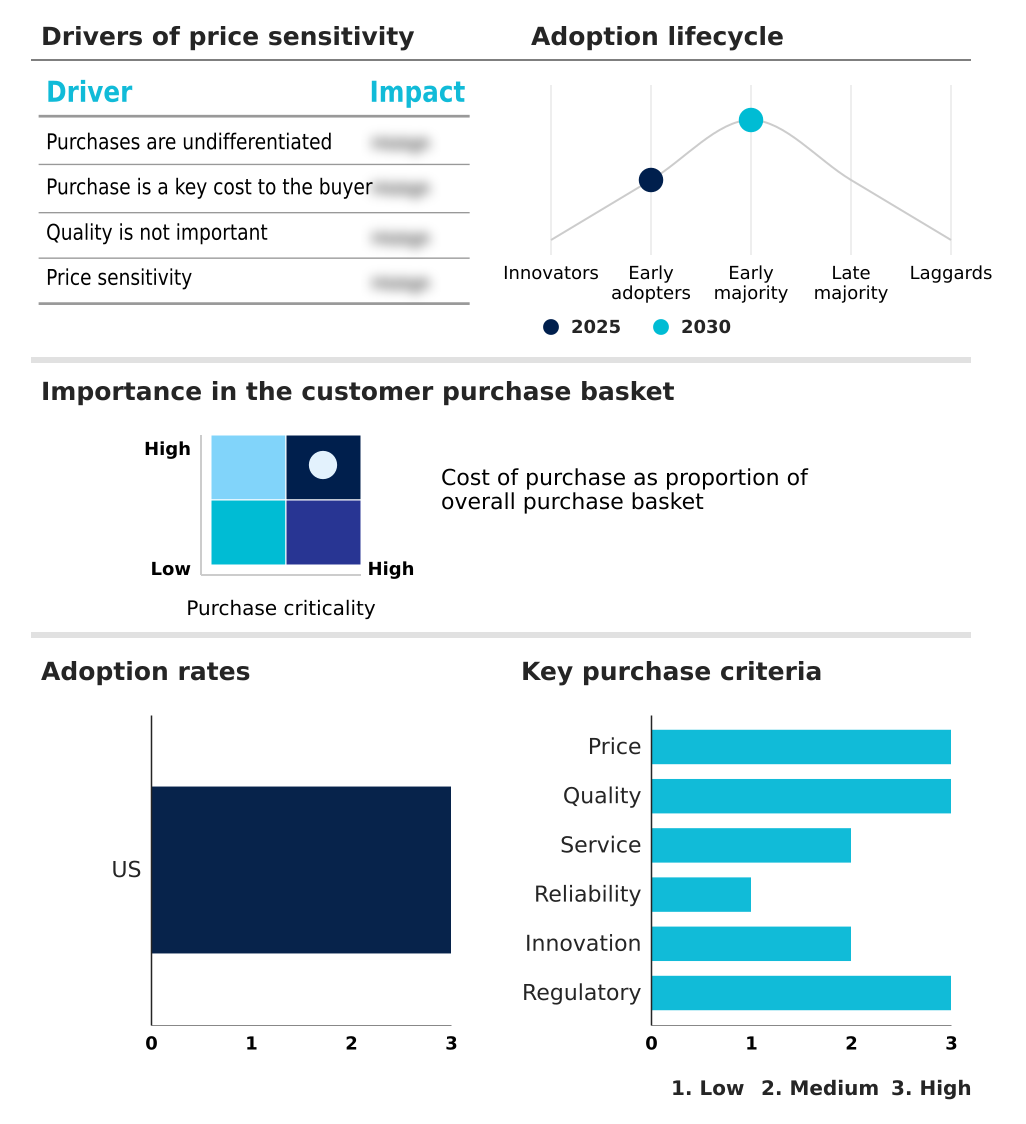
The us household appliances market forecasting report includes the adoption lifecycle of the market, covering from the innovator’s stage to the laggard’s stage. It focuses on adoption rates in different regions based on penetration. Furthermore, the us household appliances market report also includes key purchase criteria and drivers of price sensitivity to help companies evaluate and develop their market growth analysis strategies.
Customer Landscape of US Household Appliances Industry
Competitive Landscape
Companies are implementing various strategies, such as strategic alliances, us household appliances market forecast, partnerships, mergers and acquisitions, geographical expansion, and product/service launches, to enhance their presence in the industry.
AB Electrolux - The company offers a comprehensive portfolio of major household appliances, including advanced laundry systems, refrigeration solutions, and innovative kitchen cooktops and ovens.
The industry research and growth report includes detailed analyses of the competitive landscape of the market and information about key companies, including:
- AB Electrolux
- Bertazzoni Spa
- Electrolux Group
- Fisher and Paykel Appliances Ltd.
- FOTILE Overseas Kitchen Appliance Co. Ltd
- Haier Smart Home Co. Ltd.
- Hatco Corp.
- Irobot Corp.
- LG Electronics Inc.
- Marvel Refrigeration
- Miele and Cie. KG
- Neither Hisense USA Corp.
- Panasonic Holdings Corp.
- Robert Bosch GmbH
- Samsung Electronics Co. Ltd.
- Smeg S.p.a.
- Sub Zero Group Inc.
- The Middleby Corp.
- True Manufacturing Co. Inc.
- Whirlpool Corp.
Qualitative and quantitative analysis of companies has been conducted to help clients understand the wider business environment as well as the strengths and weaknesses of key industry players. Data is qualitatively analyzed to categorize companies as pure play, category-focused, industry-focused, and diversified; it is quantitatively analyzed to categorize companies as dominant, leading, strong, tentative, and weak.
Recent Development and News in Us household appliances market
- In February 2025, Samsung Electronics America initiated reservations for its 2025 Bespoke AI appliance lineup, featuring AI Vision Inside technology and an integrated AI Home LCD screen control hub.
- In March 2025, GE Appliances launched its GE Profile UltraFresh System dishwashers, integrating Microban antimicrobial technology to address consumer demand for enhanced hygiene.
- In February 2025, the US Department of Energy announced the suspension of seven major energy efficiency mandates for appliance categories including tankless water heaters and clothes washers.
- In March 2025, iRobot released its new product lineup, highlighted by the Roomba 205 Dust Compactor robot vacuum, which features a novel system for compressing debris.
Dive into Technavio’s robust research methodology, blending expert interviews, extensive data synthesis, and validated models for unparalleled US Household Appliances Market insights. See full methodology.
| Market Scope | |
|---|---|
| Page number | 181 |
| Base year | 2025 |
| Historic period | 2020-2024 |
| Forecast period | 2026-2030 |
| Growth momentum & CAGR | Accelerate at a CAGR of 3.8% |
| Market growth 2026-2030 | USD 13270.0 million |
| Market structure | Fragmented |
| YoY growth 2025-2026(%) | 3.6% |
| Key countries | US |
| Competitive landscape | Leading Companies, Market Positioning of Companies, Competitive Strategies, and Industry Risks |
Research Analyst Overview
- The household appliances market is currently defined by a strategic pivot towards intelligent, autonomous systems and sustainable manufacturing. The integration of agentic artificial intelligence into everyday devices, from convection ovens to ventless dryers, is fundamentally reshaping user interaction and product value. Advanced filtration systems and antimicrobial surfaces are becoming standard as health and hygiene considerations gain prominence.
- Boardroom decisions are increasingly focused on balancing innovation with operational resilience; a key consideration is the investment in reshoring production to mitigate the impact of volatile energy efficiency mandates and secure supply chain logistics. This involves significant capital for technologies like induction cooktops and advanced hvac systems.
- This strategic shift is validated by performance gains; for example, new heat pump technology has demonstrated an ability to reduce energy consumption in laundry appliances by over 40% compared to conventional models.
- The market's trajectory is toward a deeply integrated smart home ecosystem, where connected appliances with predictive maintenance alerts and firmware over-the-air updates deliver continuous value, fostering brand loyalty within a competitive landscape. The adoption of circular economy principles is also influencing the design of products like tankless water heaters.
What are the Key Data Covered in this US Household Appliances Market Research and Growth Report?
-
What is the expected growth of the US Household Appliances Market between 2026 and 2030?
-
USD 13.27 billion, at a CAGR of 3.8%
-
-
What segmentation does the market report cover?
-
The report is segmented by Product (Major household, and Small household), Distribution Channel (Offline, and Online), Price (Mid-range, Value-based, and Premium) and Geography (North America)
-
-
Which regions are analyzed in the report?
-
North America
-
-
What are the key growth drivers and market challenges?
-
Acceleration of artificial intelligence and agentic automation in geospatial workflows, Escalating complexity of technology convergence and interoperability
-
-
Who are the major players in the US Household Appliances Market?
-
AB Electrolux, Bertazzoni Spa, Electrolux Group, Fisher and Paykel Appliances Ltd., FOTILE Overseas Kitchen Appliance Co. Ltd, Haier Smart Home Co. Ltd., Hatco Corp., Irobot Corp., LG Electronics Inc., Marvel Refrigeration, Miele and Cie. KG, Neither Hisense USA Corp., Panasonic Holdings Corp., Robert Bosch GmbH, Samsung Electronics Co. Ltd., Smeg S.p.a., Sub Zero Group Inc., The Middleby Corp., True Manufacturing Co. Inc. and Whirlpool Corp.
-
Market Research Insights
- The market is shaped by a dynamic interplay of technological advancement and shifting consumer priorities. Smart appliance interoperability is becoming a baseline expectation, with innovations in automated food inventory management showing potential to reduce household waste by over 15%.
- This push for intelligence is balanced by a strong emphasis on sustainability, where the use of recycled materials in appliances is a growing factor in purchasing decisions. For example, adopting closed-loop water systems in new dishwasher lines can lower water consumption by up to 20% per cycle.
- Concurrently, the rise of the appliance trade-in programs and direct-to-consumer appliance sales models reflects a changing retail landscape, where manufacturers are building more direct relationships with end-users. This environment requires a multi-faceted strategy that addresses both technological sophistication and circular economy principles to maintain a competitive edge.
We can help! Our analysts can customize this us household appliances market research report to meet your requirements.
 RIA -
RIA - 
