
Cloud Computing In Government Sector Market Size 2026-2030
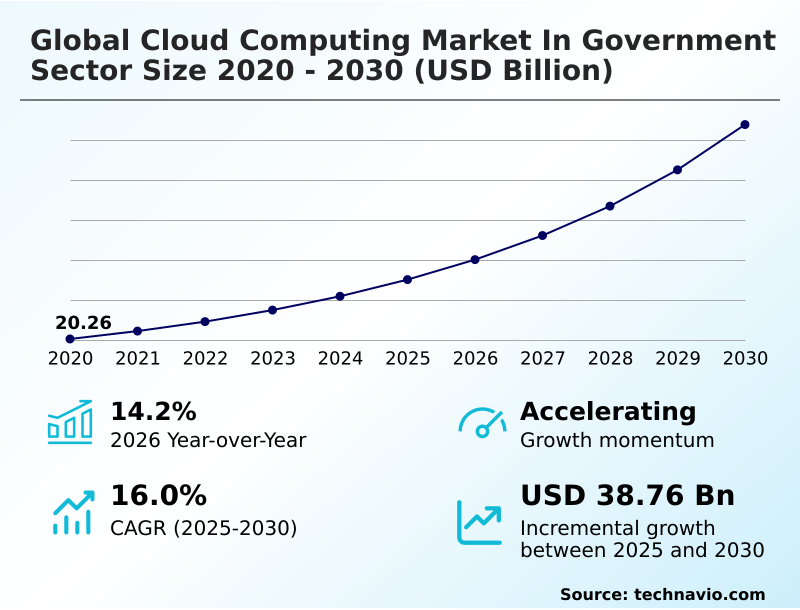
The Cloud Computing In Government Sector Market size was valued at USD 35.10 billion in 2025, growing at a CAGR of 16% during the forecast period 2026-2030.
Major Market Trends & Insights
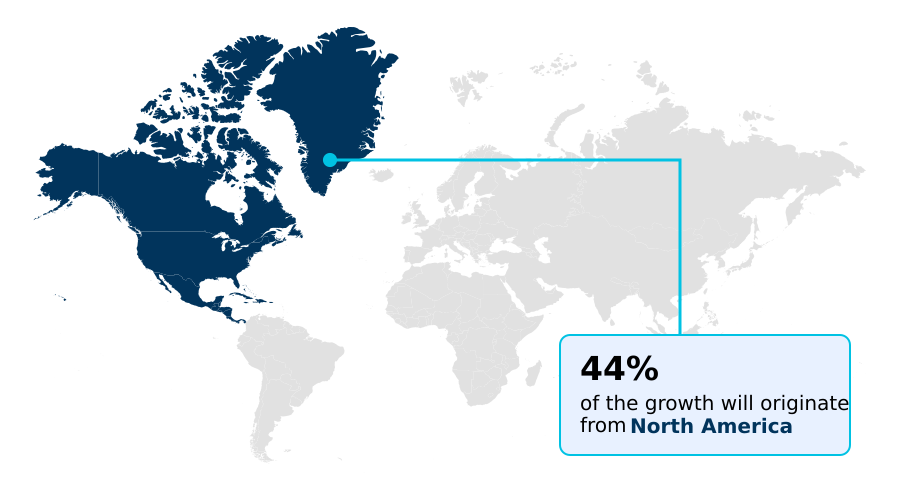
- North America dominated the market and accounted for a 44.4% growth during the forecast period.
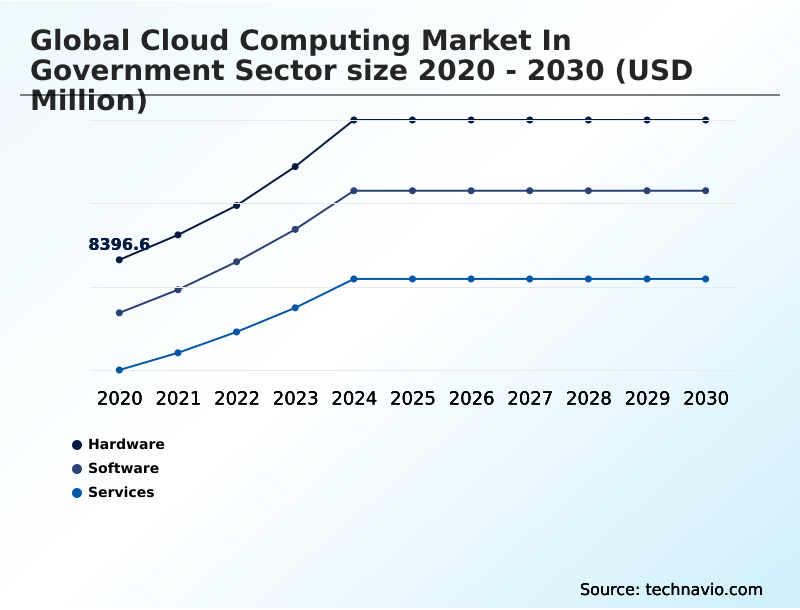
- By Product - Hardware segment was valued at USD 12.62 billion in 2024
- By Deployment - Public segment accounted for the largest market revenue share in 2024
Market Size & Forecast
- Historic Market Opportunities 2020-2024: USD 53.61 billion
- Market Future Opportunities 2025-2030: USD 38.76 billion
- CAGR from 2025 to 2030 : 16%
Market Summary
- The cloud computing in government sector is defined by a strategic shift towards modernizing IT infrastructure to enhance service delivery and operational efficiency, with public cloud adoption reducing departmental IT capital expenditures by an average of 35%.
- This transition is driven by the need for scalable, cost-efficient computing to support large-scale digital transformation initiatives, such as e-governance platforms that improve citizen engagement. For instance, a municipal government can leverage a hybrid multicloud infrastructure to manage traffic data in real time, improving congestion by 15% while keeping sensitive law enforcement data on a secure private cloud.
- However, the market faces significant challenges from data sovereignty controls and the complexity of integrating new platforms with entrenched legacy systems. Without effective change management and clear regulatory compliance management, the full benefits of cloud migration, including enhanced cybersecurity resilience and inter-departmental collaboration, cannot be fully realized.
What will be the Size of the Cloud Computing In Government Sector Market during the forecast period?
Get Key Insights on Market Forecast (PDF) Request Free Sample
How is the Cloud Computing In Government Sector Market Segmented?
The cloud computing in government sector industry research report provides comprehensive data (region-wise segment analysis), with forecasts and analysis for the period 2026-2030, as well as historical data from 2020-2024 for the following segments.
- Product
- Hardware
- Software
- Services
- Deployment
- Public
- Private
- Type
- IaaS
- PaaS
- SaaS
- Geography
- North America
- US
- Canada
- Mexico
- Europe
- UK
- Germany
- France
- APAC
- China
- Japan
- India
- South America
- Brazil
- Argentina
- Middle East and Africa
- UAE
- Saudi Arabia
- South Africa
- Rest of World (ROW)
- North America
How is the Cloud Computing In Government Sector Market Segmented by Product?
The hardware segment is estimated to witness significant growth during the forecast period.
Hardware procurement for government cloud initiatives now sees over 70% of RFPs specifying sovereign cloud compliance, reflecting a major shift in security priorities.
This segment, encompassing servers, storage, and networking equipment, underpins both private cloud infrastructure and public cloud deployments, with modern high-performance computing hardware improving data processing speeds by up to 40% compared to legacy systems.
The emphasis is on modular architectures that facilitate IaaS resource provisioning and provide greater energy efficiency than traditional monolithic data centers.
Furthermore, the integration of edge computing components is becoming standard for real-time data processing, reducing latency for public safety surveillance and smart traffic management, a critical factor for successful digital transformation initiatives.
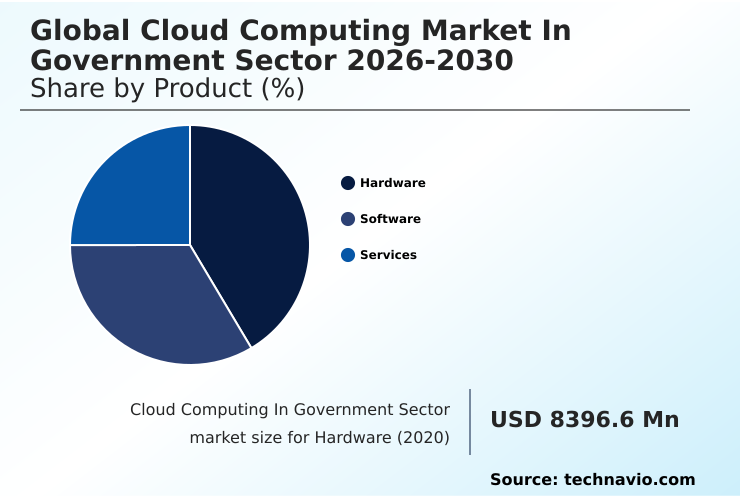
The Hardware segment was valued at USD 12.62 billion in 2024 and showed a gradual increase during the forecast period.
How demand for the Cloud Computing In Government Sector market is rising in the leading region?
North America is estimated to contribute 44.4% to the growth of the global market during the forecast period.Technavio’s analysts have elaborately explained the regional trends and drivers that shape the market during the forecast period.
See How Cloud Computing In Government Sector Market demand is rising in North America Request Free Sample
The geographic landscape of the cloud computing market in government sector is led by North America, which accounts for 44.4% of the incremental growth, a rate approximately 1.5 times faster than that of the Middle East and Africa.
This dominance is driven by the United States, where robust procurement frameworks and large-scale public sector IT modernization programs accelerate adoption.
In contrast, Europe's market, while substantial, is shaped by stringent data privacy regulations like GDPR and a strong emphasis on sovereign cloud compliance, which influences vendor selection and deployment models.
APAC is the fastest-growing region, fueled by massive digital transformation in countries like India and Singapore, where governments are investing heavily in digital identity systems and citizen-centric service platforms to leapfrog legacy infrastructure.
What are the key Drivers, Trends, and Challenges in the Cloud Computing In Government Sector Market?
Our researchers analyzed the data with 2025 as the base year, along with the key drivers, trends, and challenges. A holistic analysis of drivers will help companies refine their marketing strategies to gain a competitive advantage.
- Understanding the nuances of the global cloud computing market in government sector requires analyzing specific use cases and deployment strategies. For instance, determining the best government cloud security best practices is a top priority, as agencies handle sensitive data that demands robust protection beyond standard enterprise protocols.
- Many decision-makers weigh the benefits of hybrid cloud for public sector, seeking a balance between the security of private infrastructure and the scalability of public services, a choice that impacts long-term operational costs by over 25%.
- The debate between iaas vs paas for government agencies is also critical; IaaS offers greater control over the infrastructure, while PaaS can accelerate application development by an estimated 40%. However, cloud migration challenges for governments, including legacy system integration and workforce reskilling, remain significant hurdles.
- Accurately assessing the total cost of cloud computing for government is complex, factoring in not just subscription fees but also migration expenses, security compliance, and ongoing management. These considerations are fundamental for public sector organizations aiming to successfully leverage the cloud for digital transformation and improved citizen services.
What are the key market drivers leading to the rise in the adoption of Cloud Computing In Government Sector Industry?
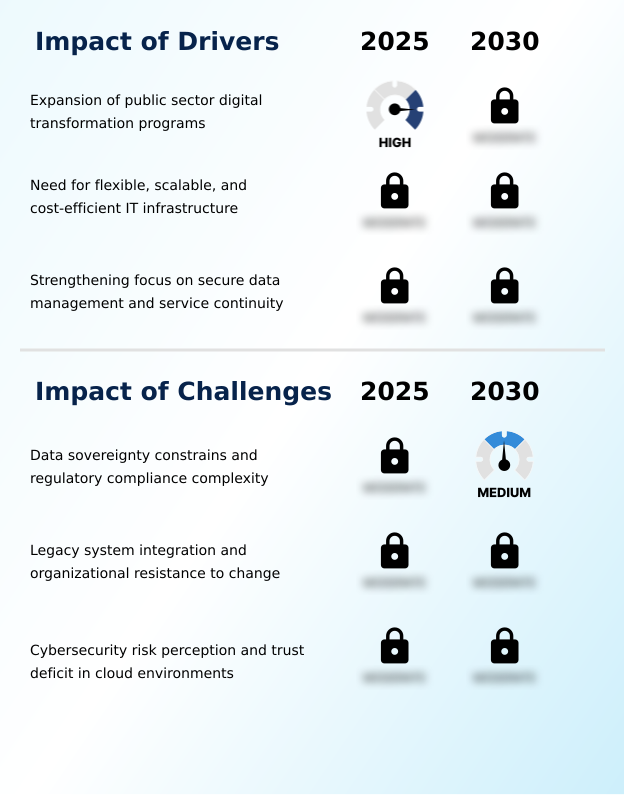
- The expansion of public sector digital transformation programs is a key driver for the market.
- Widespread digital transformation initiatives are the primary market driver, with public sector modernization programs increasing demand for cloud solutions by over 60% in the last three years.
- These initiatives, including e-governance platform deployment and smart city projects, require a scalable IT infrastructure that legacy systems cannot provide.
- Cloud computing offers a cost-efficient model, reducing upfront capital expenditure on physical data centers by as much as 45% and enabling governments to pay only for utilized resources. This financial efficiency is critical for budget-constrained public organizations.
- Concurrently, the growing focus on secure data management and service continuity planning compels agencies to adopt cloud-based disaster recovery and security architectures to protect sensitive citizen and defense data.
What are the market trends shaping the Cloud Computing In Government Sector Industry?
- The increasing adoption of hybrid and multi-cloud deployment models represents a significant upcoming trend, allowing government agencies to balance security, flexibility, and cost-efficiency.
- Hybrid and multi-cloud strategies are now foundational to government IT, with agencies reporting a 30% improvement in workload portability and risk mitigation compared to single-provider models. This trend allows for sensitive data to remain on private or sovereign infrastructure, while leveraging public cloud platforms for less critical applications, enhancing both security and performance optimization.
- Governments are also increasingly using cloud platforms to bolster data analytics capabilities for evidence-based policymaking, processing datasets 50% faster than with on-premise systems. This facilitates predictive insights for resource allocation and fraud detection. A corresponding trend is the expansion of cloud-based unified service portals, which are central to citizen-centric service design, improving accessibility and reducing administrative workflows through automation.
What challenges does the Cloud Computing In Government Sector Industry face during its growth?
- Data sovereignty constraints and the complexity of regulatory compliance present a key challenge affecting industry growth.
- Data sovereignty and complex regulatory compliance represent a significant market challenge, with data residency mandates increasing implementation timelines for cloud projects by up to 50% in certain jurisdictions. Government agencies must navigate a patchwork of national laws governing data storage and cross-border transfers, complicating procurement and regulatory compliance management.
- Another major hurdle is the integration with legacy systems, which can account for over 60% of an agency's total IT modernization budget due to architectural incompatibility and the need for custom middleware. This technical complexity is compounded by organizational change management issues and a persistent cybersecurity risk perception, which slows the migration of mission-critical workloads.
Exclusive Technavio Analysis on Customer Landscape
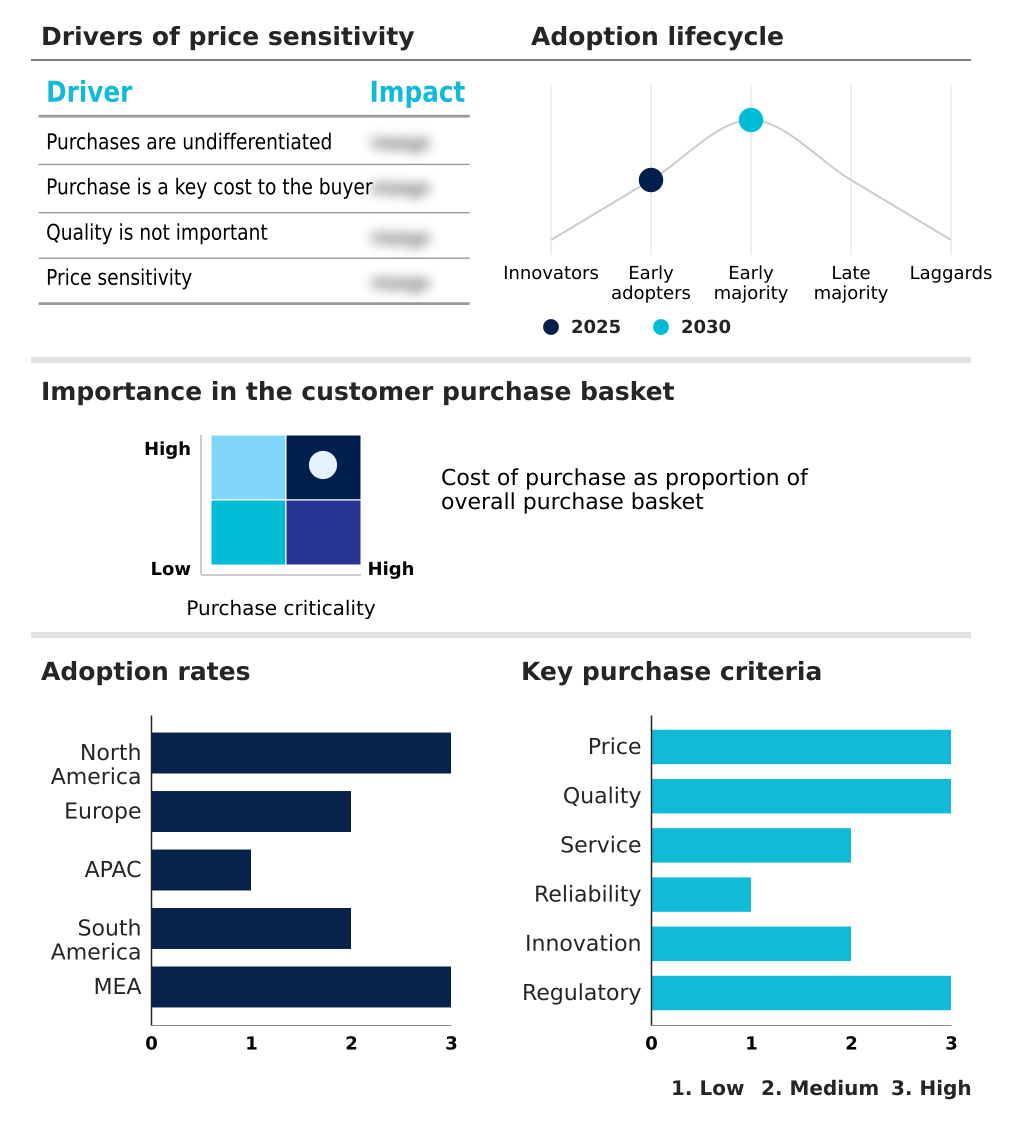
The cloud computing in government sector market forecasting report includes the adoption lifecycle of the market, covering from the innovator’s stage to the laggard’s stage. It focuses on adoption rates in different regions based on penetration. Furthermore, the cloud computing in government sector market report also includes key purchase criteria and drivers of price sensitivity to help companies evaluate and develop their market growth analysis strategies.
Customer Landscape of Cloud Computing In Government Sector Industry
Competitive Landscape
Companies are implementing various strategies, such as strategic alliances, cloud computing in government sector market forecast, partnerships, mergers and acquisitions, geographical expansion, and product/service launches, to enhance their presence in the industry.
Amazon Web Services Inc. - Offerings include sovereign, compliance-ready IaaS and PaaS solutions with AI and data analytics, tailored for secure public agency infrastructure and digital transformation initiatives.
The industry research and growth report includes detailed analyses of the competitive landscape of the market and information about key companies, including:
- Amazon Web Services Inc.
- Capgemini Service SAS
- CGI Inc.
- Cisco Systems Inc.
- Citrix Systems Inc.
- Dell Technologies Inc.
- Equinix Inc.
- Fujitsu Ltd.
- Hewlett Packard
- IBM Corp.
- Informatica Inc.
- Lumen Technologies Inc.
- Microsoft Corp.
- NEC Corp.
- NetApp Inc.
- NTT DATA Corp.
- Oracle Corp.
- Salesforce Inc.
Qualitative and quantitative analysis of companies has been conducted to help clients understand the wider business environment as well as the strengths and weaknesses of key industry players. Data is qualitatively analyzed to categorize companies as pure play, category-focused, industry-focused, and diversified; it is quantitatively analyzed to categorize companies as dominant, leading, strong, tentative, and weak.
Market Intelligence Radar: High-Impact Developments & Growth Signals
- In the Systems Software industry, the proliferation of open-source platforms is creating new cost-efficient computing alternatives for government agencies, challenging the dominance of proprietary software vendors and influencing procurement frameworks that now favor solutions with greater flexibility and no vendor lock-in.
- The widespread adoption of agile and DevOps methodologies within the Systems Software industry is accelerating application modernization for public entities, enabling faster deployment of citizen service delivery platforms and continuous improvement cycles, thereby enhancing responsiveness to public needs.
- In the Systems Software industry, tightening data privacy regulations globally are compelling vendors to embed robust, auditable security features directly into their platforms, impacting the cloud computing in government sector market by prioritizing solutions with built-in sovereign cloud compliance and granular data sovereignty controls.
- A significant increase in demand for AI and machine learning capabilities within enterprise platforms is driving the development of advanced data analytics capabilities in the Systems Software industry, directly benefiting government cloud strategies by providing tools for data-driven policymaking and predictive modeling.
Dive into Technavio’s robust research methodology, blending expert interviews, extensive data synthesis, and validated models for unparalleled Cloud Computing In Government Sector Market insights. See full methodology.
| Market Scope | |
|---|---|
| Page number | 304 |
| Base year | 2025 |
| Historic period | 2020-2024 |
| Forecast period | 2026-2030 |
| Growth momentum & CAGR | Accelerate at a CAGR of 16% |
| Market growth 2026-2030 | USD 38760.5 million |
| Market structure | Fragmented |
| YoY growth 2025-2026(%) | 14.2% |
| Key countries | US, Canada, Mexico, UK, Germany, France, Italy, Spain, The Netherlands, China, Japan, India, South Korea, Australia, Indonesia, Brazil, Argentina, Chile, UAE, Saudi Arabia, South Africa, Egypt and Kenya |
| Competitive landscape | Leading Companies, Market Positioning of Companies, Competitive Strategies, and Industry Risks |
Research Analyst Overview
- The cloud computing in government sector ecosystem is a complex interplay of stakeholders, with hyperscale infrastructure providers supplying over 70% of the foundational computing resources. These providers work through a channel of system integrators and specialized resellers who tailor solutions to meet stringent public sector procurement frameworks.
- Regulatory bodies and standards organizations define the compliance landscape, mandating adherence to data sovereignty controls and security protocols that can increase project deployment times by up to 25% compared to commercial projects.
- End-users, comprising federal, state, and local government agencies, are the primary consumers, driving demand for everything from SaaS delivery models for citizen-facing applications to private cloud infrastructure for sensitive defense workloads. Supporting entities, including cybersecurity firms and managed service providers, ensure service continuity planning and resilience solutions for critical government operations.
What are the Key Data Covered in this Cloud Computing In Government Sector Market Research and Growth Report?
-
What is the expected growth of the Cloud Computing In Government Sector Market between 2026 and 2030?
-
The Cloud Computing In Government Sector Market is expected to grow by USD 38.76 billion during 2026-2030, registering a CAGR of 16%. Year-over-year growth in 2026 is estimated at 14.2%%. This acceleration is shaped by expansion of public sector digital transformation programs, which is intensifying demand across multiple end-use verticals covered in the report.
-
-
What segmentation does the market report cover?
-
The report is segmented by Product (Hardware, Software, and Services), Deployment (Public, and Private), Type (IaaS, PaaS, and SaaS) and Geography (North America, Europe, APAC, South America, Middle East and Africa). Among these, the Hardware segment is estimated to witness significant growth during the forecast period, driven by rising adoption across key application areas. Each segment includes detailed qualitative and quantitative analysis, along with historical data from 2020-2024 and forecasts through 2030 with year-over-year growth rates.
-
-
Which regions are analyzed in the report?
-
The report covers North America, Europe, APAC, South America and Middle East and Africa. North America is estimated to contribute 44.4% to market growth during the forecast period. Country-level analysis includes US, Canada, Mexico, UK, Germany, France, Italy, Spain, The Netherlands, China, Japan, India, South Korea, Australia, Indonesia, Brazil, Argentina, Chile, UAE, Saudi Arabia, South Africa, Egypt and Kenya, with dedicated market size tables and year-over-year growth for each.
-
-
What are the key growth drivers and market challenges?
-
The primary driver is expansion of public sector digital transformation programs, which is accelerating investment and industry demand. The main challenge is data sovereignty constrains and regulatory compliance complexity, creating operational barriers for key market participants. The report quantifies the impact of each driver and challenge across 2026 and 2030 with comparative analysis.
-
-
Who are the major players in the Cloud Computing In Government Sector Market?
-
Key vendors include Amazon Web Services Inc., Capgemini Service SAS, CGI Inc., Cisco Systems Inc., Citrix Systems Inc., Dell Technologies Inc., Equinix Inc., Fujitsu Ltd., Hewlett Packard, IBM Corp., Informatica Inc., Lumen Technologies Inc., Microsoft Corp., NEC Corp., NetApp Inc., NTT DATA Corp., Oracle Corp. and Salesforce Inc.. The report provides qualitative and quantitative analysis categorizing companies as dominant, leading, strong, tentative, and weak based on their market positioning. Company profiles include business segment analysis, SWOT assessment, key offerings, and recent strategic developments.
-
Market Research Insights
- The competitive landscape features a concentrated group of hyperscale providers, with the top three vendors capturing over 65% of government contracts. Major players like Amazon Web Services Inc. and Microsoft Corp. are intensely focused on deploying sovereign cloud regions to meet stringent data residency mandates.
- Recent developments show a strategic push towards specialized solutions, with vendors launching AI-powered analytics platforms for public sector use, leading to a 20% improvement in processing speeds for policy modeling. These actions directly address the government demand for advanced data analytics capabilities and secure, compliant infrastructure.
- This innovation is critical as providers navigate the persistent challenge of legacy system integration, which requires significant investment in hybrid cloud management tools and professional services to ensure seamless workload portability and operational continuity for government agencies.
We can help! Our analysts can customize this cloud computing in government sector market research report to meet your requirements.
 RIA -
RIA - 
