Cloud Point Of Sale Market Size 2024-2028
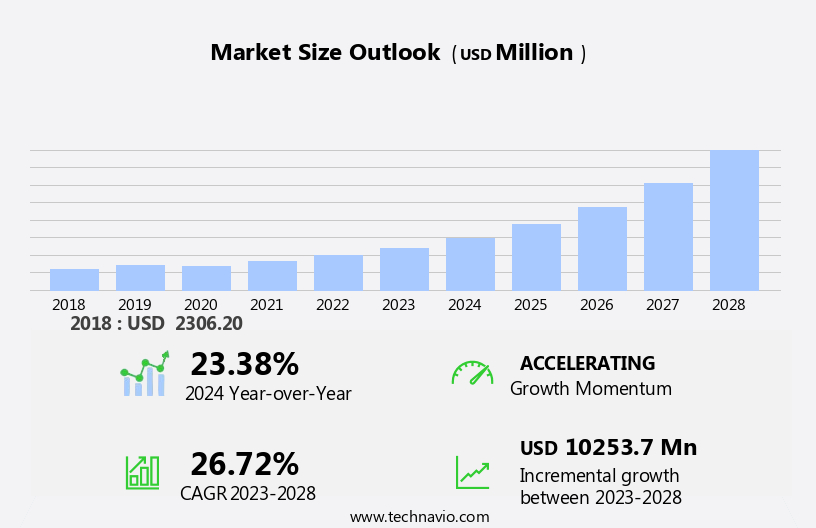
The cloud point of sale market size is forecast to increase by USD 10.25 billion at a CAGR of 26.72% between 2023 and 2028. The market is witnessing significant growth due to the increasing adoption in various industries such as retail, media and entertainment, casinos, movie theatres, theme parks, museums, and sports arenas. The retail industry is a major contributor to this market's growth, as businesses seek flexible and transparent entertainment solutions for their customers. The continuous development of new cloud POS solutions is another driving factor, offering advanced features like maintenance services and seamless integration with POS terminals and cash registers. However, data security concerns remain a challenge, necessitating powerful security measures to protect sensitive customer information. In the market, the demand for cloud POS systems is expected to continue, driven by the need for contactless payments and remote work capabilities.
Cloud Point of Sale (POS) systems have become increasingly popular in various industries including restaurant, retail, aviation, hospitality, and manufacturing. These systems allow quick data consolidation and inventory management from a remote server, enabling real-time sales tracking and easy access to important business information. Cloud POS systems eliminate the need for expensive hardware and installation costs, making them an affordable option for start-ups and small businesses. The market is witnessing significant growth due to the increasing trend of cashless transactions and the need for digital payment solutions.
Further, chain stores and large retailers are adopting cloud POS systems to manage their sales and inventory across multiple locations. An internet connection is required for these systems to function, making them suitable for businesses with a strong online presence. Standard POS systems have become increasingly crucial for retailers facing store closures and travel restrictions, as they help adapt to shifts in consumer behavior, particularly among discretionary spenders. However, limitations such as the need for a stable internet connection and potential security concerns may hinder the growth of the market.
Market Segmentation
The market research report provides comprehensive data (region-wise segment analysis), with forecasts and estimates in "USD million" for the period 2024-2028, as well as historical data from 2018-2022 for the following segments.
- Application
- Retail and consumer goods
- Travel and hospitality
- Media and entertainment
- Transport and logistics
- Healthcare
- Component
- Solution
- Services
- Geography
- APAC
- China
- Japan
- North America
- Canada
- US
- Europe
- UK
- South America
- Middle East and Africa
- APAC
By Application Insights
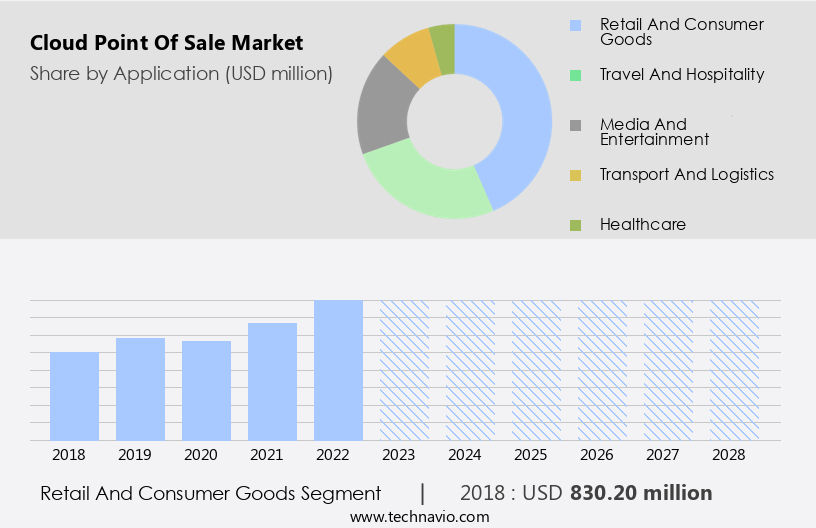
The retail and consumer goods segment is estimated to witness significant growth during the forecast period. In the retail industry, cloud-based Point of Sale (POS) systems have become increasingly popular. These solutions, which include cashier's kiosks and hostess desks, enable businesses such as restaurants and chain stores to process sales, manage inventory, and accept payments with ease. Cloud POS systems offer several advantages, including quick data consolidation and the ability to access real-time information from a remote server. An internet connection is required for these systems to function optimally. For start-ups, the implementation of cloud POS systems can help reduce initial expenses, as there is no need for expensive hardware or software installations. Furthermore, cloud POS systems offer flexibility, allowing businesses to easily update sale prices and inventory levels from any location.
Further, newer cloud POS solutions may also include advanced features such as barcode scanners, touch screens, and CRM integration, enhancing the customer experience and providing valuable insights into customer behavior and preferences. In the retail and consumer goods segment, cloud POS systems have become indispensable tools for businesses seeking to streamline operations and improve customer service. By leveraging the power of the cloud, retailers can process transactions quickly and efficiently, manage inventory levels in real-time, and offer customers a variety of payment options. Additionally, the integration of advanced features such as touch screens and barcode scanners can help improve the overall shopping experience and provide valuable data insights.
Get a glance at the market share of various segments Request Free Sample
The retail and consumer goods segment accounted for USD 830.20 million in 2018 and showed a gradual increase during the forecast period.
Regional Insights
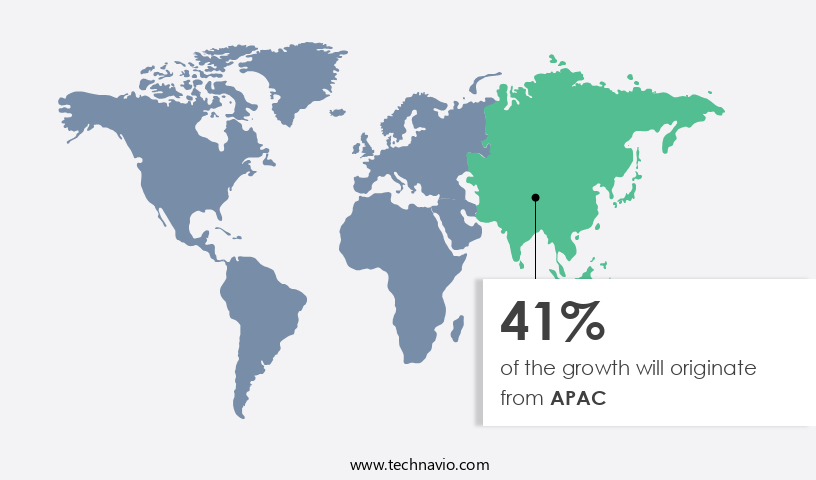
APAC is estimated to contribute 41% to the growth of the global market during the forecast period. Technavio's analysts have elaborately explained the regional trends and drivers that shape the market during the forecast period.
For more insights on the market share of various regions Request Free Sample
In the retail sector, cloud point of sale (POS) solutions have gained significant traction in Asia Pacific (APAC) markets, particularly in China and India, due to several factors. The increasing number of retail establishments, including supermarkets, specialty stores, warehouses, and shopping malls, necessitates efficient and manageable POS systems. Additionally, the adoption of contactless payment methods in countries like China, Australia, India, and Indonesia is on the rise, making cloud POS systems an attractive option for merchants. These systems enable safe and clean transactions, which is increasingly important in the current climate.
Furthermore, cloud POS solutions offer improved mobility, enabling multi-channel selling and technical improvements that cater to mobility trends. Enterprise merchants are adopting these systems to enhance customer service and streamline operations. In summary, the growth of organized retail and the shift towards contactless payments are driving the adoption of cloud POS solutions in APAC, with China and India leading the charge.
Our researchers analyzed the data with 2023 as the base year, along with the key drivers, trends, and challenges. A holistic analysis of drivers will help companies refine their marketing strategies to gain a competitive advantage.
Market Driver
The growing application of cloud point of sale in retail is the key driver of the market. The adoption of cloud-based Point of Sale (POS) solutions is on the rise, particularly among small and medium-sized enterprises (SMEs) in the retail and e-commerce sectors. These solutions offer several advantages, including easy access via the Internet or web browsers, affordable pricing, and the ability to manage both online and in-store sales. As retail businesses continue to digitalize and consumers increasingly prefer cashless payments, cloud POS systems have become essential for managing payment services, administration services, and gateway services. Moreover, the healthcare, transportation, logistics, entertainment, and other industries are also recognizing the benefits of cloud POS solutions. The ongoing COVID-19 pandemic, labor shortages, supply chain challenges, and evolving consumer demands have intensified the need for flexible and efficient POS systems.
Further, global trends indicate that cloud POS solutions will continue to gain popularity due to their scalability, ease of use, and ability to integrate with various business applications. By deploying cloud POS systems, businesses can streamline their operations, improve customer experience, and gain valuable insights into sales data and customer behavior.
Market Trends
Continuous development of new solutions is the upcoming trend in the market. The cloud point of sale (POS) market is witnessing significant advancements due to continuous innovation from companies. NCR's introduction of NCR Aloha Cloud in May 2022 is an example of this trend. This cloud-based POS solution offers a modern user interface, compact handheld device, and efficient payment processing with quick deposit funding. Such developments are anticipated to drive the expansion of the global cloud POS market. Advanced solutions, like integrated credit and debit card processing, signature capture, barcode scanner, customer display, cash drawer, receipt printer, and conveyor belt with weight scale, are increasingly becoming essential for businesses. These features enable faster transactions, improved customer experience, and enhanced operational efficiency.
Moreover, the integration of computer and monitor systems in cloud POS systems allows for real-time data access and analytics, enabling businesses to make informed decisions promptly. The seamless integration of these components, such as a computer, monitor, cash drawer, receipt printer, customer display, barcode scanner, debit, and credit card processing, creates a comprehensive solution for businesses of all sizes. In conclusion, the cloud POS market is expected to experience substantial growth due to the continuous development of advanced solutions, including integrated credit card processing, signature capture, barcode scanner, customer display, cash drawer, receipt printer, conveyor belt with weight scale, and computer and monitor systems.
Market Challenge
Data security concerns are a key challenge affecting the market growth. Cloud Point of Sale (POS) solutions have gained popularity in various industries such as media, entertainment, casinos, movie theatres, theme parks, museums, and sports arenas. However, the adoption of these solutions is not without challenges. Security risks and privacy concerns pose significant hurdles, necessitating additional expenditures on cybersecurity measures. Retailers, in particular, are susceptible to unauthorized access and data breaches. To mitigate these risks, retailers must invest in vital cybersecurity processes and systems. Cloud POS solutions require a reliable internet connection and third-party services. While these dependencies can reduce inherent vulnerabilities, they also add to the implementation costs. Transparent entertainment and retail industries are increasingly adopting cloud POS terminals and cash registers for their flexibility.
Further, end-users must ensure that these solutions are secure and comply with industry regulations. In the media and entertainment industries, cloud POS solutions offer convenience and streamlined operations. Casinos, movie theatres, theme parks, museums, and sports arenas can benefit from real-time transaction processing and improved customer experience. However, the implementation of these solutions necessitates a strong focus on cybersecurity to protect sensitive customer data. In conclusion, while cloud POS solutions offer numerous benefits, they also come with security challenges. Retailers and other end-users must prioritize cybersecurity measures to ensure the safe and effective deployment of these solutions. A reliable internet connection and third-party services can help mitigate inherent vulnerabilities.
Exclusive Customer Landscape
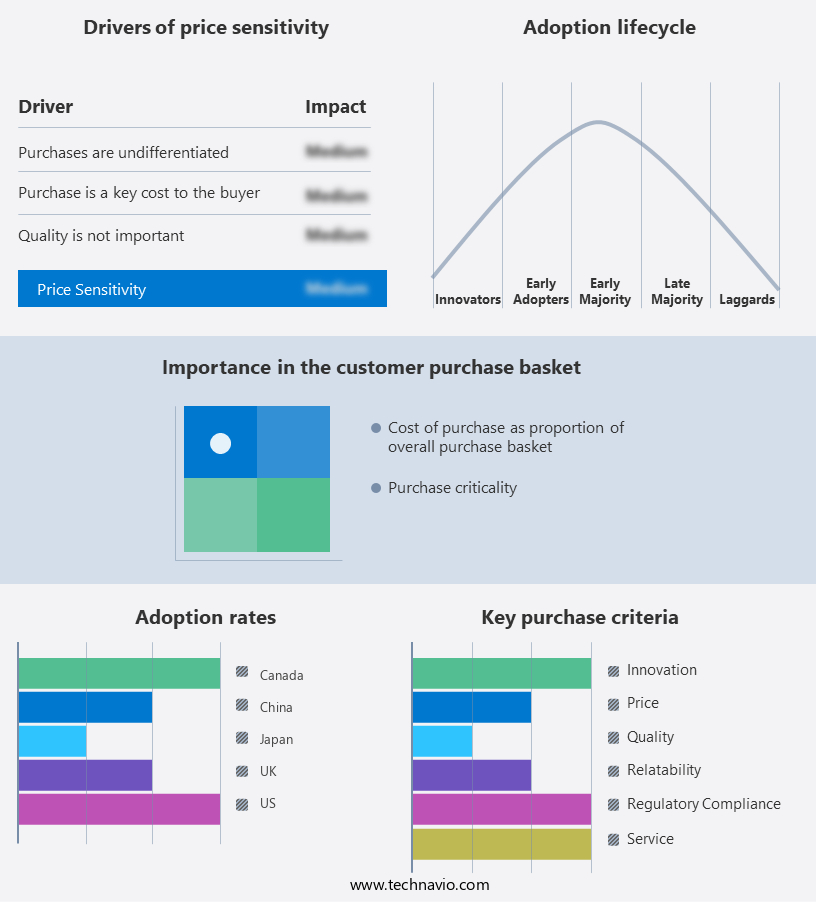
The market forecasting report includes the adoption lifecycle of the market, covering from the innovator's stage to the laggard's stage. It focuses on adoption rates in different regions based on penetration. Furthermore, the report also includes key purchase criteria and drivers of price sensitivity to help companies evaluate and develop their market growth analysis strategies.
Customer Landscape
Key Companies & Market Insights
Companies are implementing various strategies, such as strategic alliances, partnerships, mergers and acquisitions, geographical expansion, and product/service launches, to enhance their presence in the market.
Fiserv Inc.: The company offers point of sale software that helps in taking orders and accepting payments and the point of sale software syncs with the cloud, so one can access the sales, refunds, deposits, and reports, under the brand name of Clover.
The market research and growth report includes detailed analyses of the competitive landscape of the market and information about key companies, including:
- ARBA Retail Systems
- Dotykacka CR s.r.o.
- Bindo Labs Inc.
- Block Inc.
- CDW Corp
- Epicor Software Corp.
- Intuit Inc.
- Lightspeed Commerce Inc.
- NCR Voyix Corp.
- Oracle Corp.
- PAR Technology Corp
- Paychex Inc.
- Poster Pos Inc
- Revel Systems Inc.
- Shopify Inc.
- Teraoka Seiko Co. Ltd.
- Toast Inc.
- TouchBistro Inc.
- TRANSACT LLC
Qualitative and quantitative analysis of companies has been conducted to help clients understand the wider business environment as well as the strengths and weaknesses of key market players. Data is qualitatively analyzed to categorize companies as pure play, category-focused, industry-focused, and diversified; it is quantitatively analyzed to categorize companies as dominant, leading, strong, tentative, and weak.
Research Analyst Overview
Cloud Point of Sale (POS) systems have become a game-changer for various economic sectors, including retail, hospitality, manufacturing, auto, aviation, and healthcare. These systems enable quick data consolidation, inventory management, and sales processing through cashier's kiosks and hostess desks. The cloud-based architecture allows for real-time reporting and access to data from anywhere with an internet connection. Chain stores and small to large enterprises benefit from the flexibility and transparency offered by cloud POS. The solution caters to various industries, including retail & e-commerce, healthcare, transportation, logistics, entertainment, payment services, administration services, gateway services, and maintenance services. Cloud POS offers numerous advantages, such as speed, accuracy, and a wide range of payment options, including cashless transactions, digital payments, contactless payments, and various tendering methods.
Further, the secure software ensures safety and cleanliness, making it an essential tool during the lockdown and social distancing era. The components of a cloud POS system include POS terminals, cash register, computer, monitor, cash drawer, receipt printer, customer display, barcode scanner, and various payment devices like debit, credit card, and signature capture. The system's ease of installation and mobility trends make it a safe and manageable solution for businesses. Despite its advantages, cloud POS systems have limitations, such as start-up expenses, hardware costs, and potential internet connection issues. However, the economic benefits and technical improvements far outweigh these limitations. The future of cloud POS looks promising, with global trends favoring multi-channel selling, online transactions, and improved mobility.
|
Market Scope |
|
|
Report Coverage |
Details |
|
Page number |
170 |
|
Base year |
2023 |
|
Historic period |
2018-2022 |
|
Forecast period |
2024-2028 |
|
Growth momentum & CAGR |
Accelerate at a CAGR of 26.72% |
|
Market growth 2024-2028 |
USD 10.25 billion |
|
Market structure |
Fragmented |
|
YoY growth 2023-2024(%) |
23.38 |
|
Regional analysis |
APAC, North America, Europe, South America, and Middle East and Africa |
|
Performing market contribution |
APAC at 41% |
|
Key countries |
US, China, Japan, UK, and Canada |
|
Competitive landscape |
Leading Companies, Market Positioning of Companies, Competitive Strategies, and Industry Risks |
|
Key companies profiled |
ARBA Retail Systems, Dotykacka CR s.r.o., Bindo Labs Inc., Block Inc., CDW Corp, Epicor Software Corp., Fiserv Inc., Intuit Inc., Lightspeed Commerce Inc., NCR Voyix Corp., Oracle Corp., PAR Technology Corp, Paychex Inc., Poster Pos Inc, Revel Systems Inc., Shopify Inc., Teraoka Seiko Co. Ltd., Toast Inc., TouchBistro Inc., and TRANSACT LLC |
|
Market dynamics |
Parent market analysis, market growth inducers and obstacles, market forecast, fast-growing and slow-growing segment analysis, COVID-19 impact and recovery analysis and future consumer dynamics, market condition analysis for the forecast period |
|
Customization purview |
If our market report has not included the data that you are looking for, you can reach out to our analysts and get segments customized. |
What are the Key Data Covered in this Market Research and Growth Report?
- CAGR of the market during the forecast period
- Detailed information on factors that will drive the market growth and forecasting between 2024 and 2028
- Precise estimation of the size of the market and its contribution of the market in focus to the parent market
- Accurate predictions about upcoming market growth and trends and changes in consumer behaviour
- Growth of the market across APAC, North America, Europe, South America, and Middle East and Africa
- Thorough analysis of the market's competitive landscape and detailed information about companies
- Comprehensive analysis of factors that will challenge the growth of market companies
We can help! Our analysts can customize this market research report to meet your requirements. Get in touch
 RIA -
RIA - 
