
Cloud Telecommunications AI Market Size 2025-2029
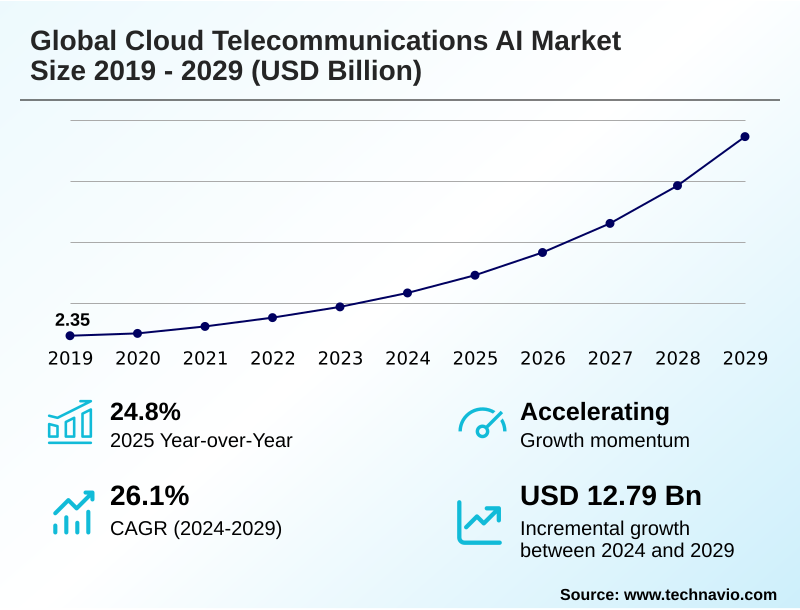
The cloud telecommunications ai market size is valued to increase by USD 12.79 billion, at a CAGR of 26.1% from 2024 to 2029. Increasing pressure for operational efficiency and cost optimization will drive the cloud telecommunications ai market.
Major Market Trends & Insights
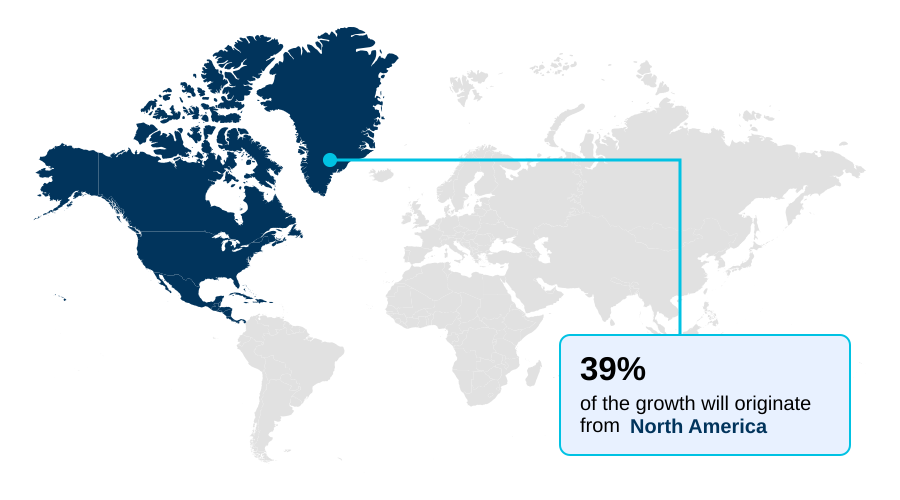
- North America dominated the market and accounted for a 38.8% growth during the forecast period.
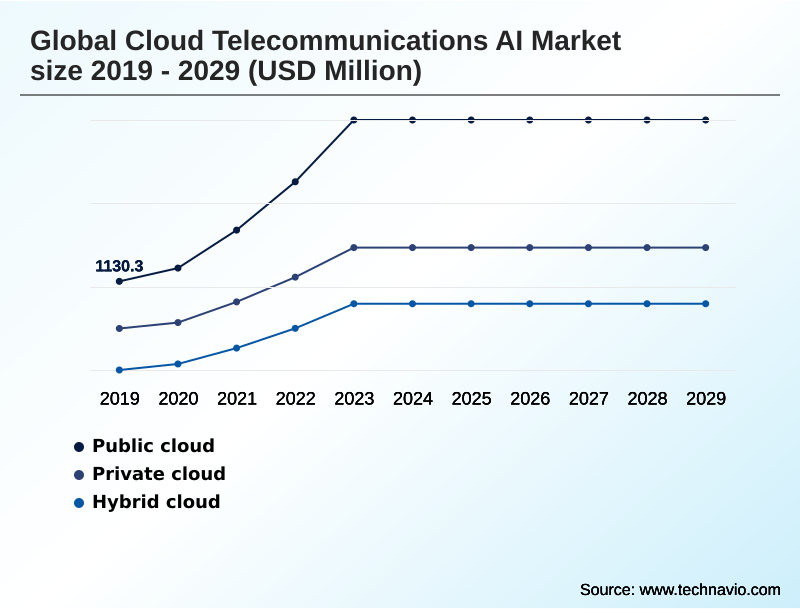
- By Deployment - Public cloud segment was valued at USD 2.37 billion in 2023
- By Application - Network optimization and management segment accounted for the largest market revenue share in 2023
Market Size & Forecast
- Market Opportunities: USD 16.29 billion
- Market Future Opportunities: USD 12.79 billion
- CAGR from 2024 to 2029 : 26.1%
Market Summary
- The cloud telecommunications AI market is fundamentally reshaping network operations and service delivery. This integration of AI with cloud infrastructure is driven by the need to manage the immense complexity of 5G networks and the proliferation of IoT devices. Key trends include the move toward an autonomous network powered by AIOps and closed-loop automation, which promises zero-touch operations.
- The emergence of generative AI and the development of a telco-specific large language model are revolutionizing customer engagement and internal workflows. A primary driver is the relentless pressure for operational efficiency. For example, a communication service provider can leverage predictive maintenance by analyzing network telemetry data to forecast equipment failure, reducing downtime and costly emergency repairs.
- This predictive capability, powered by machine learning and deep learning, allows for a proactive maintenance schedule. However, significant challenges persist, including the complexity of systems integration with legacy OSS and BSS, and navigating stringent data privacy legislation.
- The strategic deployment of edge AI and multi-access edge computing (MEC) addresses demands for ultra-low latency and data sovereignty, enabling new use cases in industrial IoT and creating new AI-as-a-Service revenue streams for operators.
What will be the Size of the Cloud Telecommunications AI Market during the forecast period?
Get Key Insights on Market Forecast (PDF) Get Free Sample
How is the Cloud Telecommunications AI Market Segmented?
The cloud telecommunications ai industry research report provides comprehensive data (region-wise segment analysis), with forecasts and estimates in "USD million" for the period 2025-2029, as well as historical data from 2019-2023 for the following segments.
- Deployment
- Public cloud
- Private cloud
- Hybrid cloud
- Application
- Network optimization and management
- Customer experience management
- Fraud detection and security
- Predictive maintenance
- Others
- Technology
- Machine learning and deep learning
- Natural language processing
- Reinforcement learning and AI Ops
- Computer vision
- Others
- Geography
- North America
- US
- Canada
- Mexico
- APAC
- China
- Japan
- India
- Europe
- Germany
- UK
- France
- Middle East and Africa
- Saudi Arabia
- UAE
- South Africa
- South America
- Brazil
- Argentina
- Colombia
- Rest of World (ROW)
- North America
By Deployment Insights
The public cloud segment is estimated to witness significant growth during the forecast period.
The public cloud deployment model is transformative, offering unparalleled scalability and access to advanced AI tools.
This model allows operators to shift from heavy capital expenditures to a flexible operational model, using infrastructure-as-a-service to power intensive workloads without owning the physical hardware.
This agility accelerates the development of services like intelligent network slicing and customer journey analytics. For instance, leveraging public cloud AI for network telemetry data analysis helps in achieving zero-touch operations, improving anomaly detection by over 40%.
The architecture supports federated learning and AIOps platforms, enabling proactive customer engagement and ensuring robust network security posture while addressing data sovereignty concerns through geographically distributed data centers, crucial for a modern autonomous network.
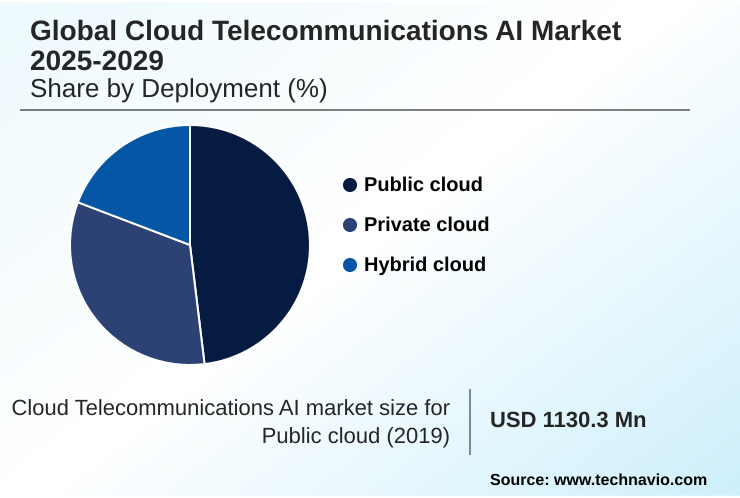
The Public cloud segment was valued at USD 2.37 billion in 2023 and showed a gradual increase during the forecast period.
Regional Analysis
North America is estimated to contribute 38.8% to the growth of the global market during the forecast period.Technavio’s analysts have elaborately explained the regional trends and drivers that shape the market during the forecast period.
See How Cloud Telecommunications AI Market Demand is Rising in North America Get Free Sample
The geographic landscape is led by North America, which accounts for 38.8% of the incremental growth, driven by advanced 5G rollouts.
In this region, operators focus on using churn prediction models and sentiment analysis to retain customers in a saturated market. The APAC region is the fastest-growing, fueled by massive subscriber bases and government-led digital initiatives focused on mobile financial services.
In Europe, the stringent regulatory environment influences technology choices, promoting the adoption of Open RAN and its associated RAN Intelligent Controller (RIC).
These architectures rely on AI for orchestration, with deployments showing a potential 15% improvement in quality of service (QoS).
This is achieved through the use of technologies like deep reinforcement learning to manage service level agreements (SLA) and computer vision for automated network asset inspection.
Market Dynamics
Our researchers analyzed the data with 2024 as the base year, along with the key drivers, trends, and challenges. A holistic analysis of drivers will help companies refine their marketing strategies to gain a competitive advantage.
- The practical application of AI for 5G network slicing is enabling operators to offer customized, guaranteed service tiers to enterprises, a critical step in 5G network monetization with AI. Simultaneously, generative AI in network operations is streamlining complex tasks, while the AI role in Open RAN is fostering a more competitive and innovative vendor ecosystem.
- On the customer-facing side, cloud AI for customer churn and customer experience management using AI are top priorities, leveraging NLP for telecom customer service to provide personalized, real-time support. Operationally, the focus is on efficiency gains through predictive maintenance for cell towers and AI-powered network traffic management.
- These systems are powered by reinforcement learning for network optimization and AI models for radio access networks, which work toward creating autonomous network self-healing capabilities. Security remains paramount, with AI-driven fraud detection in telecom and security analytics for telco cloud becoming standard. The overarching goal is to achieve seamless AI orchestration in telecom networks by integrating AI with legacy OSS/BSS.
- This complex transition requires clear strategies for managing telco data privacy regulations and ensuring telco cloud cost optimization strategies, which can improve operational margins more effectively than traditional methods by a significant factor. Computer vision for infrastructure inspection and AIOps for hybrid cloud management are also gaining traction, automating physical and virtual asset management.
What are the key market drivers leading to the rise in the adoption of Cloud Telecommunications AI Industry?
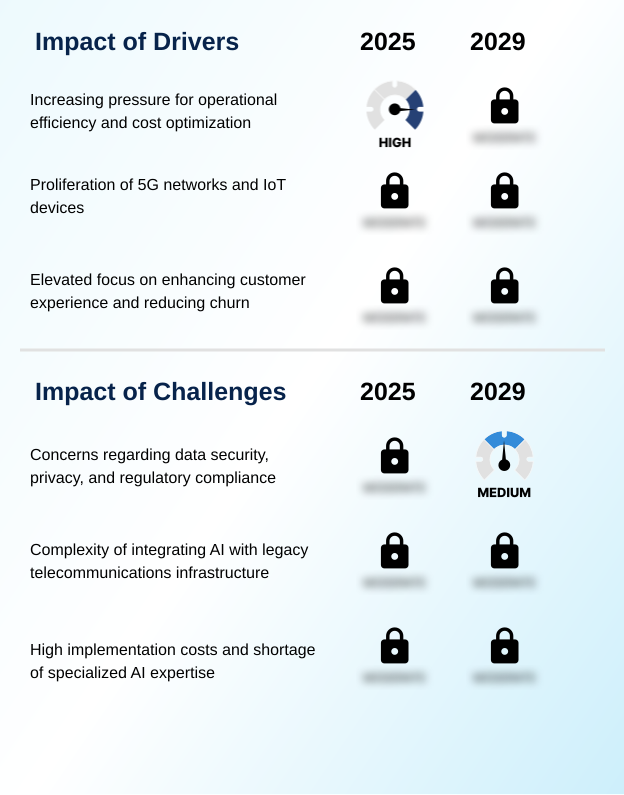
- The increasing pressure for operational efficiency and cost optimization is a key driver propelling market growth.
- The push for operational efficiency is a primary driver, with AI-powered predictive maintenance reducing network downtime by over 25% and maintenance costs by 15%.
- The complexity of 5G necessitates self-optimizing networks capable of dynamic radio resource allocation and ensuring spectral efficiency. Technologies like software-defined networking (SDN) and network function virtualization (NFV) are foundational, enabling intelligent service orchestration.
- The need to enhance customer experience drives the adoption of natural language processing (NLP) in conversational interfaces, improving first-call resolution by 30%.
- These advancements also support new revenue streams, particularly in industrial IoT, where AI-managed low-latency communication is essential for automation and control, enabling proactive maintenance schedule planning for connected machinery.
What are the market trends shaping the Cloud Telecommunications AI Industry?
- A significant trend influencing the market is the emergence of generative AI. It is being leveraged for enhanced operations and deeper customer engagement.
- A paradigm shift is occurring with the integration of generative AI, enabling operators to automate the creation of network configuration script files, which reduces manual errors by up to 35%. The move towards AI-as-a-Service is another key trend, with some operators seeing a 20% increase in enterprise revenue from these new offerings.
- The deployment of edge AI, also known as distributed AI, is crucial for applications requiring ultra-low latency. This is driving the development of hybrid AI models and hybrid cloud mesh architectures. This approach reduces demands on backhaul network capacity and facilitates real-time video analytics for public safety, a core component of future smart city infrastructure.
- This evolution supports the broader goal of closed-loop automation.
What challenges does the Cloud Telecommunications AI Industry face during its growth?
- Concerns regarding data security, privacy, and regulatory compliance represent a key challenge affecting industry growth.
- A formidable challenge is the complexity of systems integration with legacy operational support systems (OSS) and business support systems (BSS), which can consume up to 60% of an AI project's budget. Creating a unified data fabric through extensive data migration is a prerequisite, yet navigating data privacy legislation adds significant overhead, with compliance costs increasing by over 20% annually.
- The shortage of talent often leads to reliance on expensive managed service providers. This environment necessitates careful risk assessment and business process reengineering to implement advanced security like deep packet inspection and prevent revenue leakage prevention failures, while also planning for future technologies like a telco-specific large language model.
Exclusive Technavio Analysis on Customer Landscape
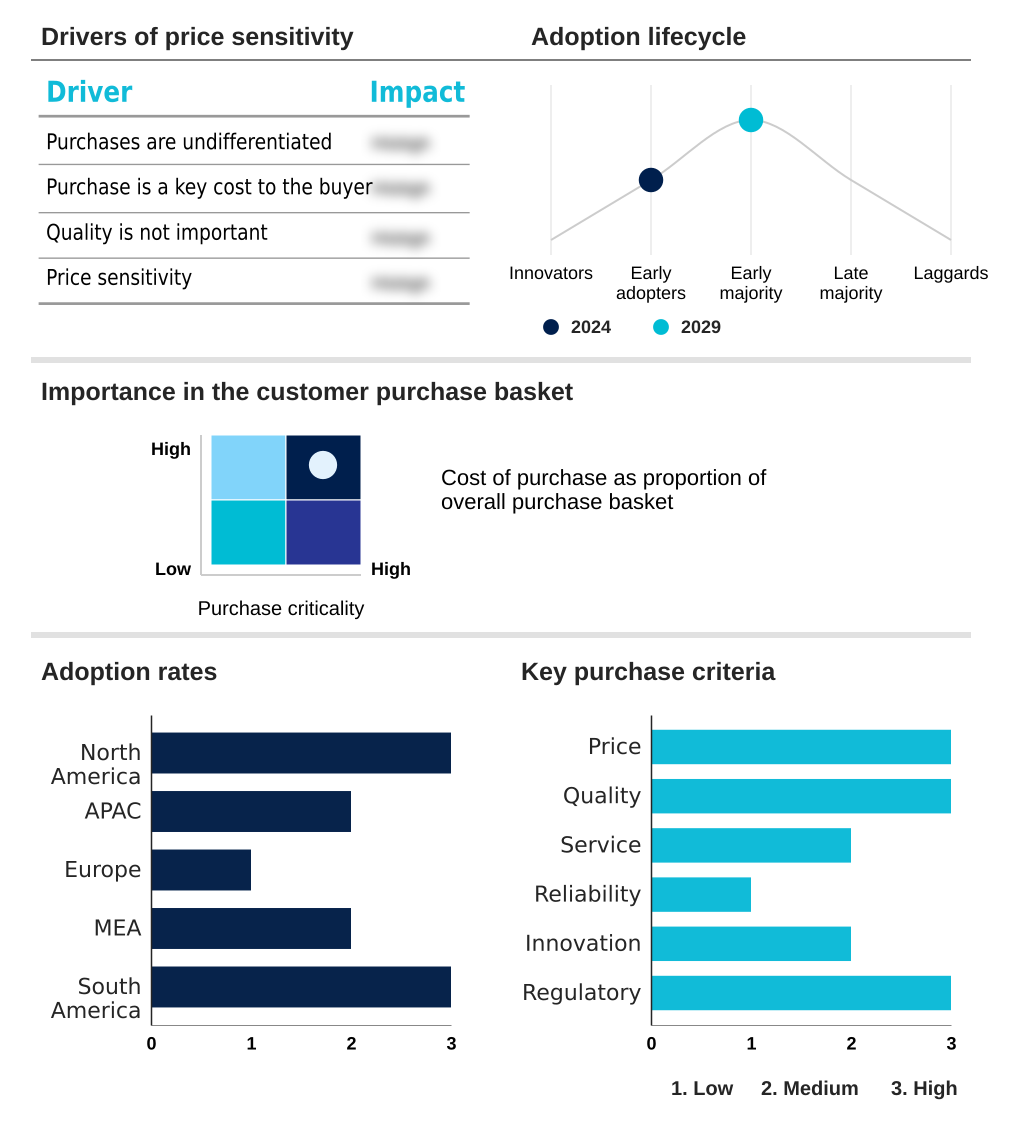
The cloud telecommunications ai market forecasting report includes the adoption lifecycle of the market, covering from the innovator’s stage to the laggard’s stage. It focuses on adoption rates in different regions based on penetration. Furthermore, the cloud telecommunications ai market report also includes key purchase criteria and drivers of price sensitivity to help companies evaluate and develop their market growth analysis strategies.
Customer Landscape of Cloud Telecommunications AI Industry
Competitive Landscape
Companies are implementing various strategies, such as strategic alliances, cloud telecommunications ai market forecast, partnerships, mergers and acquisitions, geographical expansion, and product/service launches, to enhance their presence in the industry.
Amazon Web Services Inc. - Offers cloud telecommunications AI, including generative AI and network modernization, to enable customer experience transformation and analytics on a scalable cloud platform.
The industry research and growth report includes detailed analyses of the competitive landscape of the market and information about key companies, including:
- Amazon Web Services Inc.
- AT and T Inc.
- BT Group Plc
- Cisco Systems Inc.
- Google Cloud
- HCL Technologies Ltd.
- Huawei Technologies Co. Ltd.
- IBM Corp.
- Microsoft Corp.
- Nokia Corp.
- NVIDIA Corp.
- Oracle Corp.
- Rakuten Group Inc.
- Salesforce Inc.
- SAP SE
- Telefonaktiebolaget Ericsson
- Telstra Corp. Ltd.
- Verizon Communications Inc.
- ZTE Corp.
Qualitative and quantitative analysis of companies has been conducted to help clients understand the wider business environment as well as the strengths and weaknesses of key industry players. Data is qualitatively analyzed to categorize companies as pure play, category-focused, industry-focused, and diversified; it is quantitatively analyzed to categorize companies as dominant, leading, strong, tentative, and weak.
Recent Development and News in Cloud telecommunications ai market
- In April 2025, Verizon announced it was leveraging Google Cloud's generative AI technology to create more intuitive and effective customer service experiences, aiming to make interactions more conversational and solutions more personalized.
- In February 2024, Deutsche Telekom announced it was spearheading a collaborative effort with other major operators and technology partners to develop a telco specific large language model to revolutionize customer service.
- In March 2024, NVIDIA announced its 6G Research Cloud platform, a comprehensive suite to advance next-generation wireless technology using advanced AI, machine learning, and deep learning for developing and simulating novel radio access network technologies.
- In August 2025, AT and T and Cisco announced an expanded collaboration to deliver a global, managed Secure Access Service Edge solution, leveraging AI and machine learning for continuous risk assessment and threat detection.
Dive into Technavio’s robust research methodology, blending expert interviews, extensive data synthesis, and validated models for unparalleled Cloud Telecommunications AI Market insights. See full methodology.
| Market Scope | |
|---|---|
| Page number | 315 |
| Base year | 2024 |
| Historic period | 2019-2023 |
| Forecast period | 2025-2029 |
| Growth momentum & CAGR | Accelerate at a CAGR of 26.1% |
| Market growth 2025-2029 | USD 12788.7 million |
| Market structure | Fragmented |
| YoY growth 2024-2025(%) | 24.8% |
| Key countries | US, Canada, Mexico, China, Japan, India, South Korea, Australia, Indonesia, Germany, UK, France, Italy, The Netherlands, Spain, Saudi Arabia, UAE, South Africa, Israel, Turkey, Brazil, Argentina and Colombia |
| Competitive landscape | Leading Companies, Market Positioning of Companies, Competitive Strategies, and Industry Risks |
Research Analyst Overview
- The cloud telecommunications AI market is defined by the strategic imperative to automate complex network functions and create new value streams from data. At the core, technologies like machine learning and deep learning, natural language processing (NLP), and computer vision are being applied to vast datasets to achieve self-optimizing networks.
- Boardroom decisions are increasingly focused on balancing the high costs of systems integration and data migration against the long-term ROI from enhanced efficiency. A critical focus is on the radio access network (RAN), where AI-driven radio resource allocation and deep reinforcement learning models are key to maximizing spectral efficiency and delivering on stringent service level agreements (SLA).
- The adoption of network function virtualization (NFV) and software-defined networking (SDN) provides the architectural flexibility required for these AI systems. Implementations have demonstrated a capability to perform root cause analysis up to 70% faster than manual methods, directly impacting quality of service (QoS).
- This evolution is paving the way for advanced concepts like the 6G research cloud and hybrid cloud mesh architectures.
What are the Key Data Covered in this Cloud Telecommunications AI Market Research and Growth Report?
-
What is the expected growth of the Cloud Telecommunications AI Market between 2025 and 2029?
-
USD 12.79 billion, at a CAGR of 26.1%
-
-
What segmentation does the market report cover?
-
The report is segmented by Deployment (Public cloud, Private cloud, and Hybrid cloud), Application (Network optimization and management, Customer experience management, Fraud detection and security, Predictive maintenance, and Others), Technology (Machine learning and deep learning, Natural language processing, Reinforcement learning and AI Ops, Computer vision, and Others) and Geography (North America, APAC, Europe, Middle East and Africa, South America)
-
-
Which regions are analyzed in the report?
-
North America, APAC, Europe, Middle East and Africa and South America
-
-
What are the key growth drivers and market challenges?
-
Increasing pressure for operational efficiency and cost optimization, Concerns regarding data security, privacy, and regulatory compliance
-
-
Who are the major players in the Cloud Telecommunications AI Market?
-
Amazon Web Services Inc., AT and T Inc., BT Group Plc, Cisco Systems Inc., Google Cloud, HCL Technologies Ltd., Huawei Technologies Co. Ltd., IBM Corp., Microsoft Corp., Nokia Corp., NVIDIA Corp., Oracle Corp., Rakuten Group Inc., Salesforce Inc., SAP SE, Telefonaktiebolaget Ericsson, Telstra Corp. Ltd., Verizon Communications Inc. and ZTE Corp.
-
Market Research Insights
- The market's dynamics are shaped by a strategic shift from reactive management to proactive automation. The pursuit of a fully autonomous network is driving the adoption of intelligent network slicing and service orchestration, with early adopters reporting a 15% improvement in network resource utilization.
- Enhanced customer journey analytics and churn prediction models, powered by sophisticated sentiment analysis, are becoming standard tools for customer retention, reducing churn rates by as much as 5% in competitive markets. The expansion of edge AI and distributed AI is enabling AI-as-a-Service offerings, creating new revenue streams.
- These deployments are underpinned by a focus on network security posture and risk assessment to comply with evolving data sovereignty regulations and prevent revenue leakage prevention failures.
We can help! Our analysts can customize this cloud telecommunications ai market research report to meet your requirements.
 RIA -
RIA - 
